

Abstract
Health and safety professionals, and the public, are interested in the best methods of providing timely information about disasters. The objective of this study was to examine information sources used for Superstorm Sandy with respect to the storm, evacuation routes, shelters, safety, and health issues. Respondents in Central New Jersey and Jersey Shore communities were differentially impacted by the storm. Jersey shore respondents had higher evacuation rates (47 % vs 13 %), higher flood waters in homes, longer power outages (average 23 vs 6 days), and longer periods without internet (29 vs 6 days). Electricity outages disrupted both sources and receivers of communication. Both groups obtained most of their information regarding safety from television, radio, friends and web/email. Information sources on health varied by location, with central Jersey respondents using mainly TV and the web, and Jersey shore respondents obtaining health information from the radio, and TV (before the storm). For information on evacuation routes, Jersey shore respondents obtained information from many sources, while central Jersey respondents obtained it from TV. Information on mold was largely obtained from friends and the web, since mold issues were dealt with several weeks after Sandy. The reliance on traditional sources of information (TV, radio, friends) found in this study suggests that the extreme power outages rendered web, cell phones, and social media on cell phones less usable, and suggests the need for an integrated communication strategy with redundancies that takes into account prolonged power outages over large geographical areas.
Keywords: Health concerns, Information sources, New Jersey, Preparedness, Superstorm Sandy
On average, disasters occur somewhere in the world each day, including natural events (floods, hurricanes, tornados, earthquakes) and non-natural events (transportation or industrial accidents, bombs, shooting sprees) (Norris et al., 2009). Such events (1) share the ability to threaten lives and property, (2) disrupt emergency services and infrastructure, (3) result in evacuation and displacement of varying distance and duration, (4) increase health risks, and (5) disrupt communities. Over 50 % of the US population lives in coastal watershed counties (NOAA, 2013; Crosset et al., 2013), where the frequency, intensity and duration of hurricanes is predicted to increase (Lane et al., 2013). Superstorm Sandy (hereafter referred to as Sandy) made landfall in New Jersey and New York 29–30 October 2012, resulting in 159 deaths and causing over $70 billion in damages (Freedman, 2013). Such events are extremely stressful to individuals and communities (Neria et al., 2007; North et al., 2012; Neria and Shultz, 2013), and stress may be increased by lack of reliable and trusted information either before an on-coming storm, or in its aftermath.
This study examined information sources used by individuals in New Jersey before, during, and after Sandy. People were surveyed in coastal communities, and in central New Jersey. Four general questions were assessed : 1) Whom did you trust for information about evacuation routes before Sandy made landfall?, 2) How did you obtain general safety information during and after Sandy? 3) How did you obtain information about health issues during and after Sandy?, and 4) Where did you obtain information about mold remediation after Sandy? (one of the key public health issues following Sandy, ALIGN, 2013). Information sources for mold (health effects, remediation methods) were also examined because it is one of the serious side-effects of massive flooding (Brandt et al., 2006). Obtaining information on these 4 questions will help chart a path forward that enhances preparedness, taking into account what actually worked during the Sandy disaster. With the rise in web-based access, including social media through cell phones, the forms of communication are now more varied, but it is unclear what actually works during a disaster. Part of preparedness is managing communication issues (Flynn, 2012), which clearly involves sources of information, as well as the information itself. There are three components of communication: a) communication channel has to be operational, b) information has to be timely and reliable, and c) receptors need to trust the information and believe it applies to them. During a disaster characterized by electricity outages lasting days, the sources may be non-operational and/or the receptors may lack access.
New Jersey and New York were particularly hard hit by Sandy, as it stalled over the region. Thousands of homes were without power for weeks, and many people were displaced from homes damaged by storm surges, flooding, and loss of power. Mandatory evacuation orders were issued for some shore communities before the storm, but not for others. Some individuals sheltered in place, while others evacuated to shelters or the homes of family or friends. Many subjects evacuated after the storm due to lack of electricity, heat, and food, and contaminated drinking water (Kratovil, 2012). In the aftermath, coastal homes and businesses were submerged in flood water for weeks, and 9 months later, many people are still displaced. Over 345,000 housing units were destroyed in New Jersey alone, with nearly $3 billion in damages to NJ transit, roads, and bridges (BBB, 2012). Even students in undamaged dormitories and others were evacuated post-Sandy because of drinking water contamination (Kratovil, 2012).
Serious health conditions, emotional distress, and grief follow such disasters (Galea et al., 2005, 2007; Hobfoll et al., 2007; McLaughlin et al., 2010; Shear et al., 2011). Post-disaster needs assessments are essential to understand construction and rebuilding, as well as post-disaster mental health assessments (Kessler et al., 2008). Equally important is determining how individuals obtained information regarding the storm, conditions, health effects, and evacuation routes (Cutter and Smith, 2009). In many cases, effective disaster planning must account for specific obstacles to action (sheltering in place, evacuation), and lack of information may be problematic, especially for vulnerable populations (Eisenman et al., 2007). Sound public policy and communication strategies can only be developed with a solid information base (Fairbank and Gerrity, 2007; Schoenbaum et al., 2013). Reynolds and Seeger (2005) suggested that crisis and emergency risk communication need to be an integrative model that involves communication before, during, and after a disaster. Such models are critical for development of a strategy to deal with storm-related disasters. However, as well as the message, it is important to understand the sources people use to obtain information, and whether this varies by age, location, or income. The present study addressed the need for information on communication methods that were successful. The study commenced shortly after Sandy, and many of the interviewees were still displaced.
METHODS
Under approved human subjects protocols from Rutgers University, people were interviewed along coastal New Jersey from Sandy Hook to Atlantic City (N = 347), and in central New Jersey centered around New Brunswick (N = 407). No personal identifiers were obtained. Interviews were conducted where subjects gathered, including town hall meetings, public meetings, FEMA and town offices, shelters, homes, recreation centers, universities, convenience stores and fast food places. The latter were often the only sources of food and supplies immediately following the storm. People were also interviewed at make-shift food and coffee bars set up on street corners, as well as individuals assessing damage and making repairs. Everyone present was approached for an interview, and had a very low refusal rate (< 5 %). People were asked if they would participate in a survey being conducted by Rutgers University, and were told it was voluntary. An interview lasted about 20–25 min, but interviewers remained to talk with respondents about their concerns. Interviews were conducted within 100 days of Sandy to ensure that subjects remembered their concerns and information sources.
This study mainly addresses information sources; health effects data may be found elsewhere (Burger and Gochfeld, personal communication). The survey instrument had 6 categories, including (1) storm effects (property damage, flooding, evacuation, loss of power), (2) general concerns before, during and after Sandy, (3) information sources (used and trusted), (4) health concerns, (5) renovations/repairs and mold, and (6) demographics. Demographics were asked last so that individuals were at ease with providing information on ethnicity and income. Since the questions were open-ended, people could give multiple, unprompted answers.
Differences among groups were examined using Kruskal-Wallis non-parametric Analysis of Variance. A P < 0.05 was considered statistically significant. For the types of information used, sources used by coastal and central Jersey respondents were collapsed when few people gave that answer ( = other). However, these sources are listed in the table because they are important for understanding the range of sources used.
RESULTS
Demographics and Damage
Table 1 provides demographic information, evacuation status, height of flooding, mold status, and disruption of communication. The populations were similar in gender (about half female) and education (average 14–15 years). Shore respondents were older (average age 52 vs 33 years), had higher incomes (reported income average $69k vs $59k), and more likely to be white (87 vs 47%). Shore respondents were more likely to live in a private home (84 vs 71%), were more likely to have evacuated (47 vs 13%). and were more likely to have encountered mold (42 vs 10%), than respondents in central Jersey. Damage differed between the two areas. More shore respondents evacuated before (mandatory), during, and after Sandy (Table 1) and more lost electricity 95 vs 83%. Most significantly shore respondents averaged 22.8 days without electricity and 28.9 days without internet compared to 6 and 6.5 days for central New Jersey. Length of time without the internet depended upon whether respondents lived along the coast or in central New Jersey, and varied by provider (Table 2).
Table 1.
Demographics and effects from Superstorm Sandy.
| Central New Jersey (N=409) |
Jersey Shore (N=347) |
Kruskal Wallis test |
|
|---|---|---|---|
| Mean Std Error | Mean Std Error | Chi-square (p) | |
| Age | 32.64 ± 0.76 | 51.79 ± 0.76 | 218 (<0.0001) |
| Years of education | 13.57 ± 0.27 | 14.98 ± 0.12 | NS |
| Income | 59,054 ± 7,196 | 68,683 ± 3,247 | 15.8 (<0.0001) |
| % Female | 51.6% | 46.5% | NS |
| Ethnicity | 156 (<0.0001) | ||
| Caucasian | 46.6% | 86.8% | |
| Hispanic/Latino | 7.2% | 5.6% | |
| African American | 6.5% | 4.7% | |
| Indian | 10.9% | 1.8% | |
| Asian | 23.3% | 1.2% | |
| Other | 5.4% | ||
| % Live in House | 71.4% | 84.3% | 15.7 (<0.0001) |
| % that Lost Electricity | 91.9% | 99.4% | 24.0 (<0.0001) |
| % Evacuated | 13.1% | 46.8% | 103 (<0.0001) |
| % with Mold after Sandy | 10.1% | 42.0% | 90.8 (<0.0001) |
| Distance to Ocean (km) | 34.2 ± 1.7 | 3.4 ± 0.35 | 384 (<0.0001) |
| Height of water in House (cm) | 39.4 ± 7.1 | 92.6 ± 7.4 | 26.3 (<0.0001) |
| Days w/o electricity? | 6.01 ± 0.32 | 22.8 ± 1.36 | 242 (<0.0001) |
| Days w/o Internet? | 6.45 ± 0.41 | 28.9 ± 1.72 | 235 (<0.0001) |
Table 2.
Responses of New Jersey residents following Superstorm Sandy. The question was "Who is your internet provider and how many days was service out?".
| Central New Jersey | Jersey Shore | ||||||
|---|---|---|---|---|---|---|---|
| Frequency | Percent | Mean Days without Service |
Frequency | Percent | Mean Days without Service |
Kruskal Wallis test comparing days out |
|
| Verizon | 133 | 35.6% | 6.7 | 90 | 35.4% | 28.8 | 67.0 (<0.0001) |
| Comcast | 84 | 22.5% | 7.1 | 96 | 37.8% | 28.9 | 63.9 (<0.0001) |
| Optimum | 101 | 27.0% | 6.4 | 33 | 13.0% | 24.9 | 38.6 (<0.0001) |
| AT&T | 38 | 10.2% | 6.7 | 9 | 3.5% | 16.0 | 4.8 (0.03) |
| Cablevision | 10 | 3.9% | 24.4 | ||||
| Direct TV | 2 | 0.8% | 15.0 | ||||
| Other | 16 | 4.2% | 2.9 | ||||
Evacuation Information
One of the most important communication issues was the provision of evacuation information, which was generally provided well before the storm. Predictions that eventually proved accurate, about Sandy’s projected path, were available up to 5 days in advance. Such information was provided with much hyperbole on TV and radio, and also by police, fire and reverse 911. As the storm approached, the Governor repeatedly urged evacuation. Although evacuation was mandatory for many shore communities, it was not universally heeded. Central New Jerseyans were advised to shelter in place, although public shelters were available. Shore respondents trusted nearly equally TV, radio, reverse-911, police and fire for this information (Figure 1). There were age-related differences, with trust in TV and reverse-911 decreasing with age, and trust in radio increasing (Table 3). However, reverse 911 was important for all age groups. There was no significant difference in how different ages used the top 6 categories (Table 3).
Figure 1.
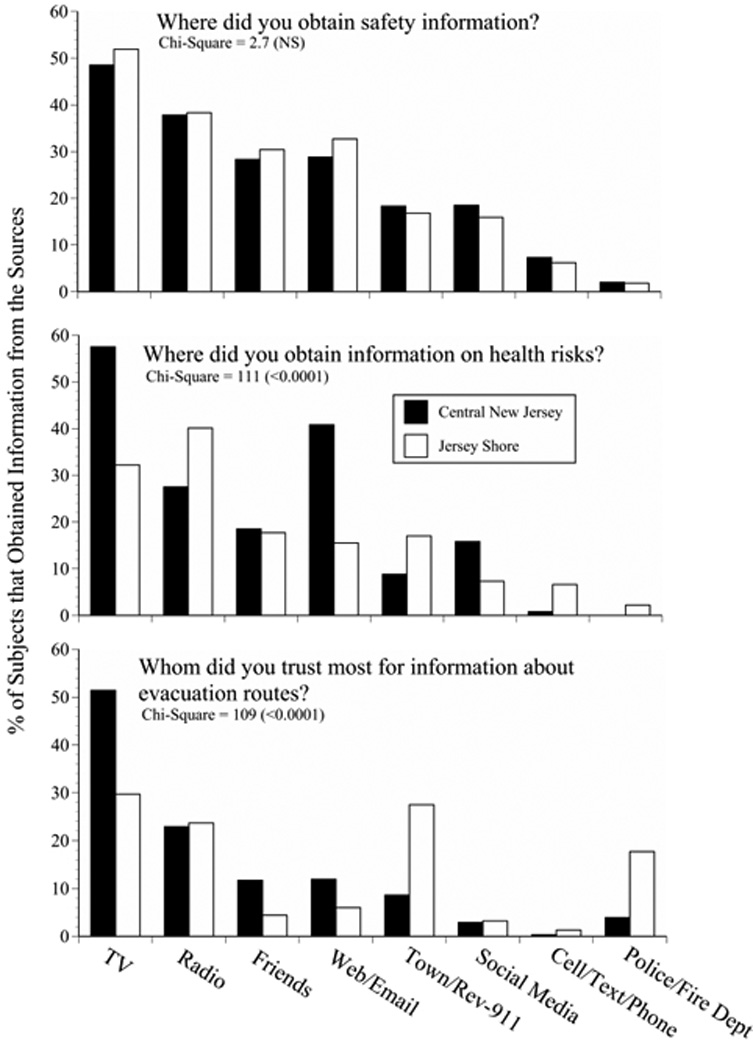
Information sources used by respondents in central and coastal New Jersey within 100 days of landfall of Superstorm Sandy. These are the major information sources used and trusted.
Table 3.
Responses for Jersey Shore residents only to the question "Who do (or did) you trust most for information about Evacuation Routes?". Respondents could have more than one. Chi-square comparing age groups was 47.7 (p=0.04).
| 17–45 Years Old n=103 |
46–64 Years Old n=158 |
Over 65 Years Old n=55 |
||||
|---|---|---|---|---|---|---|
| Frequency | Percent | Frequency | Percent | Frequency | Percent | |
| TV | 41 | 39.8% | 43 | 27.2% | 10 | 18.2% |
| Town/Rev-911/Local Government | 35 | 34.0% | 43 | 27.2% | 15 | 27.3% |
| Radio | 19 | 18.4% | 41 | 25.9% | 15 | 27.3% |
| Police | 13 | 12.6% | 27 | 17.1% | 8 | 14.5% |
| Self | 10 | 9.7% | 19 | 12.0% | 2 | 3.6% |
| Web Access | 8 | 7.8% | 10 | 6.3% | 0 | 0.0% |
| Friends | 5 | 4.9% | 7 | 4.4% | 2 | 3.6% |
| Government | 5 | 4.9% | 6 | 3.8% | 3 | 5.5% |
| Social Media | 6 | 5.8% | 2 | 1.3% | 3 | 5.5% |
| All/Any info you can get | 4 | 3.9% | 3 | 1.9% | 3 | 5.5% |
| Fire Dept | 1 | 1.0% | 4 | 2.5% | 3 | 5.5% |
| News | 2 | 1.9% | 4 | 2.5% | 2 | 3.6% |
| Family | 2 | 1.9% | 2 | 1.3% | 2 | 3.6% |
| State/Governor | 1 | 1.0% | 2 | 1.3% | 2 | 3.6% |
| Other | 4 | 3.9% | 12 | 7.6% | 3 | 5.5% |
Health and Safety Information
Under the general category of safety, there were few differences in information sources. People obtained information before the storm from TV, radio, friends and the web (Figure. 1). There were, however, many other sources where subjects obtained information about their own safety (Table 4). During and after the storm information choices were more limited due to loss of electricity; individuals used portable and car radios. Many respondents reported being isolated because of communication outage and limited travel, which was severely limited first by flooding and drifted sand and later by gasoline shortage.
Table 4.
Percent of respondents from Central New Jersey and the Jersey Shore that obtained safety information from the following sources during and after Superstorm Sandy. People often gave more than one response. Chi-square comparing the 2 study sites = 3.1 (p=NS)
| Where did you obtain information about your safety? | ||||
|---|---|---|---|---|
| Central New Jersey n=400 |
Jersey Shore n=339 |
|||
| Frequency | Percent | Frequency | Percent | |
| TV | 194 | 48.5% | 176 | 51.9% |
| Radio | 151 | 37.8% | 130 | 38.3% |
| Friends | 113 | 28.3% | 103 | 30.4% |
| Web | 90 | 22.5% | 91 | 26.8% |
| Town/Rev-911 | 73 | 18.3% | 57 | 16.8% |
| Social Media | 74 | 18.5% | 54 | 15.9% |
| Cell/Text/Phone | 29 | 7.3% | 21 | 6.2% |
| 25 | 6.3% | 20 | 5.9% | |
| Police/Fire Dept | 8 | 2.0% | 6 | 1.8% |
| None | 5 | 1.3% | 9 | 2.7% |
| Family | 4 | 1.0% | 9 | 2.7% |
| Self | 5 | 1.3% | 6 | 1.8% |
| Other | 3 | 0.8% | 2 | 0.6% |
| Newspaper | 3 | 0.8% | 1 | 0.3% |
| All | 2 | 0.5% | 2 | 0.6% |
| FEMA | 2 | 0.5% | 0 | 0.0% |
| EMS | 0 | 0.0% | 1 | 0.3% |
| Hotline | 0 | 0.0% | 1 | 0.3% |
| Library | 0 | 0.0% | 1 | 0.3% |
| Neighbor | 0 | 0.0% | 1 | 0.3% |
| Red Cross | 0 | 0.0% | 1 | 0.3% |
| Rutgers | 0 | 0.0% | 1 | 0.3% |
| Word of Mouth | 0 | 0.0% | 1 | 0.3% |
There were locational differences in where people obtained information about their health (Figure 1, Table 5). Respondents from central New Jersey mainly obtained their information from the TV and web-based sources, while coastal respondents obtained their information from a range of sources. This largely reflects their longer period without electricity. Some communities went three weeks before people had electricity, and they relied heavily on radio, friends, and other sources. A full list of sources respondents gave to the open-ended question are shown in Table 5).
Table 5.
Percent of subjects (N = 739) from the Jersey Shore and Central New Jersey that obtained health risk information from the following sources. People often gave more than one response. Chi-square comparing the two sites = 124 (<0.0001).
| Where did you obtain information about health risks from Sandy? | ||||
|---|---|---|---|---|
| Central New Jersey | Jersey Shore | |||
| Frequency | Percent | Frequency | Percent | |
| TV | 230 | 57.5% | 102 | 32.2% |
| Radio | 110 | 27.5% | 127 | 40.1% |
| Web/Email | 163 | 40.8% | 49 | 15.5% |
| Friends | 74 | 18.5% | 56 | 17.7% |
| Town/Rev-911 | 35 | 8.8% | 54 | 17.0% |
| Social Media | 63 | 15.8% | 23 | 7.3% |
| Nothing Worked/None | 4 | 1.0% | 24 | 7.6% |
| Phone | 3 | 0.8% | 21 | 6.6% |
| Family | 3 | 0.8% | 8 | 2.5% |
| Self | 0 | 0.0% | 11 | 3.5% |
| Police/Fire Department | 0 | 0.0% | 7 | 2.2% |
| Newspaper | 2 | 0.5% | 5 | 1.6% |
| Other | 4 | 1.0% | 2 | 0.6% |
| All | 2 | 0.5% | 3 | 0.9% |
| Doctor/Hospital/EMS | 2 | 0.5% | 3 | 0.9% |
| Neighbor | 1 | 0.3% | 4 | 1.3% |
| FEMA | 2 | 0.5% | 1 | 0.3% |
| Rutgers | 2 | 0.5% | 0 | 0.0% |
| Word of Mouth | 0 | 0.0% | 2 | 0.6% |
| NOAA | 0 | 0.0% | 1 | 0.3% |
| Red Cross | 0 | 0.0% | 1 | 0.3% |
Mold information
One of the key problems following severe flooding along the New Jersey shore (and elsewhere in the northeast), was mold. This problem was greater for coastal respondents (42 % reported mold after Sandy) than for central Jersey respondents (10 %, no change from pre-Sandy). There are two types of information individuals need about mold: health risks and effects, and what to do about preventing and eliminating mold. The appearance of visible mold was obvious to many respondents, and the average rating of shore respondents for health effects from mold in their homes was 4.03 out of a scale of 5 (5= greatest problem). For comparison, average shore respondents rating for water damage in their homes was 4.64. The sources of information shore respondents used for mold are presented in Figure 2. Friends and the web were the most frequently used sources. By the time shore respondents were allowed back into their communities and homes, many had access to the web.
Figure 2.

Sources for information on mold given by respondents in New Jersey within 100 days of landfall of Superstorm Sandy
DISCUSSION
Vulnerability and communication
Densely populated areas may be particularly vulnerable to severe storms because of the effect of power and utility outages (Lane et al., 2013). The extended loss of electricity had extreme effects on medical care and facilities as some hospitals had to transfer patients to other facilities, academic research was disrupted, people were evacuated, and offshore radar systems were destroyed (Malakoff, 2012). The list of infrastructure damage is long, and many facilities had not yet recovered by 9 months. For the public, however, loss of electricity disrupted communication. In the aftermath of the storm, many respondents wanted to voluntarily evacuate, but needed information on where to go and how to get there. The relatively long period without electricity for most shore respondents (average off 23 days, Table 1) was an unprecedented unusual event, and one that preparedness plans had not considered. Usual power outages are only 3 or 4 days long, and for smaller geographical areas of New Jersey, not the entire area. In the aftermath of Sandy, nearly everyone was without power for some time. During such a disaster, information transfer becomes critical; communication is essential about the storm itself, whether to evacuate and to where, how to learn of shelters, and where to find food, medical supplies, and other necessities (among other concerns). The new reality of such long periods of power outages, for large sections of a state, and for millions of people, require new strategies for “hardening” the electricity system, and redundant approaches for dealing with information transfer (Freedman, 2013).
Americans obtain much health information through television (Brodie et al., 2011). However, communication has changed dramatically in the last two decades due to changes in the internet, expansion of web sources and social media, and the rapid increase of cell phones for the majority of the population; 91 % of Americans have cell phones (Brenner, 2013). There is a growing cell phone-only population, particularly among the young individuals (Link et al., 2007). Young adults are more likely than older ones to use social media (Duggan and Brenner, 2013). Further, there has been an increase in using the internet and cell phones as the source of health information (Santosh et al., 2009). These changes suggest that web-access forms of communication and social media might play a major role in dissemination of information before, during, and after a disaster, and the present survey examined these issues.
Surprisingly, although rather sophisticated satellite observations monitored the progress of Superstorm Sandy, and the distribution of power outages (Molthan and Jedlovec, 2013), actually monitoring and assisting information flow on the ground for affected areas, such as New Jersey, was difficult due to these power outages, evacuation and displacements of subjects, disruption of roads and bridges, and loss of mass transit. A clear need for the creation and implementation of a hurricane risk information (and health information) plan is essential to improve health and safety and reduce risks and property damage. These information needs range from general and specific scientific information about a storm to emergency measures and societal needs (Demuth et al., 2012). Preparing for future storms may well be improved by understanding the role of different communication modes that functioned effectively during Superstorm Sandy. Equally important, however, is achieving trust in the information. Many respondents doubted the dire predictions and remembered the warnings about Hurricane Irene in 2011 which produced more damage in central than coastal New Jersey. As often happens, the media played up the conflicts among prediction models, leading listeners to question the most severe (but ultimately accurate) predictions.
Functionality of information sources
Data gathered in the present study clearly indicate that TV and radio were the sources of information regarding safety, health risks, and evacuation routes before the storm. During the storm people relied on whatever source was functioning, and in many communities, web access and cell phones were not operating. Individuals in central New Jersey were without power and internet for an average of 6 days, and respondents along the coast were without them for 23 days and 29 days respectively (Table 1). Length of loss of internet depended not only on local power outages, but on the resilience of the internet provider. Since power was out for less time for central Jersey respondents, the web could be used more quickly in these areas. Friends accounted for much of the information, mainly because respondents talked to neighbors and others living nearby. Finally, many towns had reverse 911 lines set up whereby they called town residents to keep them informed about the storm, shelters, evacuation routes, and other storm-related information. This relatively new form of communication worked only in places where either land lines or cell phones were still operating. It was also particularly effective before the storm hit, before there were power outages.
Generally, TV and radio were the key sources of information. There were some differences in the information sources used as a function of location (coastal vs central), type of information, and age. There were age-related differences, as might be expected, in information sources used. Reliance on radios increased with age, and use of TV and Reverse-911 decreased with age. Remarkably, police and fire forces were not generally used as sources of information, except for evacuation for respondents living along the shore. This partly reflects the inability of people to contact the police or fire, the necessity of police and fire to deal with emergencies rather than information flow, and the same loss of power for police and fire personnel. Finally, fire, police and other emergency personnel were dealing with their own households without power as well as with community health and safety. Responses thus varied as a function of distance from the coast, as noted by Trumbo et al. (2011).
The present study, however, suggests that a clear re-evaluation of the communication channels open to people before, during and after a severe storm, such as Superstorm Sandy, is necessary. While by their very nature, crisis and emergency risk communication is chaotic and uncertain, and equivocal (Reynolds and Seeger 2005), it is still essential to develop a strategy for both the messages, and the sources of information. Reliance on TV and radio were still critical sources of information for all ages in both central and coastal New Jersey. Yet despite frequent messages regarding personal preparedness, many respondents lamented that they had not really believed the apochryphal warnings and wished they had stocked up on batteries, flashlights, portable radios, fresh water and non-perishable food. Frequent messages admonishing subjects to assemble preparedness kits went unheeded. All the advances in cell phones, social media and the internet were not useful once power outages were extensive in time and space. Individuals could not charge cell phones or computers. TV was mainly used before Sandy hit, and after power was restored, while portable radio was used once power was out. The reliance on cell phones and the internet, which normally function, predisposed people to fail to prepare adequately for such failures. Many individuals did not have batteries for their cell phone, and could not use their car radios or charge their cell phones with the car because gas was at a premium (without power, gas stations could not pump gas, cash registers did not work, credit cards did not work, and there was gas rationing).
People were inventive; some subjects reported that they received news from TV, but the TV reports came to them via cell phones that still had power or via satellite phones (rather than relying on local towers). One person’s information originated from Europe via a cell phone, and another from the Middle East. Others listened to their car radios because they did not know where other radios were or they did not have batteries. These data suggest that people used every method possible to obtain information, but were often not prepared to deal with the combined loss of electricity, cell phones, and the web coupled with severe limits on travel
These results are generalizable to a large extent. However, it should be noted that this survey was a convenience survey of populations with different experiences, in different locations, but there is no reason to expect that it was biased with respect to information sources used. The fact that the two populations (coastal, central) used mainly the same sources for information suggests a uniformity of available information sources and also a uniformity of lost channels during outages. Further, all surveys have some disadvantages. For example, random digit dialing telephone sampling is suffering because of the increase number of cell-phone only users (Hu et al,. 2010), and use of both cell phones and landlines leads to biases in the population that will answer the phone, or even have such phones. In the present study, subjects were approached, and nearly everyone was willing to answer the survey.
Lessons learned for future research
This survey was conducted under trying conditions, immediately following the biggest natural disaster faced by New Jersey residents in their lifetime. The disaster was faced not only by shore residents, but by inland residents because of the prolonged power outages and wind damage that made roads impassable for days to weeks. Further, it was not only an individual disaster, but a community disaster as well. There were several lessons learned from the survey as conducted. These include: (1) temporal aspects of information sources should be examined in more detail (e.g. separate safety information sources during and after the storm), (2) examine information sources for individuals as a function of whether they had power at the time, or not, (3) distinguish the internet and social media sources more clearly, (4) examine the effectiveness of reverse 9–11, the situations it was used in, and whether people followed this advice or not, and finally, (5) separate the source from the method.
The importance of separating the source from the method was not recognized at the start of the study, but became clear part way through, when it was impossible to change the questions. Sources of information include friends, neighbors, family, mayors, town officials, emergency service people (police, fire), county or state officials, and the governor. The method of communication could be television, radio, internet, social medial, word-of-mouth, or other. The experiences of the investigators suggests that it might be useful to provide respondents with a table, and let them fill in a matrix of sources and methods for each concern (e.g. evacuation routes, safety, health, mold)(Table 6). People were anxious to talk about their experiences, and readily looked at a list of environmental concerns to give their opinion. This suggests that they would fill out such a matrix.
Table 6.
Suggested matrix for sources of information used by respondents as a function of sources and methods of information transfer. Both the relevant sources and methods should be site-specific and disaster-specific. People could then fill out the section themselves by putting an S for safety, H for health, and E for evacuation information. They could enter multiple answers for each of the types of information (S,H,E).
| Neighbors | Family other than neighbors |
Friends other than Neighbors |
Town officials |
EMS, police, fire |
Governor | State Government |
|
|---|---|---|---|---|---|---|---|
| TV | |||||||
| Radio | |||||||
| Web other than e-mail |
|||||||
| Reverse-911 | |||||||
| Word-of– mouth |
|||||||
| Other |
The questionnaire used in this study had several sections on demographics damage, evacuation behavior, safety concerns, health concerns, ratings of health and environmental concerns, and information sources. While this approach provides information on a wide range of responses and behaviors, it is more difficult to examine information sources in depth. Further, future researchers might consider conducting an information sources study at monthly intervals following a disaster to examine how trusted information sources shift over time. Such information could lead to time-dependent information strategies.
Conclusions
The sources of information used, and the sources available, depended upon the kind of information required as well as the availability of electrical power. Although some people had generators, these were not useful for many shore residents because the flooding made it dangerous or impossible to use them or because gasoline quickly became unavailable. Before the storm hit, subjects in both populations had access to all the information sources they normally used (TV, radio, web-access, cell phones, neighbors and friends). The information they needed related to the severity of the on-coming storm, evacuation orders, evacuation routes, and preparedness. During the storm, power was out for most respondents, and the information sources available were severely limited; they required information on health and safety, evacuation and shelters. After the storm, many individuals still needed information on evacuation routes, because without power, heat or food, they needed to leave. People still needed information on health and safety for themselves and their family, on food spoilage and on sources of safe drinking water. They especially needed information on what items to take when they did evacuate. Since the period without power was much longer for shore respondents, the information gap was greater, and the potential information sources were severely limited. These timelines for information needs, and for available information sources, need to be integrated into any long-term strategy for dealing with disasters. The new reality is for more severe storms, with longer and wider power outages. The implications of this trend are important for communication.
Acknowledgements
We particularly thank the respondents who gave willingly of their time to be interviewed. As well as personnel in food banks, health clubs, FEMA offices, and all places where interviews were conducted. This research was funded by a pilot grant from NIEHS (P30ES005022).
REFERENCES
- ALIGN. ALIGN, Community Voices Heard, Faith in New York, Make the Road NY, New York Communities for Change, and VOCAL-NY. New York: 2013. Sandy’s mold legacy: the unmet need six months after the storm. [Google Scholar]
- Barnegat Bay Beat (BBB) Special Report: Sandy-a record setting storm. Barnegat Bay Partnership Quart. Publ. 2012:7. [Google Scholar]
- Brandt M, Brown C, Burkhart J, Burton N, Cox-Ganser J, Damon S, et al. Mold prevention strategies and possible health effects in the aftermath of hurricanes and major floods. Morb Mortal. Week. Rep. 2006;55:1–27. [PubMed] [Google Scholar]
- Brenner J. Pew internet: mobile. [Accessed June 25, 2013];PewInternet. 2013 http://pewinternet.org/Reports/2012/best-worst-mobile.aspx.
- Brodie M, Foehr U, Rideout V, Baer N, Miller C, Flournoy R, Altman D. Communicating health information through the entertainment media. Health Aff. 2011;20:192–199. doi: 10.1377/hlthaff.20.1.192. [DOI] [PubMed] [Google Scholar]
- Burger J, Gochfeld M. (ms) Health Concerns and Perceptions of Central and Coastal New Jersey Residents Within 100 Days of Superstorm. Sandy. doi: 10.1016/j.scitotenv.2014.02.048. (under review) [DOI] [PMC free article] [PubMed] [Google Scholar]
- Crosset K, Cultiton T, Wiley P, Goodspeed T. [Accessed May 17, 2013];Population trends along the coastal United States 1980–2008. 2013 http://oceanservice.noaa.gov/programs/mb/pdfs/coastal.pop.trends.complete.pdf.
- Cutter SL, Smith MM. Fleeing from the huricane’ wrath: evacuation and the two Americas. [Accessed May 8, 2013];Environ. 2009 Mar-Apr; http://www.environmentmagazine.org/Archives/Back%20Issues/March-April%202009/Cutter-Smith-full.html.
- Demuth JL, Morss RE, Morrow BH, Lazo JK. Creation and communication of hurricane risk information. Am Meteorol. Soc. 2012 Aug;:1133–1145. [Google Scholar]
- Duggan M, Brenner J. [Accessed June 11, 2013];The demographics of social media users – 2012. 2013 http://pewinternet.org/Reports/2013/social-media-users.aspx.
- Eisenman DP, Cordasco KM, Asch S, Golden JF, Glik D. Disaster planning and risk communication with vulnerable communities: Lessons from Hurricane Katrina. Am. J. Public Health. Suppl. 2007;97:S109–S115. doi: 10.2105/AJPH.2005.084335. [DOI] [PMC free article] [PubMed] [Google Scholar]
- Fairbank JA, Gerrity ET. Commentary on “Five essential elements of immediate and mid-term mass trauma intervention: empirical evidence”. Psychiatry. 2007;70:316–319. doi: 10.1521/psyc.2007.70.4.283. [DOI] [PubMed] [Google Scholar]
- Flynn T. Into the crisis vortex: Managing and communicating issues, risks, and crises. J. Profess. Commun. 2012;2:43–52. [Google Scholar]
- Freedman A. Heeding Sandy’s lessons, before the next big storm. [Accessed May 12, 2013];Climate Central. 2013 www.climatecentral.org/news/four-lay-lessons-learned-from-hurricane-sandu-15928.
- Galea S, Nandi A, Vlahov D. The epidemiology of post-traumatic stress disorder after disasters. Epidemiol. Rev. 2005;27:78–91. doi: 10.1093/epirev/mxi003. [DOI] [PubMed] [Google Scholar]
- Galea S, Brewin CR, Gruber M, Jones RT, King DW, King LA, McNally RJ, Ursano RH, Petukhova M, Kessler RC. Exposure to hurricane-related stressors and mental illness after Hurricane Katrina. Arch. Gen. Psychiatry. 2007;64:1427–1434. doi: 10.1001/archpsyc.64.12.1427. [DOI] [PMC free article] [PubMed] [Google Scholar]
- Hobfoll SE, Watson P, Bell CC, Bryant RA, Brymer MJ, Friedman MJ, Friedman M, Gersons BP, de Jong J, Layne CM, Maguen S, Neria Y, Norwood AE, Pynoos RS, Reisssman D, Ruzek JI, Shalev AY, Soloman Z, Steinberg AM, Ursano RJ. Five essential elements of immediate and mid-term mass trauma intervention: empirical evidence. Psychiatry. 2007;70:283–315. doi: 10.1521/psyc.2007.70.4.283. [DOI] [PubMed] [Google Scholar]
- Hu SS, Balluz L, Battaglia MP, Frankel MR. The impact of cell phones on public health surveillance. Bull. World Health Org. 2010;88:799. doi: 10.2471/BLT.10.082669. [DOI] [PMC free article] [PubMed] [Google Scholar]
- Kessler RC, Keane TM, Ursano RJ, Mokdad A, Zaslavsky AM. Sample and design considerations in post-disaster mental health needs assessment tracking surveys. Int. J. Meth. Psychiatr. Res. 2008;17:S6–S20. doi: 10.1002/mpr.269. [DOI] [PMC free article] [PubMed] [Google Scholar]
- Kratovil C. Drinking water problems cause evacuation of every dorm in New Brunswick. [Accessed June 17, 2013];New Brunswick Today. 2012 http://newbrunswicktoday.com/article/drinking-water-concerns-cause-rutgers-pull-students-out-new-brunswick.
- Lane L, Charles-Guzman K, Wheeler K, Abid Z, Graber N, Matte T. Health effects of coastal storms and flooding in urgan areas: a review and vulnerability assessment. J. Environ. Pubic. Health. 2013;2013:1–13. doi: 10.1155/2013/913064. [DOI] [PMC free article] [PubMed] [Google Scholar]
- Link M, Battaglia M, Frankel M, Osborn I, Mokdad A. Reaching the US cell phone generation: comparison of cell phone survey results with ongoing landline telephone survey. Public Opin. Quart. 2007;71:814–839. [Google Scholar]
- Malakoff D. Scientists assess damage from Sandy’s deadly punch. Science. 2012;338:728–729. doi: 10.1126/science.338.6108.728. [DOI] [PubMed] [Google Scholar]
- Molthan A, Jedlovec G. Satellite observations monitor outages from Superstorm Sandy. EOS Transact Amer Geophys Union. 2013;94:53–60. [Google Scholar]
- McLaughlin KA, Fairbank JA, Gruber MJ, Jones RT, Osofsky JD, Pfefferbaum B, Sampson NA, Kessler RC. Trends in serious emotional disturbance among youths exposed to Hurricane Katrina. J. Am. Acad. Child Adolesc. Psychiatr. 2010;49:990–1000. doi: 10.1016/j.jaac.2010.06.012. [DOI] [PMC free article] [PubMed] [Google Scholar]
- Neria Y, Nandi A, Galea S. Post-traumatic stress disorder following disasters: A systematic review. Psychol. Med. 2007;38:467–480. doi: 10.1017/S0033291707001353. [DOI] [PMC free article] [PubMed] [Google Scholar]
- Neria Y, Shultz JM. Mental health effects of Hurricane Sandy: Characteristics, potential aftermath, and response. J. Am. Med. Assoc. 2013;308:2571–2572. doi: 10.1001/jama.2012.110700. [DOI] [PMC free article] [PubMed] [Google Scholar]
- NOAA (National Oceanographic and Atmospheric Administration. [Accessed April 3, 2012];Communities: the U.S. population living in coastal watershed counties. 2013 http://stateofthecoast.noaa.gov/coastal-population-report.pdf.
- Norris FH, Tracy M, Galea S. Looking for resilience: Understanding the longitudinal trajectories of responses to stress. Soc. Sci. Med. 2009;68:2190–2198. doi: 10.1016/j.socscimed.2009.03.043. [DOI] [PubMed] [Google Scholar]
- North CS, Oliver J, Pandya A. Examining a comprehensive model of disaster-related posttraumatic stress disorder in systematically studied survivors of 10 disasters. Am. J. Pubic. Health. 2012;102:40–48. doi: 10.2105/AJPH.2012.300689. [DOI] [PMC free article] [PubMed] [Google Scholar]
- Reynolds B, Seeger MW. Crisis and emergency rick communication as an integrative model. J. Health Commun. 2005;10:43–55. doi: 10.1080/10810730590904571. [DOI] [PubMed] [Google Scholar]
- Santosh K, Boren SA, Baias EA. Health care via cell phones: A systematic review. Telemed. e-health. 2009;15:231–240. doi: 10.1089/tmj.2008.0099. [DOI] [PubMed] [Google Scholar]
- Schoenbaum M, Butler B, Duan N. Promoting mental health after recovery from Hurricanes Katrina and Rita. Arch. Gen. Psychiatr. 2009;66:906–914. doi: 10.1001/archgenpsychiatry.2009.77. [DOI] [PMC free article] [PubMed] [Google Scholar]
- Shear MK, McLaughlin KA, Ghesquiere A, Gruber MJ, Sampson NA, Kessler RC. Complicated grief associated with hurricane Katrina. Depress. Anxiety. 2011;28:648–657. doi: 10.1002/da.20865. [DOI] [PMC free article] [PubMed] [Google Scholar]
- Trumbo C, Lueck M, Marlatt H, Peek L. The effect of proximity to Hurricanes Katrina and Rita on subsequent hurricane outlook and optimistic bias. Risk Anal. 2011;31:1907–1918. doi: 10.1111/j.1539-6924.2011.01633.x. [DOI] [PubMed] [Google Scholar]