

Abstract
Many biological activities naturally oscillate. Here, we show that the NAD+/NADH ratios (redox status) fluctuate during mammalian cell cycle, with the S-phase redox status being the least oxidative. The S-phase NAD+/NADH redox status gates histone expression and S-phase progression, and may provide a genome protection mechanism during S-phase DNA replication as implicated in yeast. Accordingly, perturbing the cellular redox inhibits histone expression and leads to S-phase arrest. We propose that the S-phase NAD+/NADH redox status constitutes a redox signaling, which along with the cyclin E/cdk2 signaling regulates histone expression and S-phase progression.
Keywords: OCA-S, NAD+/NADH redox status, histone expression, mammalian metabolic cycle, S-phase progression
Introduction
Many biological functions are oscillatory. For instance, the recently unraveled yeast metabolic cycle (YMC) comprises oscillatory oxidative and reductive metabolic phases.1–4 The YMC is coupled with cell cycle in that a most reductive YMC phase overlaps with the S-phase.2 This is in line with a genome protection mechanism by which oxidative damage to DNA during S-phase replication is minimized.2 Indeed, restricting DNA replication to a most reductive YMC phase ensures genome integrity.5 Therefore, the cell cycle and associated nuclear event(s) are coupled with metabolism, which can feedback to nuclear activities of yeast and possibly higher eukaryotes.
In mammalian cells, the cyclin E/cdk2-mediated signaling orches-trates the S-phase entry and DNA replication and histone expression, and conveys S-phase signal(s) to histone genes through a cyclin E/cdk2 substrate, NPAT, which enhances histone expression by facilitating the assembly of the histone transcription machinery.6–8 Distinct subtype-specific regulatory elements and associated transcription factors and/or co-activators dictate the strength of respective histone gene promoters thus their transcriptional outputs.9,10 The overall histone mRNA expression levels are also regulated at the mRNA maturation/stability level.11
Transcription from the histone 2B (H2B) gene requires octamer-binding factor 1 (Oct-1) and Oct-1 co-activator in S-phase (OCA-S), a multi-subunit complex that contains the NAD(H)-linked classical glycolytic enzymes glyceraldehyde-3-phosphate dehydrogenase (p38/GADPH) and lactate dehydrogenase (p36/LDH) along with other components.12,13 During inter-phase, the essential octamer (ATTTGCAT) element in the H2B gene promoter is constitutively bound by Oct-1 that in turn recruits the OCA-S complex via a direct p38/GAPDH-Oct-1 interaction,13,14 which is S-phase specific hence accounting for S-phase induction of the H2B gene.13
Both p38/GAPDH13 and p36/LDH14 are essential for H2B expression in living cells, and p36/LDH plays a critical role in the hierarchical organization of the OCA-S complex.14 The fact that p38/GAPDH and p36/LDH coexist in OCA-S may suggest an importance beyond a one-protein-multi-function concept. In vitro, optimal H2B transcription requires a properly balanced NAD+/NADH redox status; in vivo, silencing the expression of NAD+ biosynthesis enzymes, or disrupting the redox status with NaN3 or CoCl2, which reduces the (free) cellular NAD+/NADH ratios, inhibits H2B expression. 14 The redox-modulation is most likely directly exerted on the Oct-1-p38/GAPDH interaction that nucleates the H2B promoter occupancy by OCA-S.14 While OCA-S-associated, p36/LDH has an enzyme activity that can feedback to H2B transcription.14
These studies suggest that moonlighting transcription functions of metabolic enzymes in mammalian cells can be modulated by the NAD+/NADH redox status, which reflects the metabolic states of the cell, thus establishing a link between the metabolism and gene switching. As reviewed,15 such links are common in prokaryotes but rarely reported in higher eukaryotes. The S-phase-specificity and a requirement of a proper NAD+/NADH redox status for the H2B transcription raise a question regarding whether the NAD+/NADH redox status (ratios) naturally fluctuates in a cell cycle, with the S-phase redox capable of gating H2B transcription. This, if proven true, may couple the (oscillatory) metabolism with cell cycle and suggest that the redox status could play a broader role(s) apart from modulating the OCA-S function.
Here, we show that the NAD+/NADH ratios (redox status) fluctuate during cell cycle, thus supporting the existence of a mammalian metabolic cycle (MMC). The least oxidative S-phase redox status implies a genome protection strategy similar to the above-implied by the YMC and, given that H2B expression is inhibited by perturbing the redox either way, may represent a narrow redox window that gates OCA-S function. Perturbing the redox also impairs the expression of other core histone genes via a novel coordination mechanism, and leads to S-phase arrest. Hence, the NAD+/NADH redox status is able to feedback to not only the H2B transcription but also the entire histone expression program, and possibly other S-phase (nuclear) events, to impact S-phase progression. This supports multiple roles of the redox status in cell cycle, hence broadening the significance of investigating the redox-modulated H2B transcription.
Results
Oscillatory (free) cellular NAD+/NADH ratios during cell cycle
To explore whether there is a natural fluctuation of the NAD+/NADH redox status (ratios) in a mammalian cell cycle, we used centrifugal elutriation13,16 to separate randomly growing HeLa cells into G1-, S- or G2-phases (Fig. 1A; top); oscillatory H2B mRNA levels were confirmed by RT-PCR (middle panel) and a low (free) NAD+/NADH ratio in S-phase cells and high ratios in G1- and G2-phase cells were observed (bottom panel). As seen in Figure 1B, G1-phase cells re-cultured to progress into the G1/S transition and S-phase (top) showed upregulated H2B expression (middle) and a consistent decline of the free cellular NAD+/NADH ratios (bottom).
Figure 1.
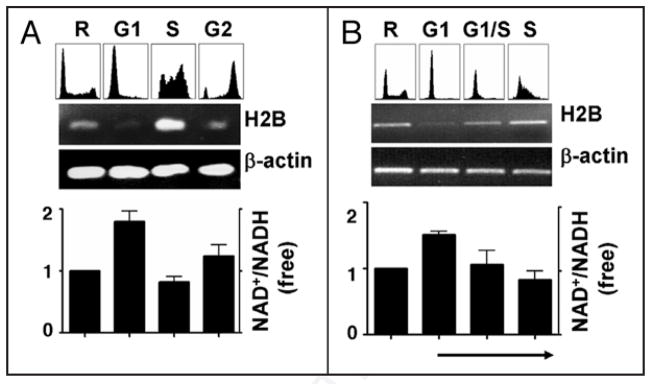
Free cellular NAD+/NADH ratios fluctuate during cell cycle. (A) Random HeLa cells (R), or cells separated at the G1, S- or G2-phases were subject to FACS analyses (top); H2B mRNA levels (middle) and (free) cellular NAD+/NADH ratios (bottom) were measured. (B) The arrow underneath indicates that the re-cultured G1-phase cells progressed into the G1/S transition and S-phase (FACS analyses; top), and free cellular NAD+/NADH ratios (bottom) and H2B mRNA levels (middle) were measured.
The above patterns have been observed regardless of the separation method. Given that the NAD+/NADH redox status is a critical part of the metabolic states, oscillatory NAD+/NADH ratios suggest cyclic metabolic pathways in mammalian cells. Therefore, we may have the first piece of evidence for a mammalian metabolic cycle (MMC) reminiscent of the yeast metabolic cycle (YMC), which exhibits oscillatory oxidative and reductive metabolic phases.1–4 The YMC is coupled with cell cycle in that the most reductive phase overlaps with the S-phase; this may ensure genome integrity by minimizing oxidative damage to DNA during replication.2 Indeed, due to decoupled YMC and cell cycle, certain mutant yeast strains exhibit increased spontaneous mutation rates.5 This suggests a genome protection strategy in normal yeast cells.
Conceivably, DNA during S-phase replication is more susceptible to damage, requiring a relatively reductive S-phase to minimize oxidative damage. Thus, in mammalian cells, the least oxidative S-phase NAD+/NADH redox status (Fig. 1) might provide such a genome protection environment; however, the H2B transcription was shown to require certain levels of NAD+ or a proper NAD+/NADH ratio,14 suggesting an S-phase NAD+/NADH redox status that is at the same time sufficiently oxidative to gate H2B transcription.
H2B expression is restricted to a narrow S-phase NAD+/NADH redox window
In an in vitro model in which pre-existing redox components were removed, exogenous NAD(H) could re-establish a proper NAD+/NADH redox status to support H2B transcription that responded to an NAD+/NADH ratio titration in a biphasic manner; reducing the NAD+/NADH ratios in vivo impaired H2B expression.14 We proposed that a proper NAD+/NADH redox status balance was established by pre-existing redox components in S-phase to gate H2B transcription in vivo, hence perturbing the balance either way may inhibit H2B transcription. Given that exogenous NAD(H) can be taken up by cultured cells,17,18 we examined the effects of NAD(H) feedings.
NADH-treated cells exhibited reduced (free) cellular NAD+/NADH ratios (Fig. 2D) and H2B expression defects (Fig. 2A and C) that manifested prior to adverse effects on the cell cycle profiles (Fig. 2E). These defects were at least in part at the transcriptional level, because the NADH-treated cells exhibited a reduced activity of an H2B-promoter-luciferase reporter gene (Fig. 2F). Increasing the cellular NAD+/NADH ratios by exogenously-fed NAD+ (Fig. 2D) also led to similar phenotypes (Fig. 2B, C, E and F) as those in NADH-treated cells.
Figure 2.

Effects of exogenous NAD(H) on H2B expression in vivo. (A–C) H2B mRNA levels in NAD(H)- treated (4 hrs) cells (A, RT-PCR [NADH]; B, RT-PCR [NAD+]; C, real-time PCR [NADH and NAD+]). (D) Free intracellular NAD+/NADH ratios effected by NAD(H) (0.5 mM, 4 hrs). (E) Cell cycle profiles in control or NAD(H)-treated cells (0.5 mM). Top, BrdU-FACS; bottom, propidium iodide (PI) staining. (F) An H2B-promoter-luciferase reporter assay in control or NAD(H)-treated cells. (G) A chromatin immunoprecipitation (ChIP) assay on control or NAD(H)-treated (0.5 mM, 4 hrs) cells to evaluate the H2B promoter occupancy by p38/GAPDH. Control IgG or anti-Oct-1, anti-TFIIB or anti-p38/GAPDH IgGs were used. The input was either 2% (NAD+) or 1% (NADH) of the starting chromatin.
Despite longer treatments, the reduction of the H2B-promoter-luciferase activity (Fig. 2F) in NAD(H)-treated (overnight) cells was to a lesser degree than that of H2B mRNA levels (Fig. 2C) in HeLa cells treated with NAD(H) for 4 hrs. We reasoned that transfected genes may be less-stringently regulated than the endogenous genes. Alternatively, the redox disruptions might have adversely affected other aspects of the histone expression program such as histone mRNA maturation/stability apart from H2B transcription. The latter is in line with a broader role(s) of the redox status in S-phase, as later-implicated (see below).
The redox-modulated H2B transcription is most likely attributed to the H2B promoter occupancy by OCA-S, which is nucleated by a direct Oct-1-p38/GAPDH interaction.14 Thus, the occupancy of p38/GAPDH on the H2B promoter reflects OCA-S function. Indeed, NAD(H)-treated cells exhibited a reduced H2B promoter occupancy by p38/GAPDH (Fig. 2G). Hence, as in vitro,14 an Oct-1-p38/GAPDH interaction in vivo serves as a redox target that determines H2B transcriptional outputs; that the recruitment of a general transcription factor TFIIB, or Oct-1, to the H2B promoter was not affected (Fig. 2G) suggests that the assembly of the H2B gene basal transcription machinery, or an Oct-1-octamer interaction, is not redox-modulated in vivo.
The above H2B expression defects were detected in randomly-growing HeLa cells, which may be explained by that S-phase cells were conveyed negative signals by non-S-phase cells due to redox perturbations; however, we reasoned that it was very unlikely, because S-phase cells obtained by re-culturing G1-phase cells (Fig. 1B; top) exhibited H2B expression defects by NAD(H) as well (Fig. 3A). Non-S-phase histone expression is extremely low. Thus, the histone mRNA levels scored in randomly-growing cells reflect the S-phase expression levels, and the H2B expression defects in these cells (Fig. 2A–C) were most-likely S-phase autonomous.
Figure 3.

An S-phase NAD+/NADH redox window. (A) H2B mRNA levels (RT-PCR) in S-phase (profile shown in Fig. 1B; top) HeLa cells untreated or treated (0.25 mM, 4 hrs) with NADH (top) or NAD+ (bottom). (B) An S-phase redox window, see text. (C) Top, free intracellular NAD+/NADH ratios in the 30–40% or 80–90% confluence HeLa cells untreated or treated with NAD(H) (4 hrs, 0.5 mM); bottom, cell cycle profiles (BrdU-FACS analyses). (D) H2B mRNA levels (real-time PCR, top; RT-PCR, bottom) in the two cell populations untreated or treated with NAD(H) (4 hrs, 0.5 mM).
Reinforcing the redox window proposition
The earlier clues14 and above results (Fig. 2) led us to propose a narrow redox window that restricts H2B transcription. In vivo, the pre-existing NAD(H) redox components might pre-establish an optimal S-phase redox status (window), thus NAD+ increases the NAD+/NADH ratios above the upper boundary, and NADH reduces the ratios below the lower boundary, of the window to inhibit H2B expression (Fig. 3B). The high G1- and G2-phase NAD+/NADH ratios (Fig. 1) suggest NAD+/NADH redox statuses above the upper boundary of the window, which shuts off H2B transcription; however, the low ratio in the S-phase (Fig. 1) is within the redox window that optimizes H2B transcription (Fig. 3B).
If, in a physiological setting, there is a lower (thus sub-optimal) NAD+/NADH ratio in the S-phase, shifting the ratio upward with exogenous NAD+ may stimulate H2B transcription. In search of such a condition, we realized that the HeLa cells used in all earlier analyses were maintained at 30–40% confluences, and that cell densities could affect the cellular metabolic patterns,19 hence the redox status as well. We measured NAD+/NADH ratios in cells at the 30–40% and 80–90% confluences and revealed normal and lower free NAD+/NADH ratios (Fig. 3C; top) corresponding to, respectively, normal and lower H2B expression levels (Fig. 3D). The cell cycle profiles (BrdU-FACS) of the two cell populations were very similar (Fig. 3C; bottom), suggesting no grossly altered S-phase patterns in cells of naturally varied redox statuses/metabolic patterns owing to differential cellular confluences.
In line with the idea that the lower ratio could be shifted upward to stimulate the H2B transcription, exogenously-fed NAD+ activated H2B expression in cells at an 80–90% confluence (Fig. 3D). In these cells, the S-phase NAD+/NADH ratio may be closer to the lower boundary of the redox window (Fig. 3B), which allows NAD+ certain range to stimulate H2B expression (Fig. 3D); however, the cells at the 30–40% confluence might have an S-phase NAD+/NADH ratio closer to the optimal redox (Fig. 3B), thus NAD+ shifts the ratio above the upper boundary of the optimal window to inhibit H2B transcription (Fig. 3D). Hence, naturally varied redox statuses can allow for differentially redox-modulated H2B expression. This further supports the S-phase redox window proposition and the notion that manipulating the NAD+/NADH ratios within the S-phase window can fine-tune H2B expression (Fig. 3B).
A redox window for H2B transcription in vitro
The redox window proposition can also explain biphasic H2B transcription patterns in Xenopus oocytes or in the B cell nuclear extract-based in vitro transcription system, in which the pre-existing redox components were removed and the assays titrated with exogenous NAD+ or NAD+/NADH ratios.14 These titrations could encompass within and beyond both boundaries of a redox window (Fig. 4A), hence biphasic responses.14 We argued that, in a crude nuclear extract, the pre-existing redox components might pre-establish a proper redox balance supporting H2B transcription, which as in vivo (Fig. 2) may be sensitive to perturbation by either NAD+ or NADH. Indeed, in a crude B cell nuclear extract, whereas NAD(H) up to 1 mM exhibited marginal effects on H2B transcription, 5 mM NAD(H) markedly inhibited the transcription; however, the entire NAD(H) titration failed to affect the transcription from the IgH promoter (Fig. 4B) or histone 4 (H4) and Igκ promoters (Fig. 4C).
Figure 4.

A redox window in vitro or in oocytes. (A) The window (in green) is pre-established by pre-existing redox components, the removal of which allows for the biphasic response of H2B transcription to exogenously-enforced NAD+ or NAD+/NADH ratio titrations.14 (B) In a crude B cell nuclear extract, high exogenous NAD(H) levels disturb the pre-established redox window (see A) to inhibit the H2B transcription. The IgH template, the transcription of which is not redox-modulated,13,14 is an internal control. (C) The H4 gene promoter is not redox-sensitive in the crude B cell nuclear extract, neither is the control (immunoglobulin kappa gene promoter).
The NAD(H)-inhibited H2B transcription in a crude nuclear extract (Fig. 4B) suggests that the high NAD(H) levels disturb a balanced redox pre-established by the pre-existing redox components that gates H2B transcription, in agreement with a redox window in vitro (Fig. 4A) reminiscent of certain aspects of the redox window in vivo (Fig. 3B). Manifesting the inhibitory effects in vivo (Fig. 2C) requires lower NAD(H) levels than that in vitro (Fig. 4B). This suggests a narrower redox window for H2B transcription from natural chromatin templates or, as seen below, a broader role(s) of the redox status on histone expression, in living cells. The redox-insensitive H4 transcription in vitro (Fig. 4C) suggests that, with the exception of the H2B gene, the transcription from other core histone gene promoters is not directly redox-modulated.
A critical role of the NAD+/NADH redox status in coordinated histone expression
The oscillatory NAD+/NADH ratios during cell cycle (Fig. 1) may imply broader roles of the redox status. As a first step, we explored potential effects of a disrupted redox on coordinated histone expression, which dictates that repressing the expression of one histone gene would lead to the expression defects of others.9 For instance, eliminating the OCA-S function by silencing the p38/GAPDH expression led to an H2B expression defect, and a lagged histone 4 (H4) expression defect then manifested after a cell cycle arrest.13 This led to a thought that the coordinated histone expression was regulated through an S-phase feedback mechanism.13
HeLa cells swiftly exhibited H2B expression defects upon redox perturbations14 (also Fig. 2), allowing us to address the above coordination issue in a unique setting. A 2-hr NaN3 (Fig. 5A and B) or 4-hr NAD(H) treatments (Fig. 5C and D) inhibited the expression of not only the H2B but also other (core) histone genes. These concerted expression defects manifested within time-frames without changing the cell cycle profiles14 (and Fig. 2E), thus must be in a more direct fashion than earlier thought13 because of a non-involvement of an S-phase feedback mechanism.
Figure 5.

Coordinated histone expression. (A and B) H2B and other core histone mRNA levels in control or NaN3-treated (1 mM, 2 hrs) HeLa cells as measured by RT-PCR (A) or quantified by real-time PCR (B). (C and D) correspond to (A and B) but show histone mRNA levels in control or NAD(H)-treated HeLa cells (0.5 mM, 4 hrs).
Eliminating an OCA-S function by silencing the p38/GAPDH expression manifested an H2B expression defect prior to that of H4.13 Redox perturbations disrupted a p38/GAPDH-Oct-1 interaction14 (and Fig. 2G), hence also eliminating an OCA-S function; but redox-perturbed cells exhibited simultaneously repressed expression of all the core histone genes (Fig. 5). Therefore, the disrupted redox impedes other S-phase activities apart from eliminating an OCA-S function, agreeing with the notion that the NAD+/NADH redox status plays a broader role(s) in S-phase (also see Discussion).
A critical role of the NAD+/NADH redox status for S-phase progression
A broader role(s) of the NAD+/NADH redox status in the S-phase implies that an S-phase redox window may gate other S-phase events. We therefore examined a role of the redox status on S-phase progression.
HeLa cells exhibited an S-phase arrest after long-term redox perturbations (24 hrs) by NAD(H) (Fig. 6A). Presumably attributed to intracellular metabolism, perturbed NAD+/NADH ratios partially recovered at 24 hrs (data not shown); however, the H2B expression was more-severely repressed than by short-term redox-perturbations (Figs. 6C top panel versus 5D; H2B expression quantifications). Cells may sense the long-term redox perturbations or directly sense the sustained histone expression defects, or both, to activate a cell cycle (intra-S-phase) checkpoint(s) thus S-phase arrest. Indeed, redox perturbations for ≥16 hrs brought about a robust upregulation of p21cip1 (Fig. 6B), which is a cdk inhibitor (reviewed in ref. 20).
Figure 6.

Redox status and S-phase progression. (A) Cell cycle profiles of HeLa cells treated by NAD(H) (0.5 mM, 24 hrs), analyzed by BrdU-FACS assays (top panel) and propidium iodide (PI) staining (bottom panel). (B) The p21cip1 expression levels in the redox-perturbed HeLa cells treated with NAD(H) (0.5 mM) for indicated hrs; p21cip1 levels were examined by immunoblots with p38/GAPDH as a loading control. (C) More complete H2B expression repression in the NAD(H)-treated (0.5 mM, 24 hrs) HeLa cells (bottom, RT-PCR; top, real-time PCR quantification). (D) A model emphasizing that an MMC-based redox signaling along with cyclin E/cdk2 signaling regulates histone expression and S-phase progression.
Discussion
Our studies link metabolism to cell cycle, and establish broader roles of the cellular NAD+/NADH redox status on H2B transcription, coordinated histone expression, intra-S-phase checkpoints and, potentially, genome protection (Fig. 6D).
The NAD+/NADH redox status is defined by free intracellular NAD+/NADH ratios, the change of which has been a common feature14 (also Figs. 2D and 3C) of redox perturbations that modulated H2B expression. It was argued that redox changes exerted primary/direct effects.14 As in NaN3-treated cells,14 the H2B expression defects due to NAD(H) feedings (Fig. 2A–C) manifested without changing the cell cycle profiles (Fig. 2E); inhibitors of NAD(H)-consuming enzymes failed to alter H2B expression patterns (data not shown). This would argue against the possibility that NAD(H)-modulated H2B transcription is secondary to certain signaling pathways down-stream of NAD(H)-consuming enzymes. These results further support the above notion of primary/direct redox effects.
OCA-S occupies the H2B but not other histone gene promoters;13 non-H2B histone genes unlikely employ other redox-sensitive transcriptional components (Fig. 4C). Thus, the concerted histone expression defects upon redox perturbations (Fig. 5) were likely due to redox-sensitive machineries not directly regulating transcription of other histone genes. Candidate machineries include those involved in regulating histone mRNA maturation/stability, which may directly feedback to the coordinated histone expression, or machineries involved in certain other S-phase event(s), which may indirectly feedback to the coordinated histone expression.
p21cip1 is able to inhibit the cyclinE/cdk2 signaling. This may feedback to impede an NPAT function that plays a critical role in the assembly of the histone transcription machinery, which globally regulates histone expression.6–8 Thus, the long-term redox perturbations, and an impeded NPAT function due to the inhibited cyclinE/cdk2 signaling, explain a more severe H2B expression defect (Fig. 6C).
The cyclin E/cdk2 signaling regulates both the S-phase entry and S-phase progression,8 hence inhibiting this signaling should inhibit both events; however, upon the long-term redox perturbations, an upregulated p21cip1 expression (Fig. 6B) coincided with a defect in the S-phase progression but not S-phase entry (Fig. 6A). Researchers conventionally use certain pathological agents such as genotoxic UV lights or ionizing irradiation that damage DNA and inhibit DNA replication to induce S-phase arrest. These agents typically block both the S-phase entry, which by nature inhibits the initiation of DNA replication, and the S-phase progression, hence cell cycle profiles with reduced S-phase percentages (reviewed in ref. 21). In our studies, however, the cell cycle profiles were somewhat unique because S-phase percentages increased in long-term redox-perturbed cells (Fig. 6A). We reason that a disrupted redox may exert effects in an intra-S-phase fashion without affecting the S-phase entry. In this scenario, cells would fail to progress through the S-phase due to long-term redox perturbations and/or histone expression defects; however, an intact S-phase entry, which is known to be concurrent with initiation of DNA replication, allows for BrdU incorporation thus the accumulation of early S-phase cells corresponding to increased percentages of BrdU-positive cells (Fig. 6A).
How the oscillatory NAD+/NADH redox status hence the optimal S-phase redox window is established remains to be investigated. We propose that an S-phase redox window may constitute a redox signaling that gates the H2B transcription, coordinated histone expression and genome protection, and that an integration of an NPAT-mediated cyclin E/cdk2 signaling with an MMC-based redox signaling is essential for histone expression and orderly S-phase progression (Fig. 6D).
Materials and Methods
Cell culture, antibodies and published materials and methods
HeLa cells were maintained in DMEM medium supplemented with antibiotics, L-glutamine and 10% fetal bovine serum, in a 37°C/5% CO2 incubator. Mouse anti-BrdU monoclonal antibodies (MAb) and anti-p21cip1 polyclonal antibodies were purchased from BD Biosciences. Antibodies against p38/GAPDH were raised with in-house rabbits; and anti-Oct-1 and anti-TFIIB antibodies were purchased from Biovision and Santa Cruz Biotechnologies, respectively. The centrifugal elutriation was carried out as earlier described,13,16 and ChIP (chromatin immunoprecipitation) assays were performed as described13 using H2B promoter-specific primers.7 J.-Y. Zhao provided the H2B- and H4-promoter-luciferase reporter constructs described in ref. 7. In vitro transcription procedures were described in ref. 22. Free intracellular NAD+/NADH ratios (redox status) were calculated based on relative coenzyme levels,23,24 using an established protocol.14
H2B promoter-luciferase assays
To assess the NAD(H) effects on H2B transcription in vivo, HeLa cells were transfected with an H2B promoter-luciferase (firefly) reporter and then treated with NAD(H) for 16 hrs before analyzing the luciferase activities. As an internal reference, co-transfected was a Renilla luciferase construct under the control of the SV40 promoter.
RT-PCR and real-time PCR
RT-PCR was used to measure histone mRNA levels in HeLa cells.13,14 The RT-PCR primers are: GCC GAC AGG ATG CAG AAG GAG ATC A and AAG CAT TTG CGG TGG ACG ATG GA (β-actin); CAG TGC TAT GCC AGA GCC AGC GAA and CTG TTT ACT TAG CGC TGG TGT ACT TGG TGA (H2B); ACC ATG TCT GGA CGT GGC AA and ATC TCG GCA GTT AGG TAC TC (H2A); ATG GCT CGC ACT AAG CAA ACT and CGC ACA GGT TAG TGT CCT CAA AT (H3); TGA GAC GCC TCT TGC TCG TCG TCA and GTA GAG AAG GAC GCT CAA CCA CCG AAA (H4). Semi-quantitative evaluations of the histone expression levels by RT-PCR were further supported by quantifications using real-time PCR (Sybr Green Core Reagents, ABI) in most cases; both assays used β-actin mRNA levels as internal references.14
BrdU-FACS or FACS analyses
Cells grown in 6-well plates were treated with BrdU (10 μM) for 30–45 min, fixed with 70% cold ethanol, treated with 3 N HCl, washed and incubated with anti-BrdU MAb for 30 min. After washing, cells were incubated with Alexa Fluor® 488 goat anti-mouse IgG (Invitrogen) for 30 min. These cells, or ethanol-fixed cells (for direct FACS assays), were treated with propidium iodide and RNase A for 30 min before FACS analyses.
Acknowledgments
We thank J.-S. Hee for critical reading of the manuscript. This work was supported by Agency for Science, Technology and Research (A*STAR), Singapore. Y.L. is an adjunct faculty in the Department of Biochemistry, National University of Singapore.
Abbreviations
- YMC
yeast metabolic cycle
- cdk
cyclin dependent kinase
- NPAT
nuclear protein, ataxia-telangiectasia locus
- Oct-1
octamer-binding factor 1
- OCA-S
Oct-1 co-activator in S-phase
- GAPDH
glyceraldehyde-3-phosphate dehydrogenase
- LDH
lactate dehydrogenase
- MMC
mammalian metabolic cycle
- ChIP
chromatin immunoprecipitation assay
- RT
reverse transcription
- FACS
fluorescent-activated cell sorting
- BrdU
bromodeoxyuridine
References
- 1.Klevecz RR, Bolen J, Forrest G, Murray DB. A genomewide oscillation in transcription gates DNA replication and cell cycle. Proc Natl Acad Sci USA. 2004;101:1200–5. doi: 10.1073/pnas.0306490101. [DOI] [PMC free article] [PubMed] [Google Scholar]
- 2.Tu BP, Kudlicki A, Rowicka M, McKnight SL. Logic of the yeast metabolic cycle: temporal compartmentalization of cellular processes. Science. 2005;310:1152–8. doi: 10.1126/science.1120499. [DOI] [PubMed] [Google Scholar]
- 3.Tu BP, McKnight SL. Metabolic cycles as an underlying basis of biological oscillations. Nat Rev Mol Cell Biol. 2006;9:696–701. doi: 10.1038/nrm1980. [DOI] [PubMed] [Google Scholar]
- 4.Xu Z, Tsurugi K. A potential mechanism of energy-metabolism oscillation in an aerobic chemostat culture of the yeast Saccharomyces cerevisiae. FEBS J. 2006;273:1696–709. doi: 10.1111/j.1742-4658.2006.05201.x. [DOI] [PubMed] [Google Scholar]
- 5.Chen Z, Odstrcil EA, Tu B, McKnight SL. Restriction of DNA replication to the reductive phase of the metabolic cycle protects genome integrity. Science. 2007;316:1916–9. doi: 10.1126/science.1140958. [DOI] [PubMed] [Google Scholar]
- 6.Ma T, van Tine BA, Wei Y, Garrett MD, Nelson D, Adams PD, et al. Cell cycle-regulated phosphorylation of p220(NPAT) by cyclin E/Cdk2 in Cajal bodies promotes histone gene transcription. Genes Dev. 2000;14:2298–313. doi: 10.1101/gad.829500. [DOI] [PMC free article] [PubMed] [Google Scholar]
- 7.Zhao J, Kennedy BK, Lawrence BD, Barbie DA, Matera AG, Fletcher JA, et al. NPAT links cyclin E-Cdk2 to the regulation of replication-dependent histone gene transcription. Genes Dev. 2000;14:2283–97. [PMC free article] [PubMed] [Google Scholar]
- 8.Ewen ME. Where the cell cycle and histones meet. Genes Dev. 2000;14:2265–70. doi: 10.1101/gad.842100. [DOI] [PubMed] [Google Scholar]
- 9.Osley MA. The regulation of histone synthesis in the cell cycle. Annu Rev Biochem. 1991;60:827–61. doi: 10.1146/annurev.bi.60.070191.004143. [DOI] [PubMed] [Google Scholar]
- 10.Luo Y, Roeder RG. B Cell-specific coactivator OCA-B: biochemical aspects, role in B cell development and beyond. Cold Spring Harb Symp Quant Biol. 1999;63:119–31. doi: 10.1101/sqb.1999.64.119. [DOI] [PubMed] [Google Scholar]
- 11.Marzluff WF, Duronio RJ. Histone mRNA expression: multiple levels of cell cycle regulation and important developmental consequences. Curr Opin Cell Biol. 2002;14:692–9. doi: 10.1016/s0955-0674(02)00387-3. [DOI] [PubMed] [Google Scholar]
- 12.McKnight SL. Gene switching by metabolic enzymes—how did you get on the invitation list? Cell. 2003;114:150–2. doi: 10.1016/s0092-8674(03)00563-4. [DOI] [PubMed] [Google Scholar]
- 13.Zheng L, Roeder RG, Luo Y. S phase activation of the histone H2B promoter by OCA-S, a coactivator complex that contains GAPDH as a key component. Cell. 2003;114:255–66. doi: 10.1016/s0092-8674(03)00552-x. [DOI] [PubMed] [Google Scholar]
- 14.Dai R-P, Yu F-X, Goh S-R, Chng H-W, Tan Y-L, Fu J-L, et al. Histone 2B (H2B) expression is confined to a proper NAD+/NADH redox status. J Biol Chem. 2008;283:26894–901. doi: 10.1074/jbc.M804307200. [DOI] [PubMed] [Google Scholar]
- 15.Shi Y, Shi Y. Metabolic enzymes and coenzymes in transcription—a direct link between metabolism and transcription? Trends Genet. 2004;20:445–52. doi: 10.1016/j.tig.2004.07.004. [DOI] [PubMed] [Google Scholar]
- 16.Mendez J, Stillman B. Chromatin association of human origin recognition complex, cdc6, and minichromosome maintenance proteins during the cell cycle: assembly of prereplication complexes in late mitosis. Mol Cell Biol. 2000;20:8602–12. doi: 10.1128/mcb.20.22.8602-8612.2000. [DOI] [PMC free article] [PubMed] [Google Scholar]
- 17.Bruzzone S, Guida L, Zocchi E, Franco L, De Flora A. Connexin 43 hemi channels mediate Ca2+-regulated transmembrane NAD+ fluxes in intact cells. FASEB J. 2001;15:10–2. doi: 10.1096/fj.00-0566fje. [DOI] [PubMed] [Google Scholar]
- 18.Loetscher P, Alvarez-Gonzalez R, Althaus FR. Poly(ADP-ribose) may signal changing metabolic conditions to the chromatin of mammalian cells. Proc Natl Acad Sci USA. 1987;4:1286–9. doi: 10.1073/pnas.84.5.1286. [DOI] [PMC free article] [PubMed] [Google Scholar]
- 19.Aldridge J, Pye EK. Cell density dependence of oscillatory metabolism. Nature. 1976;259:670–1. doi: 10.1038/259670a0. [DOI] [PubMed] [Google Scholar]
- 20.Pei X, Xiong Y. Biochemical and cellular mechanisms of mammalian CDK inhibitors: a few unresolved issues. Oncogene. 2005;18:2787–95. doi: 10.1038/sj.onc.1208611. [DOI] [PubMed] [Google Scholar]
- 21.Su C, Gao G, Schneider S, Helt C, Weiss C, O’Reilly MA, et al. DNA damage induces downregulation of histone gene expression through the G1 checkpoint pathway. EMBO J. 2004;23:1133–43. doi: 10.1038/sj.emboj.7600120. [DOI] [PMC free article] [PubMed] [Google Scholar]
- 22.Luo Y, Roeder RG. Cloning, functional characterization and mechanism of action of the B-cell-specific transcriptional coactivator OCA-B. Mol Cell Biol. 1995;15:4115–24. doi: 10.1128/mcb.15.8.4115. [DOI] [PMC free article] [PubMed] [Google Scholar]
- 23.Veech RL, Eggleston LV, Krebs HA. The redox state of free nicotinamide-adenine dinucleotide phosphate in the cytoplasm of rat liver. Biochem J. 1969;115:609–19. doi: 10.1042/bj1150609a. [DOI] [PMC free article] [PubMed] [Google Scholar]
- 24.Fulco M, Schilt RL, Iezzi S, King MT, Zhao P, Kashiwaya Y, et al. Sir2 regulates skeletal muscle differentiation as a potential sensor of the redox state. Mol Cell. 2003;12:51–62. doi: 10.1016/s1097-2765(03)00226-0. [DOI] [PubMed] [Google Scholar]