

Abstract
Purpose
The maternal microvasculature of the primate placenta is organized into 10-20 perfusion domains that are functionally optimized to facilitate nutrient exchange to support fetal growth. This study describes a dynamic contrast-enhanced magnetic resonance imaging (DCE-MRI) method for identifying vascular domains, and quantifying maternal blood flow in them.
Methods
A rhesus macaque on the 133rd day of pregnancy (G133, term=165 days) underwent Doppler ultrasound (US) procedures, DCE-MRI, and Cesarean-section delivery. Serial T1-weighted images acquired throughout intravenous injection of a contrast reagent (CR) bolus were analyzed to obtain CR arrival time maps of the placenta.
Results
Watershed segmentation of the arrival time map identified 16 perfusion domains. The number and location of these domains corresponded to anatomical cotyledonary units observed following delivery. Analysis of the CR wave front through each perfusion domain enabled determination of volumetric flow, which ranged from 9.03 to 44.9 mL/sec (25.2 ± 10.3 mL/sec). These estimates are supported by Doppler US results.
Conclusions
The DCE-MRI analysis described here provides quantitative estimates of the number of maternal perfusion domains in a primate placenta, and estimates flow within each domain. Anticipated extensions of this technique are to the study placental function in nonhuman primate models of obstetric complications.
Keywords: MRI, Obstetrics, Fetal growth, Perfusion, Blood flow
Introduction
The placenta is critical for normal fetal growth and development. Abnormal placental development has been linked with virtually every adverse obstetric outcome including abnormalities in fetal growth, preeclampsia, preterm labor and stillbirth (1-4). The vascular organization of the primate placenta is remarkable given that two separate vascular networks must develop in tandem: the maternal compartment as the source of nutrients and the fetal compartment structured in a complex arborized pattern of villi intended to maximize surface area available for the exchange of nutrients with the maternal vasculature. Although the mechanisms regulating normal placental growth and development are incompletely understood, the central role of adequate blood flow as a key determinant is clear. Unfortunately, our understanding of the mechanisms involved in normal placental growth and function are limited, in part by the lack of imaging modalities that facilitate the study of both normal and abnormal placentas.
Dynamic contrast enhanced magnetic resonance imaging (DCE MRI) is a non-invasive imaging strategy that can potentially enable spatial and quantitative characterization of the maternal perfusion of the placental intervillous space in normal or pathologic conditions such as placental insufficiency. Previous animal studies have utilized this strategy by acquiring T1-weighted images of the placenta prior to, during, and following the administration of a gadolinium-based contrast reagent (CR) (5,6). In rodents, such studies have enabled the quantitative study of placental perfusion and permeability of the maternal/fetal barrier to CR including a recent study demonstrating different perfusion territories within the mouse placenta (7). One important anatomical distinction between the primate placenta and those of small animals studied by DCE-MRI relates to the hemochorial organization of the maternal vasculature (8-10). In primate species, the placenta is composed of a collection of units termed cotyledons, which in the rhesus macaque are on the order of 5 cm3 in size. Cotyledons are demarcated from each other on the maternal surface of the placenta by grooves or septa (11) and are organized such that maternal blood is supplied to the placenta through uterine arteries, which branch into spiral arteries that perfuse the intervillous space of each cotyledon. Nutrient exchange thus takes place between fetal blood within chorionic vessels and intervillous maternal blood that bathes the chorion. The number of cotyledons vary and range in humans from approximately 20-30 and rhesus macaques from approximately 10-12 (11,12). The hemochorial placenta of the rhesus macaque is similar to human, but is distinguished by two lobes (13,14) where humans most commonly have a single lobe. In the rhesus macaque, the umbilical cord attaches centrally to the primary lobe and clusters of bridging vessels supply a secondary lobe; the two lobes function as one unit (14). In contrast, the cotyledonary structure in primates is absent in mice, and nutrient exchange between maternal and fetal blood takes place between neighboring blood vessels rather than being mediated by an intervillous space. Development of a non-invasive method for characterizing maternal placental perfusion at the unit of nutrient transport, the cotyledon, is thus an important step toward linking placental perfusion with placental histopathology and in vivo nutrient transport in humans.
Thus far, no imaging modality has been developed that provides the requisite image contrast to delineate the individual vascular units of the primate placenta. In this work we sought to develop a DCE MRI-based method for quantitatively characterizing maternal perfusion of the placental blood flow from maternal spiral arteries into the placenta, and to construct 3D maps of the placental structure in a way that is consistent with the placental histopathologic structure. Gadolinium-based CR is not typically administered to pregnant women due to hypothetical potential risks to the fetus (15). Therefore, here we take advantage of the similarity in anatomical organization and development of the placenta between nonhuman primates and humans, and illustrate our method with a gestational day (G) 133 rhesus monkey.
Methods
The Oregon National Primate Research Center (ONPRC) institutional animal use and care committee approved all procedures. Imaging procedures (ultrasound and MRI, detailed below) were performed on gestational day (G) 133 on one rhesus macaque (Macaca mulatta). The typical gestation length for rhesus monkeys is 165 days. Immediately following G133 imaging procedures, the monkey was transported to the surgical facility and the fetus was delivered by Cesarean section, and the placenta was harvested for analyses described below.
Prior to the imaging procedures, sedation was induced by intramuscular administration of 10 mg/kg ketamine. The animal was then intubated, and sedation was maintained for US and MRI with 1.5% isoflurane. Image-directed pulsed and color Doppler equipment (GE Voluson 730 Expert; Kretztechnik, Zipf, Austria) with a 5- to 9-MHz sector probe was used for ultrasonographic data collection. The lowest high-pass filter level was used (100 Hz), and an angle of 15° or less between the vessel and Doppler beam was deemed acceptable. Blood flow velocity waveforms were obtained from the proximal portion of the uterine artery as previously described (16,17). Measurements of the waveforms were done using the software supplied on the ultrasound machine, and the following parameters were obtained: pulsatility index (PI), velocity time integral, and heart rate. The diameter of the uterine artery was measured using power angiography as previously described (16,17). The cross-sectional area (CSA) of the vessel was calculated as CSA = π (diameter/2)2. After the conclusion of US imaging, the monkey was transported to the MRI facility (5 minute transport time) on a cart equipped with a portable anesthesia delivery system. Within the MRI facility, a catheter was placed in the saphenous vein for the delivery of the gadolinium-based contrast reagent (CR) during MRI data acquisition procedures.
A Siemens (Erlangen, Germany) whole-body 3T Tim Trio MRI system used, with a CP transmit, 15-channel receive RF coil (QED, Cleveland, OH) for MRI measurements. Following acquisition of a series of “scout” images to locate the placenta, a T1-weighted 2D gradient echo image series was acquired in the axial plane, with 3 mm-thick slices (20% gap between slices), and 1 mm × 1 mm in-plane resolution. Other acquisition settings for this survey measurement was TR = 250 ms, TE = 2.5 ms, and flip angle = 70° (total acquisition time was 4 min, 28 s). Subsequently, a series of T1-weighed 3D fast spoiled gradient-recalled echo images were acquired for DCE MRI. Image acquisition parameters were TR=86 ms, TE=1.5 ms, flip angle=8°, and the image resolution was (2 mm)3. The number of data points acquired in the readout, phase-encode, and slice-select dimension were 128, 64, and 56, respectively, resulting in a 5.6 sec interval between acquisition of images. Approximately 25 images were acquired before 0.1 mmol/kg of CR (Prohance, Bracco Diagnostics Inc, Princeton, NJ) was administered intravenously at a rate of 30 mL/min using a syringe pump, and 35 images were acquired subsequent to CR administration. We did not find it necessary to gate the acquisition to maternal respiration, or otherwise perform motion correction, with this experimental preparation. Throughout the MRI procedures, pulse rate, arterial blood oxygen saturation, end-tidal CO2 levels, and respiration rate were monitored. No deviation from the normal range in these physiological parameters was observed.
DCE MRI analysis
Model estimates of the arrival time of the contrast bolus to each placental voxel were determined by the following procedure: (1) Measured signal intensity from the DCE-MRI data was converted to relative enhancement, and contrast agent concentration within the placenta was estimated using the nonlinear approximation given by Eqs. 6-7 of Schabel, 2008 (18). The tissue relaxation time constant (T1,0) was fixed at an assumed value of 1500 ms, and field-strength appropriate literature values were used for gadoteridol relaxivity (19). The value of T1,0 was chosen to be 35% larger than the value of 1100 ms measured in human placenta at a magnetic field strength 1.5 T (20), following differences previously reported for the blood T1 between 1.5 T and 3.0 T (21). The resulting contrast concentration curves for each voxel within the placenta were fitted to the GCTT model, using a population-averaged AIF and the methods described in Schabel, 2012 (22). Maps of estimated contrast bolus arrival time (τ) were generated from the delay time parameter for these model fits. The GCTT model was utilized for this analysis due to its ability to account for heterogeneity in intravoxel contrast reagent transit times. Correspondences between GCTT and other DCE-MRI analyses such as Tofts-Kety, the 2-compartment exchange, and the adiabatic tissue homogeneity models, have been previously characterized in detail (22). For this application, it is expected that other analysis procedures could also be used to calculate arrival time maps, provided a suitable arterial input function is used. However, early attempts to use extended Tofts-Kety models resulted in significantly poorer fit quality.
Segmentation of arrival time maps
In order to determine τ values for all voxels overlapping placental tissue, image voxels were classified as either overlapping the placenta or not. This was accomplished by constructing an image of the intensity ratio prior to, and following, CR-based image enhancement from the 3D T1-weighted images. Placental voxels were identified by first applying a threshold operation to the image, followed by manual segmentation using ITK-SNAP software (23).
The watershed algorithm (24) was implemented to assign voxels to individual perfusion domains according to the closest arrival time map local minimum, and to identify the locations of the local minima. In order to suppress the confounding effects of local minima that arise due to noise in the τ estimates, the arrival time map was smoothed prior to watershed segmentation through the application of a median filter. The median filter window size, 6 mm in radius, was chosen to be matched to the typical size for cotyledons, as this was considered optimal for maximizing noise reduction, but minimizing the effect of blurring adjacent perfusion domains. Subsequent to segmentation of smoothed arrival time maps, a threshold operation was applied, in which perfusion domains greater than 2.5 mL in volume, a threshold volume chosen based on the size of typical cotyledons (unpublished observations), were retained for further analysis.
Determination of volumetric flow for each perfusion unit
For each of the perfusion domains, the arrival time data were used to estimate the volumetric flow; i.e., the volume of maternal blood entering a perfusion domain per unit time. In the calculations described here, the assumption is made that mixing of blood at the wave front due to turbulent flow is negligible. The procedure for this part of the analysis is schematized in Figure 1. The CR wave front at some time ti, following the injection of CR into the maternal vasculature, is the isosurface of the τ parameter map at the value τ = ti, and is represented as a red contour curve in the cross section through a hypothetical perfusion domain shown in Figure 1. The volumetric flow, V, equals the product of the linear rate, L, of advancement of the CR wave front, and the wave front surface area, S, weighted by the volume fraction of the intervillous space, α, which herein is taken to be 0.5 based on previous stereological estimates (25). As can be seen in Figure 1, the surface area increases as the CR wave front propagates away from the spiral artery source. Due to the time dependence of S, L must also be time dependent to satisfy the relationship with time-independent volumetric flow
| (1) |
In turn, an expression for the linear rate of propagation of the CR wave front, L(t), is
| (2) |
in which r(t) is the distance between a point on the CR wave front and the location of maternal blood entry into the placenta through a spiral artery, as illustrated in Figure 1.
Figure 1.
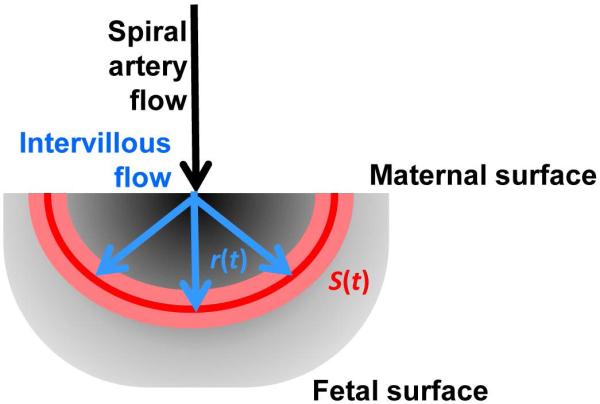
Illustration of the procedure to estimate volumetric flow for a perfusion domain. The grayscale underlay represents a 2D cross section of a perfusion domain, in which darker shades indicate regions proximal to the spiral artery source of maternal blood, and lighter shades are at a larger distance from the spiral artery. For time points of integer seconds, ti, voxels characterized by arrival times τ in which ti−0.5 s < τ ≤ ti +0.5 s are identified. These are represented by the pink zone, for an intermediate value of ti. The value r(t) in Eqs. 2 and 3 is the average distance from the spiral artery source estimated for this set of voxels, and the linear flow rate, L(t) is derived from the ratio r(t)/t. The intersection of the surface defined by these voxels with the 2D plane is illustrated as the red curve. The surface area of the surface in 3D is S(t) in Eqs. 1 and 3, which enables conversion of the linear flow rate to volumetric flow.
By combining Eqs. 1 and 2 and integrating with respect to time, an expression is obtained that relates volumetric flow to the CR wave front displacement distance, r(t), and surface area, S(t)
| (3) |
which are quantities that can be directly measured from the MRI data. Herein, r(t) is evaluated at a given ti by determining the average distance between the spiral artery entry point and the centers of voxels in which τ = ti. The spiral artery entry point is defined as the arrival time local minimum for the perfusion domain of interest identified by the watershed algorithm. Values of r(t) were determined by averaging distances between the spiral artery source voxel, and all voxels characterized by τ values greater than τi − 0.5 seconds and τ values less than or equal to τi + 0.5 seconds. Secondly, due to the curved shape of some cotyledons, r(t) is the mean geodesic distance, rather than the mean Euclidean distance, as the geodesic distance is the shortest distance connecting two points along a path that remains within the cotyledon. Geodesic distance is calculated using Dijkstra’s algorithm (26). The CR wave front surface area at a given time, S(t), was determined by calculating the surface area of the convex hull of the set of voxels that have arrival times within the range τi − 0.5 and τi + 0.5 seconds. This operation utilized the Matlab function “DelaunayTri,” which performs a Delaunay triangulation to define the set of points on the wavefront surface, and the function “convexHull” to determine the smallest surface area that encloses that set of points. Lastly, the Matlab function “trapz” was used to evaluate the definite integral in Eq. 3.
Tissue Collection
After the conclusion of the MRI procedures, the animal was transported to the ONPRC surgical facility under 1.5% isoflurane for Caesarean section delivery. At the time of delivery, anatomical location of the primary and secondary lobes was documented for later correspondence to 3D rendered MR perfusion images. Immediately following delivery, the maternal side of the placenta was positioned to enable visual inspection of the two placental lobes and identification of the individual cotyledons, which were then photographed and labeled.
Results
An axial view of the rhesus placenta
The standard MRI approach for characterizing the placenta in a clinical obstetric setting is to acquire images determined by endogenous (e.g. T1, T2) image contrast (27). Figure 2 shows axial and coronal views of a T1-weighted image. The two approximately 1 cm-thick placental lobes are easily discriminated from adjacent amniotic fluid. However, endogenous MRI contrast is of limited utility in discerning between different functional components within the primate placenta. The cross sections shown in Figure 2 overlap several perfusion domains, however, no evidence of the boundaries between these structures is observable.
Figure 2.

Axial (a,c) and coronal (b,d) views of a 3D T1-weighted image of a G115 rhesus placenta. The primary and secondary placental lobes are outlined in red and yellow, respectively in panels c and d, and the fetus is observable between them. In (a and c), front (ventral) is to the left and back (dorsal) is to the right, and the asterisk is overlaid on the spinal cord. Scale bar = 1 cm.
Delineation of perfusion domains
Figure 3 illustrates how DCE MRI can be used to reveal the multiple perfusion domains of the maternal placental vasculature. Figure 3 panels a-d are images obtained from the same axial position of four multi-slice, T1-weighted images included within an image series acquired throughout intravenous injection of CR into the maternal vasculature. As evident in Figure 3a, only image voxels that are proximal to spiral artery sources of maternal blood (yellow arrowheads, Figures 3a and 3d) exhibit T1-weighted signal enhancement within the first five seconds following CR administration. Over the following 40 seconds, T1-weighted signal enhancement progressively spreads from the sites of spiral arteries throughout the placenta, due to perfusion of the maternal blood.
Figure 3.

Image intensity changes following CR injection into maternal blood of the monkey at G133. Axial planes of 3D T1-weighted images are shown in (a-d) 5.6, 17, 39, and 152 seconds after CR injection, respectively. The earliest regions of placental tissue to show signal enhancement (yellow arrowheads in (a)) indicate the location of spiral arteries, which supply maternal blood to the intervillous spaces. The regions of signal enhancement progressively grow larger (b-d), and fuse with each other (d) as CR fills the intervillous spaces. In (e), relative signal intensity is plotted for two voxels indicated by the blue and red markers in (a). The blue marker, which is relatively proximal to a spiral artery, shows earlier enhancement compared to the voxel indicated by the red marker in (a). Arrival times determined for the two voxels are 4.2 (blue marker) and 55 seconds (red marker). Intensity variation among cotyledons, particularly evident in (d) (note the left two cotyledons are brighter than the right two), arises from inhomogeneity in the 15-channel rf-receiver, which is most sensitive nearest the coil elements. Green data values in (e) are average signal intensities within a 120 voxel ROI that overlaps the fetus (green circle in (a)) throughout CR administration. The lack of obvious enhancement within the fetus indicates that CR exchange between the maternal and fetal vasculature is slow on the time scale of the DCE experiment.
Determination of τ for two voxels, located at the positions of the blue and red markers in Figure 3a, is illustrated in Figure 3e. The blue data values shown in Figure 3e correspond to voxel intensities as a function of time for a voxel located near a spiral artery (the blue circle in Figure 3a), and is characterized by an early enhancement (0-30 seconds) followed by a maximal enhancement and subsequent reduction in signal intensity (30 seconds onward). In comparison, the red data values show the time course for a voxel more distal to a spiral artery (the red circle in Figure 3a), and the DCE MRI response following CR administration is a delayed enhancement (50-250 seconds) and dispersed maxima and subsequent reduction in intensity (250 seconds onward). For comparison, green data values in Figure 3a are average voxel intensities for a region of interest located within the fetus (120 voxels, enclosed in the circle, Figure 3a). The absence of signal enhancement over this period indicates that insufficient CR crosses the maternal/fetal placental barrier over the relevant time period to detect CR exchange between maternal and fetal vasculature. Figure 3e solid curves represent the results of nonlinear regression of expressions derived from the GCTT model fits (22) to the data. The values of τ estimated for voxels at the blue and red marker positions in Figure 3a are 4.2 and 55 seconds, respectively.
Figure 4a shows a parametric map of τ values for an axial slice of the placenta. Voxels adjacent to spiral arteries are characterized by the lowest τ values (black voxels in Figure 4a), whereas voxels at or near the boundaries between cotyledons exhibit larger τ values (yellow voxels in Figure 4a). In Figure 4b, the results of segmenting the arrival time map shown in Figure 4a are overlaid on a τ parameter map (each perfusion domain is assigned a different color). The results of the procedure are also shown as 3D surfaces in Figure 4c, wherein the dashed line indicates the location of the axial slice shown in Figures 4a and 4b.
Figure 4.

Use of τ maps to segment cotyledons of the G133 placenta. (a) A parameter map is shown of τ values for placental voxels in the axial plane shown in Figures 2 and 3, according to the color scale (a, left). (b) Results of applying the watershed algorithm, modified as described in the text, to the τ map. Voxels are assigned to individual cotyledons according to the color scheme in (c). In (c), 3D surfaces of the boundaries of the 16 cotyledons identified for this placenta are shown from the approximately dorsal view (as in Figure 2d). The surface of each cotyledon encodes its volumetric flow rate, according to the color scale (c, left). The placental outline is displayed as a transparent surface.
To assess the validity of the perfusion domains identified by watershed segmentation of the arrival time maps, the pattern of perfusion domains was compared to the pattern of placental cotyledons. Performing a cesarean section immediately following the G133 MRI procedure and noting the anatomical location of the 2 placental lobes achieved this objective. Following delivery, the decidua was carefully dissected away from the maternal side of the placenta to enable identification of the individual cotyledons, which were then photographed and labeled. The histologic numbered cotelydons were then compared to the MR segmentation cotelydons demonstrating MR segmentation appropriately correlates with gross placental structure. Figure 5a shows the maternal face of the secondary (left) and primary (right) placental lobes. Individual placental cotyledons are identifiable as bulges within each lobe, and these are outlined and labeled in Figure 5a. The cotyledons identified within the two lobes are shown individually in Figure 5b, with each lobe oriented to present the maternal surface. As revealed by overlaying the cotyledon boundaries on the segmentation results (dashed ellipses, Figure 5b and c), a close, but not perfect, correspondence between the cotyledons and the perfusion domains is observable. This is in spite of the minor deformations that took place throughout delivery and rearrangement of the tissue from the curved conformation apparent in Figure 4c to the flattened lobes displayed in Figure 5a. In the secondary lobe, there is a one-to-one correspondence between cotyledons and perfusion domains for all except cotyledons 5b and 8b. Subsequent visual inspection of the series of T1-weighted images and arrival time maps show that CR does perfuse into the placenta at the expected locations (Figure 5d), but that perfusion domains of greater than 2.5 mL in volume were not observed in these locations. Further reduction in the threshold volume enabled the segmentation procedure to identify perfusion domains corresponding to cotyledons 5b and 8b, but this was at the cost of additional “false positive” perfusion domains being identified, that are not associated with cotyledons. In the primary lobe, a one-to-one correspondence was observed between cotyledons and perfusion domains for all except cotyledons 1a and 2a. In these cases, multiple perfusion domains (1a’ and 1a’’ for cotyledon 1a; and 2a’, 2a’’, and 2a’’’ for cotyledon 2a) were identified. Inspection of the T1-weighted images (Figure 5e) confirms the presence of multiple sources of CR within the vicinities of cotyledons 1a and 2a, as evident in the pattern of several patches of placental tissue with enhanced signal intensity at an early time point in the DCE image.
Figure 5.

Comparison of segmentation results obtained by DCE-MRI in situ to direct visualization of the maternal surface of the G133 placenta. The maternal faces of primary (right) and secondary (left) placental lobes are shown in (a). The symbol × indicates the location of the umbilical insertion into the fetal face of the primary lobe (not shown). Ellipses mark cotyledons identified by visual inspection and palpation immediately after Cesarean section delivery, but prior to access to DCE-MRI results. In (b) and (c), separate lateral views of the secondary and primary lobes are displayed, respectively. As for Figure 4c, individual cotyledons are color-coded according to volumetric flow rates, and secondary and primary lobe outlines are displayed as transparent surfaces. The pattern of cotyledons identified in (a) is overlaid for each lobe in (b) and (c) (dashed ellipses). Perfect alignment is not expected, because the two lobes are lying flat on a support surface in (a), but possess curvature in vivo, and this curvature is present in (b) and (c). In (d), the intersection of the axial plane indicated by a blue line in (b) with the secondary lobe is shown for a T1-weighted image acquired 39 seconds after CR administration (d, left) and the τ map (d, right). Evidence of cotyledons 5b and 8b, which are smaller than the threshold volume of 2.5% of the placental volume, is indicated by red and green arrows, respectively. Voxels located within cotyledon 7b are indicated with blue arrows. In (e), a region of the primary lobe in which several spiral arteries contribute to individual anatomically-defined cotyledons are shown in an axial image section positioned at the blue line in (c). T1-weighted images acquired 39 seconds after CR administration (e, left) and the same image overlaid with cotyledon membership information (e, right) are shown. Several regions of signal enhancement, indicating multiple spiral artery sources of maternal blood, can be observed within cotyledons 1a and 2a. The segmentation procedure classifies two cotyledons (1a’ and 1a’’) within anatomically-defined cotyledon 1a, and three cotyledons (2a’, 2a’’, and 2a’’’) within anatomically-defined cotyledon 2a.
Perfusion measurements
Volumetric flow, V, for the set of perfusion domains in the primary lobe is illustrated in Figure 6. In Figures 5b, 5c, and 6, the color of each perfusion domain indicates V according to the color scales. At the earliest time point (4 sec, Figure 6a), only a subset of perfusion domains have voxels characterized by arrival times less than 4 seconds. For these perfusion domains, small closed surfaces are shown, indicating the CR wave fronts have only spread through a limited sub-volume of each perfusion domain. At subsequent time points shown in Figure 6a, the remaining perfusion domains are observed to have voxels with τ values less than the indicated time point, and within each of the domains, the surface areas of the CR wave fronts are observed to increase. In Figure 6b, the linear displacements of the CR wave fronts from each respective spiral artery are shown as a function of time for perfusion domains 2a’’, 4a, and 7a. For each perfusion domain, the set of distances, r(t), and surface areas, S(t), as a function of time were used to determine V via nonlinear least squares optimization of Eq. 3 in Matlab. These volumetric flow rates are given for the three perfusion domains in the Figure 6b inset, and the solid black curves are distances predicted based on the optimized value of V. As revealed in the Figure 6b plot, heterogeneity in the volumetric flow among perfusion domains causes the wave front distance to increase at varying rates, with faster expanding wave fronts corresponding to larger volumetric flow.
Figure 6.

Volumetric flow rate determinations for individual cotyledons in the primary lobe at G133. In (a), convex hulls of cotyledon voxels characterized by τ values less than 4, 8, 12, or 100 seconds are shown from left to right. Each cotyledon is color-coded according to volumetric flow rate. For cotyledons 2a’’, 4a, and 7a (see Figure 5), the average distance of convex hull surface coordinates to the spiral artery source is plotted as a function of τ in (b). Solid lines in (b) are the results of fitting Eq. 3 to the data, and the resulting volumetric flow rates are given in the inset.
Among the 16 perfusion domains identified in the G133 placenta, considerable variation in volumetric flow rates was observed, ranging from 9.03 to 44.9 mL/min, with a distribution mean ± standard deviation of 25.2 ± 10.3 mL/min. The mean and standard deviation in the volumetric flow rates in the 10 primary lobe perfusion domains, 27.5 ± 10.0 mL/min, did not significantly differ from the mean and standard deviation of 21.5 ± 10.5 mL/min in the 6 perfusion domains of the secondary lobe (t-test, p=0.28). To compare the volumetric flow rates determined by DCE MRI to measurements obtained by independent means, it was reasoned that the sum of the flow rates for all the placental perfusion domains should be approximately equal to the calculated uterine artery volume blood flow (cQUta) for both uterine arteries, which is determined by Doppler ultrasound. Indeed the ultrasound-based cQUta of 415 mL/min was found to be nearly identical to the sum of the volumetric flow rates for the 16 perfusion domains, which is 403 mL/min.
Discussion
We demonstrate here a novel application of DCE MRI to the analysis of maternal perfusion of the primate placenta. Due to the characteristic organization of the maternal vasculature, CR-mediated signal enhancement enables the delineation of spiral artery perfusion of maternal blood to the placental intervillous spaces following intravenous administration of a standard CR. By modeling the time series data using a GCTT model (22), T1-weighted voxel intensities were converted to a CR arrival time map. In turn, the watershed segmentation algorithm was applied to the arrival time map to determine the boundaries of each perfusion domain. This procedure was found to identify a pattern of perfusion domains that nearly provides a one-to-one correspondence to the pattern of placental cotyledons observed following Cesarean section delivery. Further, by analyzing the rate of propagation of CR throughout each perfusion domain, the volumetric flow throughout each cotyledon was estimated. The sum of flow rates determined for the set of perfusion domains was observed to closely match the blood flow through the uterine artery, measured using Doppler ultrasound.
Both technological and biological factors contributed to the presence of a relatively limited number of cases where the perfusion domains identified by MRI do not hold a one-to-one correspondence with cotyledons identified by gross anatomy. For cotyledons 5b and 8b (Figure 5b), the segmentation procedure did not identify corresponding perfusion domains that were larger than the 2.5 mL cutoff used in our analysis. Further reduction in the threshold volume to identify perfusion domains corresponding to cotyledons 5b and 8b resulted in the addition of several “false positive” perfusion domains being identified, that are not associated with cotyledons. Thus it was considered optimal for this study to utilize a 2.5 mL threshold at the cost of this implementation detail preventing the further analysis of perfusion domains associated with these cotyledons. For cotyledons 1a and 2a, the segmentation procedure identified more than one perfusion domain (2 perfusion domains for cotyledon 1a and 3 perfusion domains for cotyledon 2a, Figure 5c). In these cases, inspection of the T1-weighed images and the arrival time map revealed multiple sources of CR-mediated signal enhancement within these cotyledons (Figure 5d,e). These observations are consistent with previous anatomical reports (11,28) that some cotyledons possess multiple spiral arteries. Thus, it is acknowledged that match between the pattern of cotyledons and perfusion domains is not expected to be perfect, as their definitions are based on different biological characteristics.
Among the set of perfusion domains, a notable amount of variability in flow rates (approximately 3-fold the mean flow rate) was observed. This variability resembles that recently shown in a murine model (7) and previously described between cotyledons (29). It is anticipated that the ability to non-invasively identify and characterize the function of individual perfusion domains in the nonhuman primate placenta will be of value for interpreting the functional relevance in biochemical and histological outcomes obtained from tissue following delivery. This variable cotyledon perfusion may contribute to the observed variability in placental structure and gene expression by site of placental biopsy in humans (30-32). In addition, previous studies have characterized changes in total blood flow to the placenta throughout gestation (33). In future studies, the procedure described here will be employed to monitor development of maternal placental vasculature in nonhuman primates at the level of individual perfusion domains in the contexts of normal and compromised pregnancies.
In a number of previous animal studies, CR-mediated magnetic resonance signal enhancement has been used to study maternal perfusion of the placenta. Applications of this technique have specifically been described for nonhuman primates (34,35) and perfused human placenta (34), however these previous studies did not provide quantitative 3D analyses to determine perfusion domain boundaries and intervillous flow. More recently, several DCE-MRI-based studies of placental physiology have been reported in rodent species (6,36,37). Due to the common hemochorial structure of both human and rhesus macaque placentas, the analysis procedures described here are hoped to be extendable, at least in principle, to DCE MRI applications in humans. Nevertheless, differences between these species should be acknowledged. Specifically, the depth of trophoblast penetration into the decidua and increased number of spiral arteries in humans compared to rhesus (28) could influence blood flow rate and hence require further investigation for application to human subjects.
MRI is currently used in human pregnancies typically to evaluate fetal anomalies and in some instances to evaluate abnormal placentation (27,38-40). Gadolinium contrast has been used in human pregnancies to characterize placenta accreta (41) yet the use of MRI to measure placental perfusion in humans is limited. The first reported use of gadolinium chelate demonstrated that the placenta enhanced with contrast but perfusion was not studied quantitatively (42). Similarly, a recent clinical study investigating placental perfusion in the second trimester of human pregnancy utilizing Arterial Spin Labeling (flow-sensitive alternating inversion recovery (FAIR)) and intravoxel incoherent motion (IVIM) yielded non-quantitative tissue perfusion data. Those authors stated that conversion of their data to physiological units of ml of blood per 100g of tissue per minute was not possible as no suitable model was available to perform this conversion in placenta (43). In addition, there have been studies using MRI in conjunction with diffusion weighting, arterial spin labeling, and manipulation of oxygen concentration to create blood-oxygenation-level (BOLD)-based contrast to characterize maternal placental vascular structure (44-49) but these methods currently have not provided spatial and quantitative characterization of the maternal perfusion of the placental intervillous space. Additionally, contrast-enhanced ultrasound imaging strategies have also been reported for characterizing intervillous blood flow (10,50), however this technique is not capable of characterizing the entire placenta due to restrictions in the achievable field of view. We have developed a DCE-MRI protocol that quantifies blood flow within individually identified cotyledons, and three-dimensionally maps the placental structure in a way that is consistent with the placental histopathologic structure. The steps involved in this procedure are easily automated, such that the primary source of user input is in the manual segmentation of the placenta from surrounding tissue (approximately 1-2 hours per subject). It is our intention to utilize our DCE-MRI protocol to link maternal perfusion of the intervillous space with placental development, structure and nutrient transport in our nonhuman primate models of placental insufficiency. Research studies are currently ongoing in a larger cohort which will permit estimation of the fetal villous volume fraction in the cotyledon using stereology which will enable improvements in the estimation of flow within the intervillous space. By concurrently assessing the predictive value of contrast-based MR and ultrasound imaging techniques, these applications have the potential to be developed and applied to more fully understand both normal and abnormal placental development in the nonhuman primate. The imaging insights gained from these experimental models may be translated in the future to the clinical setting for use in the diagnosis and management of pregnancies complicated by vascular insufficiency.
Acknowledgments
Grant Support: P51 OD011092, R24 DK090964, R21 HD076265
References
- 1.Roberts DJ, Post MD. The placenta in pre-eclampsia and intrauterine growth restriction. J Clin Pathol. 2008;61(12):1254–1260. doi: 10.1136/jcp.2008.055236. [DOI] [PubMed] [Google Scholar]
- 2.Salafia CM, Vintzileos AM, Silberman L, Bantham KF, Vogel CA. Placental pathology of idiopathic intrauterine growth retardation at term. Am J Perinatol. 1992;9(3):179–184. doi: 10.1055/s-2007-999316. [DOI] [PubMed] [Google Scholar]
- 3.Salafia CM, Vogel CA, Bantham KF, Vintzileos AM, Pezzullo J, Silberman L. Preterm delivery: correlations of fetal growth and placental pathology. Am J Perinatol. 1992;9(3):190–193. doi: 10.1055/s-2007-999318. [DOI] [PubMed] [Google Scholar]
- 4.Kidron D, Bernheim J, Aviram R. Placental findings contributing to fetal death, a study of 120 stillbirths between 23 and 40 weeks gestation. Placenta. 2009;30(8):700–704. doi: 10.1016/j.placenta.2009.05.009. [DOI] [PubMed] [Google Scholar]
- 5.Taillieu F, Salomon LJ, Siauve N, Clement O, Faye N, Balvay D, Vayssettes C, Frija G, Ville Y, Cuenod CA. Placental perfusion and permeability: simultaneous assessment with dual-echo contrast-enhanced MR imaging in mice. Radiology. 2006;241(3):737–745. doi: 10.1148/radiol.2413051168. [DOI] [PubMed] [Google Scholar]
- 6.Tomlinson TM, Garbow JR, Anderson JR, Engelbach JA, Nelson DM, Sadovsky Y. Magnetic resonance imaging of hypoxic injury to the murine placenta. Am J Physiol Regul Integr Comp Physiol. 2010;298(2):R312–319. doi: 10.1152/ajpregu.00425.2009. [DOI] [PMC free article] [PubMed] [Google Scholar]
- 7.Remus CC, Sedlacik J, Wedegaertner U, Arck P, Hecher K, Adam G, Forkert ND. Application of the steepest slope model reveals different perfusion territories within the mouse placenta. Placenta. 2013;34(10):899–906. doi: 10.1016/j.placenta.2013.06.304. [DOI] [PubMed] [Google Scholar]
- 8.Kaufmann P, Burton G. Anatomy and genesis of the placenta. In: Knobil E, Neill JD, editors. The physiology of reproduction. 2 ed Raven Press; New York: 1994. pp. 441–483. [Google Scholar]
- 9.Enders AC, Blankenship TN. Comparative placental structure. Adv Drug Deliv Rev. 1999;38:3–15. doi: 10.1016/s0169-409x(99)00003-4. [DOI] [PubMed] [Google Scholar]
- 10.Ragavendra N, Tarantal AF. Intervillous blood flow in the third trimester gravid rhesus monkey (Macaca mulatta): Use of sonographic contrast agent and harmonic imaging. Placenta. 2001;22:200–205. doi: 10.1053/plac.2000.0605. [DOI] [PubMed] [Google Scholar]
- 11.Gruenwald P. Maternal blood supply to the conceptus. Europ J Obstet Gynec Reprod Biol. 1975;5:23–34. doi: 10.1016/0028-2243(75)90127-6. [DOI] [PubMed] [Google Scholar]
- 12.Ramsey EM, Donner MW. Placental vasculature and circulation: Anatomy, physiology, radiology, clinical aspects : atlas and textbook. Saunders; Philadelphia, PA: 1980. p. 101. [Google Scholar]
- 13.Benirschke K. Placentation. J Exp Zool. 1983;228:385–389. doi: 10.1002/jez.1402280221. [DOI] [PubMed] [Google Scholar]
- 14.Roberts VHJ, Rasanen JP, Novy MJ, Frias A, Louey S, Morgan TK, Thornburg KL, Spindel ER, Grigsby PL. Restriction of placental vasculature in a non-human primate: A unique model to study placental plasticity. Placenta. 2012;33:73–76. doi: 10.1016/j.placenta.2011.10.003. [DOI] [PMC free article] [PubMed] [Google Scholar]
- 15.Sundgren PC, Leander P. Is administration of gadolinium-based contrast media to pregnant women and small children justified? J MRI. 2011;34:750–757. doi: 10.1002/jmri.22413. [DOI] [PubMed] [Google Scholar]
- 16.Konje JC, Kaufmann P, Bell SC, Taylor DJ. A longitudinal study of quantitative uterine blood flow with the use of color power angiography in appropriate for gestational age pregnancies. Am J Obstet Gynecol. 2001;185(3):608–613. doi: 10.1067/mob.2001.117187. [DOI] [PubMed] [Google Scholar]
- 17.Acharya G, Sitras V, Erkinaro T, Makikallio K, Kavasmaa T, Pakkila M, Huhta JC, Rasanen J. Experimental validation of uterine artery volume blood flow measurement by Doppler ultrasonography in pregnant sheep. Ultrasound Obstet Gynecol. 2007;29(4):401–406. doi: 10.1002/uog.3977. [DOI] [PubMed] [Google Scholar]
- 18.Schabel MC, Parker DL. Uncertainty and bias in contrast concentration measurements using spoiled gradient echo pulse sequences. Physics in medicine and biology. Volume 532008:2345–2373. doi: 10.1088/0031-9155/53/9/010. [DOI] [PMC free article] [PubMed] [Google Scholar]
- 19.Rohrer M, Bauer H, Mintorovitch J, Requardt M, Weinmann HJ. Comparison of magnetic properties of MRI contrast media solutions at different magnetic field strengths. Investigative radiology. 2005;40(11):715–724. doi: 10.1097/01.rli.0000184756.66360.d3. [DOI] [PubMed] [Google Scholar]
- 20.Wright C, Morris DM, Baker PN, Crocker IP, Gowland PA, Parker GJ, Sibley CP. Magnetic resonance imaging relaxation time measurements of the placenta at 1.5 T. Placenta. 2011;32:1010–1015. doi: 10.1016/j.placenta.2011.07.008. [DOI] [PMC free article] [PubMed] [Google Scholar]
- 21.Stanisz GJ, Odrobina EE, Pun J, Escaravage M, Graham SJ, Bronskill MJ, Hankelman RM. T1, T2 relaxation and magnetization transfer in tissue at 3T. Magn Reson Med. 2005;54:507–512. doi: 10.1002/mrm.20605. [DOI] [PubMed] [Google Scholar]
- 22.Schabel MC. A unified impulse response model for DCE-MRI. Magn Reson Med. 2012;68:1632–1646. doi: 10.1002/mrm.24162. [DOI] [PubMed] [Google Scholar]
- 23.Yushkevich PA, Piven J, Hazlett HC, Smith RG, Ho S, Gee JC, Gerig G. User-guided 3D active contour segmentation of anatomical structures: Significantly improved efficiency and reliability. NeuroImage. 2006;31:1116–1128. doi: 10.1016/j.neuroimage.2006.01.015. [DOI] [PubMed] [Google Scholar]
- 24.Gonzalez RC, Woods RE, Eddins SL. Digital image processing using MATLAB. Gatesmark Publishing; 2009. www.gatesmark.com. [Google Scholar]
- 25.Mayhew TM, Joy CF, Haas JD. Structure-function correlation in the human placenta: the morphometric diffusing capacity for oxygen at full term. J Anat. 1984;139:691–708. [PMC free article] [PubMed] [Google Scholar]
- 26.Cormen TH, Leiserson CE, Rivest RL, Stein C. Introduction to Algorithms. MIT Press; Cambridge, MA: 2009. [Google Scholar]
- 27.Leyendecker JR, DuBose M, Hosseinzadeh K, Stone R, Gianini J, Childs DD, Snow AN, Mertz H. MRI of pregnancy-related issues: abnormal placentation. AJR Am J Roentgenol. 2012;198(2):311–320. doi: 10.2214/AJR.11.7957. [DOI] [PubMed] [Google Scholar]
- 28.Gruenwald P. The development of the placental lobular pattern in the human. Review and reinterpretation of the material. Obstet Gynecol. 1977;49:728–732. [PubMed] [Google Scholar]
- 29.Power GG, Longo LD, Wagner N, Jr., Kuhl DE, Forster RE., 2nd Uneven distribution of maternal and fetal placental blood flow, as demonstrated using macroaggregates, and its response to hypoxia. The Journal of clinical investigation. 1967;46(12):2053–2063. doi: 10.1172/JCI105693. [DOI] [PMC free article] [PubMed] [Google Scholar]
- 30.Boyd PA, Brown RA, Stewart WJ. Quantitative structural differences within the normal term hum;an placenta: a pilot study. Placenta. 1980;1(4):337–344. doi: 10.1016/s0143-4004(80)80035-x. [DOI] [PubMed] [Google Scholar]
- 31.Mayhew TM. Taking tissue samples from the placenta: an illustration of principles and strategies. Placenta. 2008;29(1):1–14. doi: 10.1016/j.placenta.2007.05.010. [DOI] [PubMed] [Google Scholar]
- 32.Wyatt SM, Kraus FT, Roh CR, Elchalal U, Nelson DM, Sadovsky Y. The correlation between sampling site and gene expression in the term human placenta. Placenta. 2005;26(5):372–379. doi: 10.1016/j.placenta.2004.07.003. [DOI] [PubMed] [Google Scholar]
- 33.Roberts VH, Rasanen JP, Novy MJ, Frias A, Louey S, Morgan TK, Thornburg KL, Spindel ER, Grigsby PL. Restriction of placental vasculature in a non-human primate: a unique model to study placental plasticity. Placenta. 2012;33(1):73–76. doi: 10.1016/j.placenta.2011.10.003. [DOI] [PMC free article] [PubMed] [Google Scholar]
- 34.Panigel M, Coulam C, Wolf G, Zeleznik A, Leone F, Podesta C. Magnetic resonance imaging (MRI) of the placental circulation using gadolinium-DTPA as a paramagnetic marker in the rhesus monkey in vivo and the perfused human placenta in vitro. Trophoblast Res. 1988;3:271–282. [Google Scholar]
- 35.Kay HH, Knop RC, Mattison DR. Magnetic resonance imaging of monkey placenta with manganese enhancement. Am J Obstet Gynecol. 1987;157:185–189. doi: 10.1016/s0002-9378(87)80377-0. [DOI] [PubMed] [Google Scholar]
- 36.Salomon LJ, Siauve N, Taillieu F, Balvay D, Vayssettes C, Frija G, Ville Y, Cuenod CA, Clement O. In vivo dynamic MRI measurement of the noradrenaline-induced reduction in placental blood flow in mice. Placenta. 2006;27(9-10):1007–1013. doi: 10.1016/j.placenta.2005.10.007. [DOI] [PubMed] [Google Scholar]
- 37.Salomon LJ, Siauve N, Balvay D, Cuenod CA, Vayssettes C, Luciani A, Frija G, Ville Y, Clement O. Placental perfusion MR imaging with contrast agents in a mouse model. Radiology. 2005;235(1):73–80. doi: 10.1148/radiol.2351040192. [DOI] [PubMed] [Google Scholar]
- 38.Palacios-Jaraquemada JM, Bruno CH, Martin E. MRI in the diagnosis and surgical management of abnormal placentation. Acta obstetricia et gynecologica Scandinavica. 2013;92(4):392–397. doi: 10.1111/j.1600-0412.2012.01527.x. [DOI] [PubMed] [Google Scholar]
- 39.Podrasky AE, Javitt MC, Glanc P, Dubinsky T, Harisinghani MG, Harris RD, Khati NJ, Mitchell DG, Pandharipande PV, Pannu HK, Shipp TD, Siegel CL, Simpson L, Wall DJ, Wong-You-Cheong JJ, Zelop CM. ACR Appropriateness Criteria(R) Second and Third Trimester Bleeding. Ultrasound quarterly. 2013;29(4):293–301. doi: 10.1097/RUQ.0000000000000044. [DOI] [PubMed] [Google Scholar]
- 40.Levine D, Hulka CA, Ludmir J, Li W, Edelman RR. Placenta accreta: evaluation with color Doppler US, power Doppler US, and MR imaging. Radiology. 1997;205(3):773–776. doi: 10.1148/radiology.205.3.9393534. [DOI] [PubMed] [Google Scholar]
- 41.Palacios Jaraquemada JM, Bruno C. Gadolinium-enhanced MR imaging in the differential diagnosis of placenta accreta and placenta percreta. Radiology. 2000;216(2):610–611. doi: 10.1148/radiology.216.2.r00ma26610. [DOI] [PubMed] [Google Scholar]
- 42.Marcos HB, Semelka RC, Worawattanakul S. Normal placenta: gadolinium-enhanced dynamic MR imaging. Radiology. 1997;205(2):493–496. doi: 10.1148/radiology.205.2.9356634. [DOI] [PubMed] [Google Scholar]
- 43.Derwig I, Lythgoe DJ, Barker GJ, Poon L, Gowland P, Yeung R, Zelaya F, Nicolaides K. Association of placental perfusion, as assessed by magnetic resonance imaging and uterine artery Doppler ultrasound, and its relationship to pregnancy outcome. Placenta. 2013;34(10):885–891. doi: 10.1016/j.placenta.2013.07.006. [DOI] [PubMed] [Google Scholar]
- 44.Francis ST, Duncan KR, Moore RJ, Baker PN, Johnson IR, Gowland PA. Non-invasive mapping of placental perfusion. Lancet. 1998;351(9113):1397–1399. doi: 10.1016/S0140-6736(97)07089-X. [DOI] [PubMed] [Google Scholar]
- 45.Gowland PA, Francis ST, Duncan KR, Freeman AJ, Issa B, Moore RJ, Bowtell RW, Baker PN, Johnson IR, Worthington BS. In vivo perfusion measurements in the human placenta using echo planar imaging at 0.5 T. Magn Reson Med. 1998;40(3):467–473. doi: 10.1002/mrm.1910400318. [DOI] [PubMed] [Google Scholar]
- 46.Moore RJ, Issa B, Tokarczuk P, Duncan KR, Boulby P, Baker PN, Bowtell RW, Worthington BS, Johnson IR, Gowland PA. In vivo intravoxel incoherent motion measurements in the human placenta using echo-planar imaging at 0.5 T. Magn Reson Med. 2000;43(2):295–302. doi: 10.1002/(sici)1522-2594(200002)43:2<295::aid-mrm18>3.0.co;2-2. [DOI] [PubMed] [Google Scholar]
- 47.Ong SS, Tyler DJ, Moore RJ, Gowland PA, Baker PN, Johnson IR, Mayhew TM. Functional magnetic resonance imaging (magnetization transfer) and stereological analysis of human placentae in normal pregnancy and in pre-eclampsia and intrauterine growth restriction. Placenta. 2004;25(5):408–412. doi: 10.1016/j.placenta.2003.10.011. [DOI] [PubMed] [Google Scholar]
- 48.Chalouhi GE, Deloison B, Siauve N, Aimot S, Balvay D, Cuenod CA, Ville Y, Clement O, Salomon LJ. Dynamic contrast-enhanced magnetic resonance imaging: definitive imaging of placental function? Semin Fetal Neonatal Med. 2011;16(1):22–28. doi: 10.1016/j.siny.2010.09.001. [DOI] [PubMed] [Google Scholar]
- 49.Sorensen A, Peters D, Frund E, Lingman G, Christiansen O, Uldbjerg N. Changes in human placental oxygenation during maternal hyperoxia estimated by blood oxygen level-dependent magnetic resonance imaging (BOLD MRI) Ultrasound Obstet Gynecol. 2013;42:310–314. doi: 10.1002/uog.12395. [DOI] [PubMed] [Google Scholar]
- 50.Arthuis CJ, Novell A, Escoffre J-M, Patat F, Bouakaz A, Perrotin F. New insights into uteroplacental perfusion: Quantitative analysis using Doppler and contrast-enhanced ultrasound imaging. Placenta. 2013;34:424–431. doi: 10.1016/j.placenta.2013.01.019. [DOI] [PubMed] [Google Scholar]