Abstract
The conservation level of a residue is a useful measure about the importance of that residue in protein structure and function. Much information about sequence conservation comes from aligning homologous sequences. Profiles showing the variation of the conservation level along the sequence are usually interpreted in evolutionary terms and dictated by site similarities of a proper set of homologous sequences. Here, we report that, of the viral icosahedral capsids, the sequence conservation profile can be determined by variations in the distances between residues and the centroid of the capsid – with a direct inverse proportionality between the conservation level and the centroid distance – as well as by the spatial variations in local packing density. Examining both the centroid and the packing density models against a dataset of 51 crystal structures of nonhomologous icosahedral capsids, we found that many global patterns and minor features derived from the viral structures are consistent with those present in the sequence conservation profiles. The quantitative link between the level of conservation and structural features like centroid-distance or packing density allows us to look at residue conservation from a structural viewpoint as well as from an evolutionary viewpoint.
Introduction
Structural biologists have long used the so-called radius-colored surface model in 3D graphics to render the structures of icosahedral capsids of viruses[1–10]. In this model, the residues on the virus surface are color-coded radially from the centroid of the capsid. In this way, interesting surface patterns emerge on capsids. These surface patterns are often indicative of biological functionality, such as the surface pores associated with the export/import of genetic material or molecular components [2,5–7] or surface clefts involved in specific binding. This model can even be applied to low-resolution surface models derived from cryo-EM maps[3,4] to revealing otherwise indiscernible surface patterns. But, the radial-colored surface model is often considered merely as an image enhancement tool without any biological bases.
We examine a set of nonhomologous crystal structures of 51 icosahedral capsids, computing the centroid distances of residues and looking for possible biological connections. We find that, for each capsid, the residues with a similar level of conservation often arrange themselves equidistantly from the centroid of the capsid, with the conservation level of residues in direct inverse proportion to their centroid distances. Hence, a straightforward inference from this is that highly conserved residues tend to lie near the centroids of structures. Indeed, a number of studies[11,12] reported that the catalytic residues (hence, highly conserved) of enzymes are usually found near the centroids of structures. However, the centroid model, being an isotropic model (i.e., free of orientation parameters), is considered as a specialized model for highly symmetrical structures like spherical capsids. Hence, we examine another general model developed by Hwang and co-workers[13,14] on the same dataset. In this model, the sequence conservation profile is modeled by the spatial variations in local packing density. We found that both models perform well on the capsid dataset, though, with regards to accuracy, the packing density model is superior to the centroid model.
The quantitative link between the conservation and structural features found here indicates that the level of amino acid conservation may be derived from atomic coordinates. This is not as surprising as first thought. Structural features (like packing density) have long been recognized related to sequence conservation–a low-density site may accommodate a variety of alternative residue types, whereas a high-density site might be allowed only for a few closely similar residue types. But this observation was considered as of a qualitative nature[15] until recently[14,16–18]. Considering that a protein sequence evolves millions of years under the constraints imposed by protein structure and function[19]. It is noted that the amino acid types at certain sites are limited by functional constraints–for example, of catalytic residues in the active sites of enzymes, more than 90% are either charged or polar[20,21]. But since protein function requires a properly folded structure, it is the interactions within the protein structure that will determine residue conservation. Therefore, some structural features of folded proteins may quantitatively reflect residue conservation.
Materials and Methods
The packing density model
The packing density of a residue in a protein structure is defined as the number of neighboring residues within a certain cutoff radius. That number is referred to as contact number of that residue. Each neighboring residue is counted as contributing a unit of contact number without distance-dependence as long as that residue is within the cutoff distance. Conventionally, the packing density uses only Cα atoms. In other word, the residue is reduced to a Cα atom. Here, we will use the packing density model developed by Lin et al.[22]. This model does not have a cutoff radius. Due to this, it has found a number of interesting applications[21,23,24]. The packing density n i of residue i is defined as
| (1) |
where r ij is the distance between residue i and j. It takes into account all other residues in the protein, with the unit contribution from each of the other residues weighted by the inverse square of the separation between it and the said residue. Following the convention of Lin et al.[22], we will prefer to use the reciprocal of n i, i.e., . w i is called the weighted contact number (WCN). The normalized WCN z w is defined , where and σ w are the mean and the standard deviation of w, respectively. The WCN value is between -1 and 1. Note that the WCN is defined reciprocally to the convention contact number. Hence, the value of -1 gives the highest packing density in a protein and the value of 1 gives the lowest packing density. In the text, the normalized WCN will be simply referred to as the WCN, unless otherwise specified. The WCN profile (or the packing density profile) refers to the series, 〈z w,1,z w,2,z w,3,…,z w,N〉. For each subunit of the capsid, its WCN profile is computed taking into account the whole structure of the capsid. In other word, the WCN profile of a subunit includes packing contributions from that subunit as well as from other subunits of the capsid.
The centroid model
The centroid-distance (or c-distance) of a residue is defined as the distance from the Cα atom of the residue to the centroid of the capsid. The centroid is the average position of the Cα atoms. The centroid of the capsid is computed taking into consideration the whole capsid. For convenience, the c-distance of a residue is normalized in such a way that its average is zero and its standard deviation is 1. The normalized c-distance is denoted as z r. In the text, we will refer to the normalized centroid distance simply as the centroid distance or the radial distance, unless otherwise specified. The distribution of z r along the polypeptide chain is called the c-distance profile.
Sequence conservation profiles
The site-specific substitution rates are computed by Rate4Site[25] implemented in the ConSurf server[26]. Rate4Site models the evolutionary process considering the phylogenetic relationships between homologous sequences, thus avoiding uneven sampling in sequence space; in addition, it takes into account the stochastic nature of the underlying evolution process, using a probability model based on the JTT matrix[27] to compute amino acid substitution probabilities for each branch in the phylogenetic tree. Following the convention of the work by Shih et al.[13], we will refer to the site's substitution rate as its conservation score; hence, the site of a lower conservation score is more conserved than that of a higher conservation score. In addition, we will refer to the conservation scores along the sequence as the sequence conservation (SC) profile of the protein. To reduce noise, the profile is smoothed using a sliding window as described by Shih et al.[13]. The SC profile is normalized such that its average is zero and its standard deviation is 1, as in the case of the WCN profile described before.
The Dataset
We selected 51 capsids from the VIrus Particle ExploreR database (VIPERdb)[28] with a sequence homology < 30% of sequence identity. Of the set of capsids, 34 are homomers and 17 are hetereomers. The 51 capsids are listed in S1 Table.
Results
Structural features and the levels of conservation for capsid
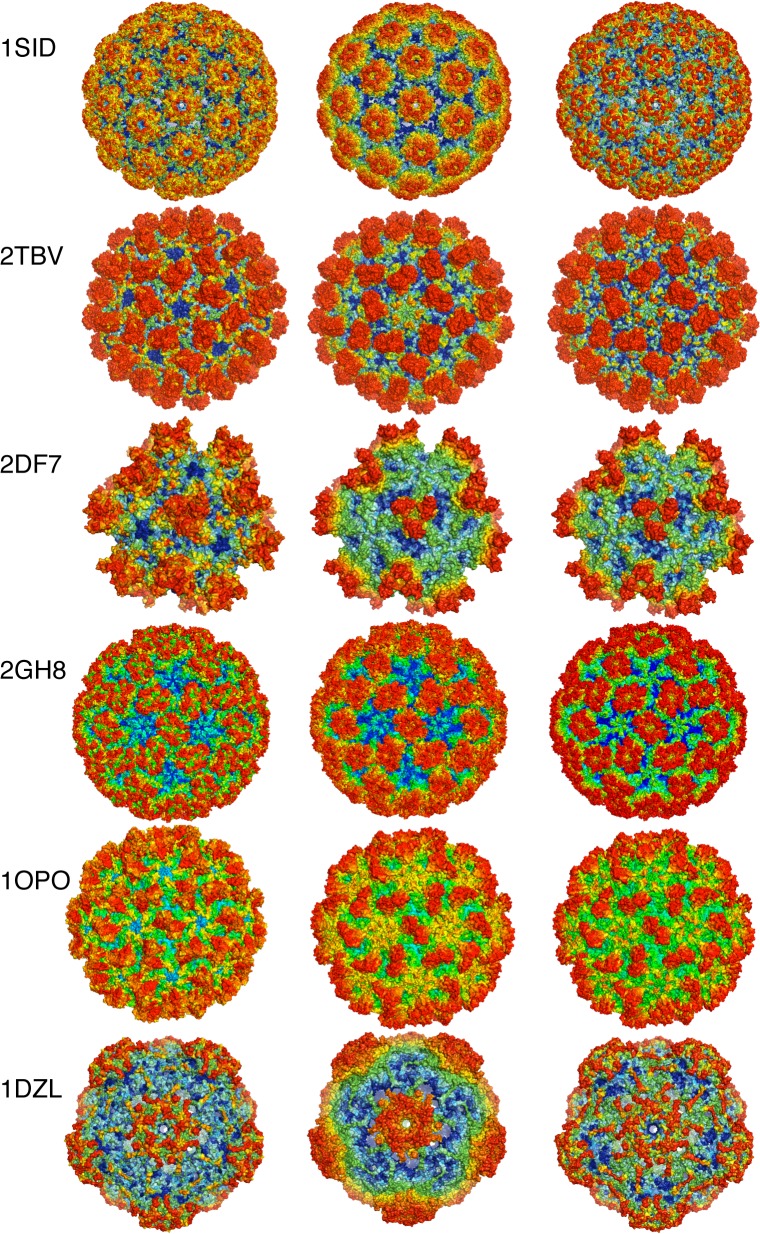
Six viral capsids are selected as examples from the dataset, with each viral capsid colored by three different rainbow color schemes according to evolutionary or structural features (Fig 1), which are (1) the conservation scores, (2) the centroid-distances (or c-distances) and (3) the WCNs. It is obvious that all three surface representations of each capsid look very similar to each other (a particular example will be discussed in more detail later). It is obvious that conservation scores, WCNs and c-distances appear to have a close link between them. Since conservation scores are derived from aligning homologous sequences, while c-distances and WCNs are derived from a Cα backbone, this indicates that there seems to have a close link between conservation level and structural features. The complete graphics representations of 51 capsids are shown in S1 Fig.
Fig 1. The capsid crystal structures of 6 viruses.
Each structure is represent by three surface representations: the conservation-colored structure is shown on the left, the c-distance-colored structure in the middle, and the WCN-colored structure on the right. All structures follow a continuous rainbow color scheme ranging from red to blue, with the red designating the residue that is the farthest from the centroid, the least packed or the least conserved, the blue designating the residue that is closest to the centroid, or the most packed, or the most conserved, and the colors in-between designating the corresponding intermediate values of the quantities said.
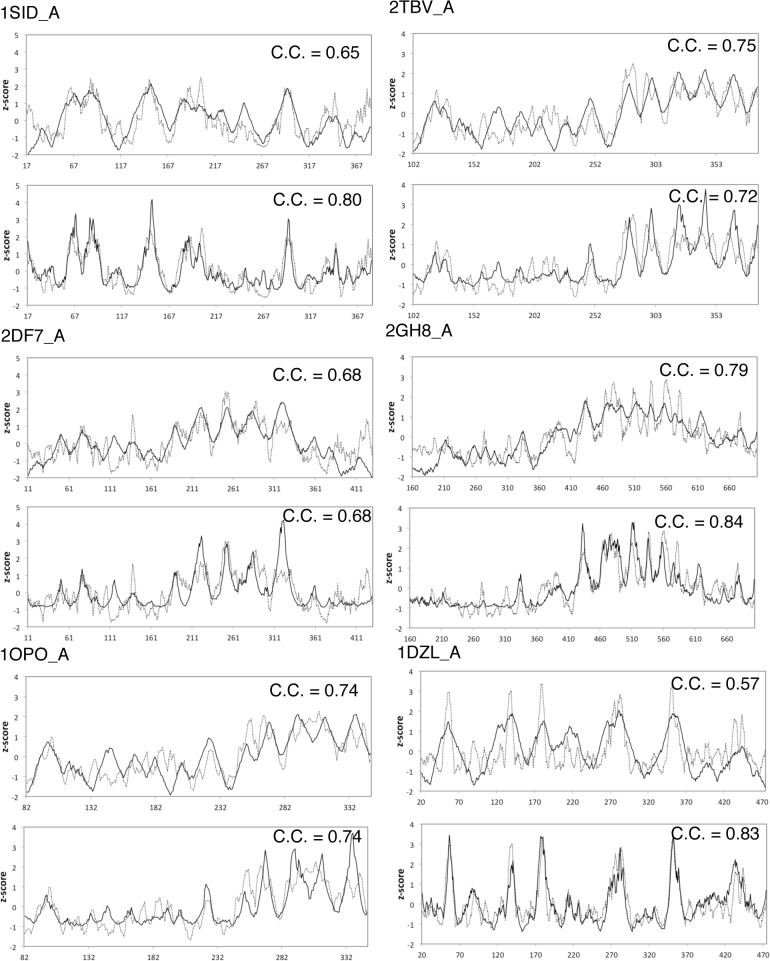
To have a quantitative comparison between models, we compute the three types of profiles of the viral proteins of the capsids, shown in Fig 2. The similarities between the sequence conservation profiles and the c-distance profiles or the packing density profiles are impressive, with the Pearson's correlation coefficient between them ranging from 0.65 to 0.84. So now, we have three types of profiles at hand, one from sequence and the other two derived from structure, signifying different biological meanings, and yet we can put them side-by-side for direct comparison. This leads to an interesting conjecture that the positions of Cα atoms (hence, no explicit sequence information) contain conservation information comparable with that contained in homologous sequences. For the 51 capsids of the dataset, the average correlation coefficients of the centroid model and the packing density model with the sequence conservation profile for 51 capsids are 0.51 and 0.56, respectively. The complete profiles of 51 capsids are shown in S2 Fig.
Fig 2. Comparison of profiles.
Each plot shows the radius distribution profile (solid line) and conservation profile (dotted line) (the top plot under the PDB ID) and the WCN profile (solid line) and the conservation profile (dotted line) (the bottom plot under the PDB ID). The Pearson’s correlation coefficient is shown on each plot.
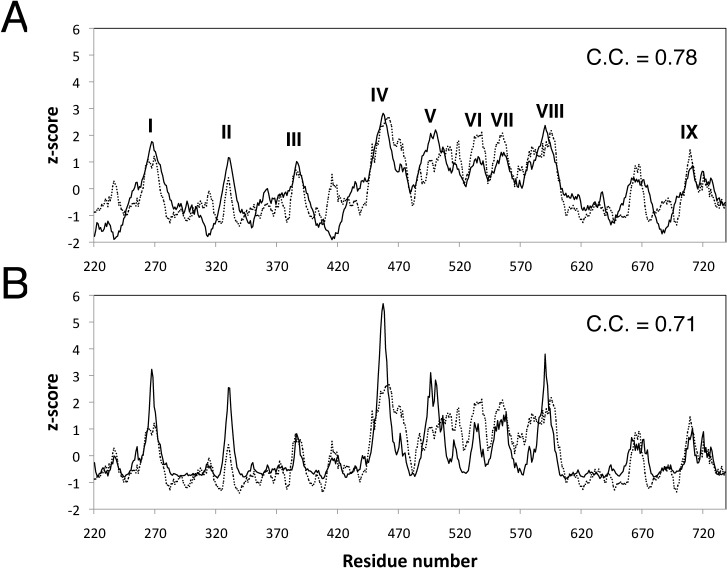
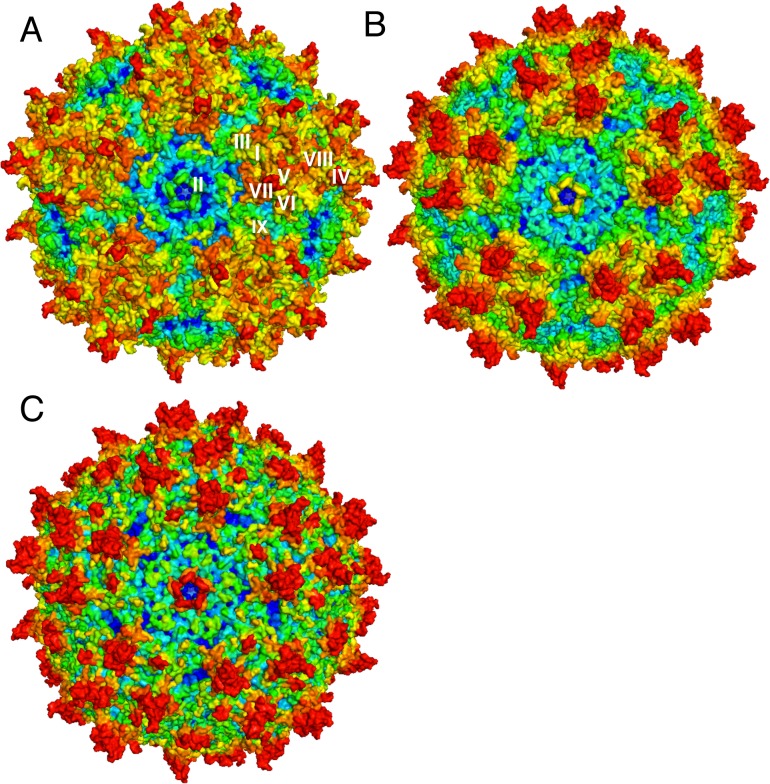
It will be instructive to look at a specific example in more details. Adeno-associated viruses (AAVs) have been studied as possible gene therapy vectors to deliver corrective genes into target cells[29–32]. The capsid crystal structure of the AAV serotype 8 (or AAV8) has been determined to 2.6 Å (PDB ID: 2QA0)[30]. Its capsid shell contains 60 structural subunits, each comprising three viral proteins, VP1, VP2 and VP3, all of which are translated from the same mRNA[30]. It is noted that the AAV8 capsid contains 9 variable loop regions (I-IX)[29], which are not only responsible for causing local topological difference from other AAVs, but also are associated with affecting receptor recognition, transduction, and capsid antibody reactivity. The c-distance profile and the WCN profile correctly reproduce 9 variable regions (Fig 3). Both profiles correlate with the sequence conservation profile with excellent Pearson's correlation coefficients of 0.78 and 0.71, respectively. In Fig 4, we show the surface representations of the AAV8 capsid colored according to conservation and structural features, respectively. We label on the conservation-colored surface representation of the variable loop regions, which are easily recognizable as patches or patterns of distinct colors. For example, the variable region II appears as a pentameric form with fivefold symmetry surrounding the channel[31–33].
Fig 3. Comparison of the profiles of the viral protein of AAV8 capsid.
(A) The c-distance profile (solid line) compared with the sequence conservation profile (dotted line); The variable loop regions I-IX are also labeled. (B) The WCN profile (solid line) compared with the sequence conservation profile. The correlation coefficients are shown.
Fig 4. The capsid crystal structure of the AAV serotype 8 (AAV8) in three surface representations.
(A) the conservation-colored structure, on which the variable loop regions I-IX are labeled, (B) the c-distance-colored structure and (C) the WCN-colored structure.
On the relation between the centroid model and the packing density model
In Fig 5, we examine the average trends of c-distances and WCNs along the conservation score for 51 capsids. This is done by collecting the said values (c-distances or WCNs) falling into a specific conservation-bin and averaging them over the residues in that bin. The bin-size Δz is 0.3. The conservation score exhibits a linear behavior with the c-distance for z r > 0.4, but approaches a plateau-value when the c-distance gets smaller. Therefore, the centroid model is expected to work generally well for residues lying closer to the outer surface of the capsid shell, but, as residues getting closer to the inside surface of the capsid, it will tend to overestimate the conservation levels of those residues. On the other hand, the conservation score shows an excellent linear relationship with the WCN with a correlation r 2 = 0.997.
Fig 5. Plots showing different structural features against conservation score.
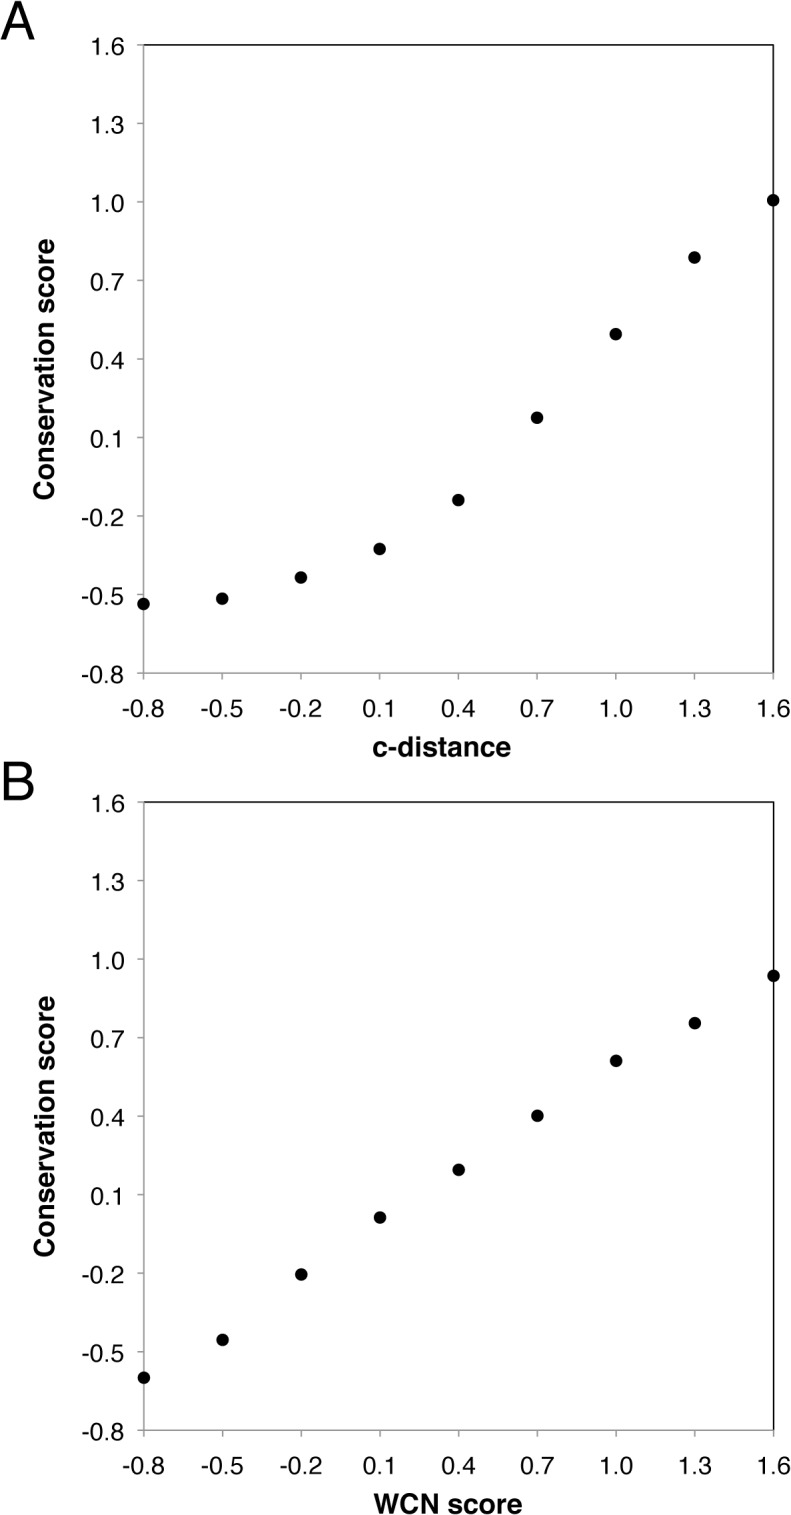
(A) the scatter plot of conservation score vs. c-distance; (B) the scatter plot of conservation score vs. WCN score. Note that these quantities are all normalized (see Methods).
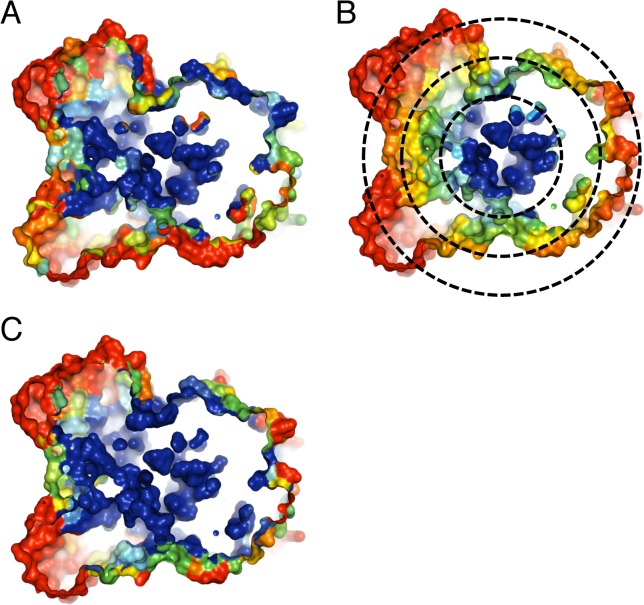
The centroid model is an isotropic model (i.e., it is independent of orientations); hence, the centroid model is expected to work well for spherical (or nearly) structures such as icosahedral capsids, as indeed is what we found. But it may not work as well for non-spherical structures. Fig 6 shows such an example. A 2,4-dienoyl-CoA reductase from E. coli (a non-viral protein)[34] is shown in three models, with a clip plane cut through the middle of the structure, exposing the residues in the core of the protein. The distribution of conservation levels (Fig 6A) is clearly not isotropic as predicted by the centroid model (Fig 6B). But it agrees excellently with the packing density model (Fig 6C).
Fig 6. Three surface representations of the structure of 2,4-dienoyl-CoA reductase (PDB ID: 1PS9).
Each structure is cut with a clip plane cut through the middle of the structure, showing the core of the protein: (A) the conservation-colored structure; (B) the c-distance-colored structure, together with concentric circles in dotted line with varying radii centered at the centroid; (C) the WCN-colored structure.
Discussion
Considering their simplicity, the structure-based models (i.e., the centroid model and the packing density model), are surprisingly successful in deriving evolutionary information from capsid structures comparable to that from sequence alignment. Both models are based on the idea that the sequence conservation profile is governed by the variations in either c-distance or packing density. The site-specific conservation is usually thought of from an evolutionary viewpoint. It is typically inferred from a multiple sequence alignment of homologous sequences. Numerous methods[35] for detecting residue conservation have been proposed, based on various considerations such as symbol frequency, stereochemical property, mutation data or phylogenetic relationships, though none has currently emerged as a generally accepted standard [36]. By relating residue conservation directly to structural features, the structure-based models allow us to examine residue conservation from a structural viewpoint as well as from an evolutionary viewpoint.
As demonstrated here, variations in residue conservation in capsids relate well to structural features such as the distribution of residues in terms of their separations away from the capsid centroid or spatial inhomogeneities in packing density. By incorporating these features, our models help shed light on the structural basis of residue conservation. On the other hand, the success of these models implies that protein structure can provide information about the level of residue conservation independent of that derived from sequence alignment. Further insight into residue conservation may come from cases where predictions are least accurate; for example, some discrepancies in the packing density model have been attributed to missing binding partners[13,14]. The accuracy of our models might be improved by resorting to an all-atom model, by using weights for different atom types, or by considering binding molecules, though truly quantitative accuracy probably cannot be anticipated from such simple models.
Though conserved residues are usually found close to the protein centroid, things become complicated for non-globular structures like multi-domain proteins or protein complexes[11,12,37,38]. For example, for a structure of several domains, it happens that for some proteins one should compute one centroid for each domain, while for others one need to compute only one centroid for the whole structure[39]. The same dilemma also occurs for protein complexes–for some complexes, one should compute one centroid for each subunit of the complex, while for others one need to compute only one centroid for the complex as a whole[39]. On the other hand, the packing density (or the WCN) can be applied to relating residue conservation in a much more straightforward way than the c-distance. Since protein centroids are usually close to the regions of high packing density[39,40], the centroid model could be seen as an approximation to the WCN model for more symmetrical structures. Indeed, The WCN has been shown to be a much better structure feature to predict catalytic residues than the centroid model [21,24].
Echave et al. [41] noticed that the flexibility of protein backbone, described in terms of atomic mean squared displacements or B-factors, is conserved at family and superfamily levels. Though B-factors are usually interpreted in terms of dynamics, they are in fact static equilibrium properties[42], and thus can be determined from structures without invoking motion. Indeed, studies[22,37,38,43] showed that the B-factors profiles are quantitatively linked to c-distances [37,38] and packing density[22,43]. Based on these studies together with ours, residue rigidity and residue conservation are expected to closely relate to each other.
Therefore, there is a definite relation between the conservation level of residues and their motional thermal fluctuations. Interestingly, this relation can be best explained in terms of Warshel's pre-organization theory[44–46], a theory explaining how enzymes work. Its main idea is that the catalytic residues, being optimized through evolution, are pre-organized in such way that they will remain in similar conformations in both reactant and transition states, thus reducing reorganization energy, to accelerate chemical reactions. There are also reports that residues involved in ligand binding usually have smaller B-factors (i.e., more rigid)[23]. The relationship between packing density and residue conservation may relate to the motional thermal fluctuations or the rigidity of the residues that may be involved in the molecular interactions such as enzymatic reactions, ligand binding or structural packing.
In summary, we show that different profiles, derived from different sources, thus subjecting to different interpretations, can be very closely associated with each other. This means that, if looked upon from a reverse viewpoint, one single profile may be interpreted in different ways. For example, given a conservation profile of a protein sequence, biologists can interpret it in terms of packing density, c-distances or protein flexibility besides conservation, thus gaining a deeper understanding of that protein.
Supporting Information
The conservation surface representation is shown on the left, the centroid surface representation in the middle, and the WCN surface representation on the right.
(PDF)
Comparison of the radius distribution profile (solid line) and conservation profile (dotted line) (the top plot under the PDB ID) and the WCN profile (solid line) and the conservation profile (dotted line) (the bottom plot under the PDB ID).
(PDF)
(PDF)
Acknowledgments
This research was supported in part by Academic Summit Program of Ministry of Science and Technology [MOST-103-2321-B-009-002] and 'Center for Bioinformatics Research of Aiming for the Top University Program' of the National Chiao Tung University and Ministry of Education, Taiwan, R.O.C..
Data Availability
All relevant data are within the paper and its Supporting Information files.
Funding Statement
This research was supported in part by Academic Summit Program of Ministry of Science and Technology [MOST-103-2321-B-009-002] and 'Center for Bioinformatics Research of Aiming for the Top University Program' of the National Chiao Tung University and Ministry of Education, Taiwan, R.O.C.
References
- 1. Wang X, Peng W, Ren J, Hu Z, Xu J, Lou Z, et al. (2012) A sensor-adaptor mechanism for enterovirus uncoating from structures of EV71. Nat Struct Mol Biol 19: 424–429. 10.1038/nsmb.2255 [DOI] [PMC free article] [PubMed] [Google Scholar]
- 2. Bakker SE, Ford RJ, Barker AM, Robottom J, Saunders K, Pearson AR, et al. (2012) Isolation of an asymmetric RNA uncoating intermediate for a single-stranded RNA plant virus. J Mol Biol 417: 65–78. 10.1016/j.jmb.2012.01.017 [DOI] [PMC free article] [PubMed] [Google Scholar]
- 3. Guu TS, Liu Z, Ye Q, Mata DA, Li K, Yin C, et al. (2009) Structure of the hepatitis E virus-like particle suggests mechanisms for virus assembly and receptor binding. Proc Natl Acad Sci U S A 106: 12992–12997. 10.1073/pnas.0904848106 [DOI] [PMC free article] [PubMed] [Google Scholar]
- 4. Pan J, Dong L, Lin L, Ochoa WF, Sinkovits RS, Havens WM, et al. (2009) Atomic structure reveals the unique capsid organization of a dsRNA virus. Proc Natl Acad Sci U S A 106: 4225–4230. 10.1073/pnas.0812071106 [DOI] [PMC free article] [PubMed] [Google Scholar]
- 5. Spencer SM, Sgro JY, Dryden KA, Baker TS, Nibert ML (1997) IRIS explorer software for radial-depth cueing reovirus particles and other macromolecular structures determined by cryoelectron microscopy and image reconstruction. J Struct Biol 120: 11–21. [DOI] [PubMed] [Google Scholar]
- 6. Lu G, Zhou ZH, Baker ML, Jakana J, Cai D, Wei X, et al. (1998) Structure of double-shelled rice dwarf virus. J Virol 72: 8541–8549. [DOI] [PMC free article] [PubMed] [Google Scholar]
- 7. Zhou ZH, Baker ML, Jiang W, Dougherty M, Jakana J, Dong G, et al. (2001) Electron cryomicroscopy and bioinformatics suggest protein fold models for rice dwarf virus. Nat Struct Biol 8: 868–873. [DOI] [PubMed] [Google Scholar]
- 8. Grant RA, Filman DJ, Fujinami RS, Icenogle JP, Hogle JM (1992) Three-dimensional structure of Theiler virus. Proc Natl Acad Sci U S A 89: 2061–2065. [DOI] [PMC free article] [PubMed] [Google Scholar]
- 9. Jiang W, Baker ML, Jakana J, Weigele PR, King J, Chiu W (2008) Backbone structure of the infectious epsilon15 virus capsid revealed by electron cryomicroscopy. Nature 451: 1130–1134. 10.1038/nature06665 [DOI] [PubMed] [Google Scholar]
- 10. Chen DH, Baker ML, Hryc CF, DiMaio F, Jakana J, Wu W, et al. (2011) Structural basis for scaffolding-mediated assembly and maturation of a dsDNA virus. Proc Natl Acad Sci U S A 108: 1355–1360. 10.1073/pnas.1015739108 [DOI] [PMC free article] [PubMed] [Google Scholar]
- 11. Amitai G, Shemesh A, Sitbon E, Shklar M, Netanely D, Venger I, et al. (2004) Network analysis of protein structures identifies functional residues. J Mol Biol 344: 1135–1146. [DOI] [PubMed] [Google Scholar]
- 12. Ben-Shimon A, Eisenstein M (2005) Looking at enzymes from the inside out: the proximity of catalytic residues to the molecular centroid can be used for detection of active sites and enzyme-ligand interfaces. J Mol Biol 351: 309–326. [DOI] [PubMed] [Google Scholar]
- 13. Shih CH, Chang CM, Lin YS, Lo WC, Hwang JK (2012) Evolutionary information hidden in a single protein structure. Proteins-Structure Function and Bioinformatics 80: 1647–1657. [DOI] [PubMed] [Google Scholar]
- 14. Chang CM, Huang YW, Shih CH, Hwang JK (2013) On the relationship between the sequence conservation and the packing density profiles of the protein complexes. Proteins-Structure Function and Bioinformatics 81: 1192–1199. [DOI] [PubMed] [Google Scholar]
- 15. Branden C, Tooze J (1999) Introduction to Protein Structure. New York: Garlnd Science. [Google Scholar]
- 16. Huang TT, Marcos MLD, Hwang JK, Echave J (2014) A mechanistic stress model of protein evolution accounts for site-specific evolutionary rates and their relationship with packing density and flexibility. Bmc Evolutionary Biology 14. [DOI] [PMC free article] [PubMed] [Google Scholar]
- 17.Yeh SW, Huang TT, Liu JW, Yu SH, Shih CH, Hwang JK, et al. (2014) Local Packing Density Is the Main Structural Determinant of the Rate of Protein Sequence Evolution at Site Level. Biomed Research International. [DOI] [PMC free article] [PubMed]
- 18. Yeh SW, Liu JW, Yu SH, Shih CH, Hwang JK, Echave J (2014) Site-Specific Structural Constraints on Protein Sequence Evolutionary Divergence: Local Packing Density versus Solvent Exposure. Molecular Biology and Evolution 31: 135–139. 10.1093/molbev/mst178 [DOI] [PubMed] [Google Scholar]
- 19. Creighton TE (1993) Proteins: Structures and Molecular Properties. New York: W. H. Freeman and Company. [Google Scholar]
- 20. Bartlett GJ, Porter CT, Borkakoti N, Thornton JM (2002) Analysis of catalytic residues in enzyme active sites. J Mol Biol 324: 105–121. [DOI] [PubMed] [Google Scholar]
- 21. Huang SW, Yu SH, Shih CH, Guan HW, Huang TT, Hwang JK (2011) On the relationship between catalytic residues and their protein contact number. Curr Protein Pept Sci 12: 574–579. [DOI] [PubMed] [Google Scholar]
- 22. Lin CP, Huang SW, Lai YL, Yen SC, Shih CH, Lu CH, et al. (2008) Deriving protein dynamical properties from weighted protein contact number. Proteins-Structure Function and Bioinformatics 72: 929–935. [DOI] [PubMed] [Google Scholar]
- 23. Yang L, Song G, Jernigan RL (2009) Protein elastic network models and the ranges of cooperativity. Proceedings of the National Academy of Sciences of the United States of America 106: 12347–12352. 10.1073/pnas.0902159106 [DOI] [PMC free article] [PubMed] [Google Scholar]
- 24. Nosrati GR, Houk KN (2012) Using catalytic atom maps to predict the catalytic functions present in enzyme active sites. Biochemistry 51: 7321–7329. 10.1021/bi3008438 [DOI] [PMC free article] [PubMed] [Google Scholar]
- 25. Mayrose I, Graur D, Ben-Tal N, Pupko T (2004) Comparison of site-specific rate-inference methods for protein sequences: empirical Bayesian methods are superior. Mol Biol Evol 21: 1781–1791. [DOI] [PubMed] [Google Scholar]
- 26. Ashkenazy H, Erez E, Martz E, Pupko T, Ben-Tal N ConSurf 2010: calculating evolutionary conservation in sequence and structure of proteins and nucleic acids. Nucleic Acids Res 38: W529–533. 10.1093/nar/gkq399 [DOI] [PMC free article] [PubMed] [Google Scholar]
- 27. Jones DT, Taylor WR, Thornton JM (1992) The rapid generation of mutation data matrices from protein sequences. Comput Appl Biosci 8: 275–282. [DOI] [PubMed] [Google Scholar]
- 28. Carrillo-Tripp M, Shepherd CM, Borelli IA, Venkataraman S, Lander G, Natarajan P, et al. (2009) VIPERdb(2): an enhanced and web API enabled relational database for structural virology. Nucleic Acids Research 37: D436–D442. 10.1093/nar/gkn840 [DOI] [PMC free article] [PubMed] [Google Scholar]
- 29. Govindasamy L, Padron E, McKenna R, Muzyczka N, Kaludov N, Chiorini JA, et al. (2006) Structurally mapping the diverse phenotype of adeno-associated virus serotype 4. J Virol 80: 11556–11570. [DOI] [PMC free article] [PubMed] [Google Scholar]
- 30. Nam HJ, Lane MD, Padron E, Gurda B, McKenna R, Kohlbrenner E, et al. (2007) Structure of adeno-associated virus serotype 8, a gene therapy vector. J Virol 81: 12260–12271. [DOI] [PMC free article] [PubMed] [Google Scholar]
- 31. Grieger JC, Snowdy S, Samulski RJ (2006) Separate basic region motifs within the adeno-associated virus capsid proteins are essential for infectivity and assembly. J Virol 80: 5199–5210. [DOI] [PMC free article] [PubMed] [Google Scholar]
- 32. Sonntag F, Bleker S, Leuchs B, Fischer R, Kleinschmidt JA (2006) Adeno-associated virus type 2 capsids with externalized VP1/VP2 trafficking domains are generated prior to passage through the cytoplasm and are maintained until uncoating occurs in the nucleus. J Virol 80: 11040–11054. [DOI] [PMC free article] [PubMed] [Google Scholar]
- 33. Agbandje M, Kajigaya S, McKenna R, Young NS, Rossmann MG (1994) The structure of human parvovirus B19 at 8 A resolution. Virology 203: 106–115. [DOI] [PubMed] [Google Scholar]
- 34. Hubbard PA, Liang XQ, Schulz H, Kim JJP (2003) The crystal structure and reaction mechanism of Escherichia coli 2,4-dienoyl-CoA reductase. Journal of Biological Chemistry 278: 37553–37560. [DOI] [PubMed] [Google Scholar]
- 35. Johansson F, Toh H A comparative study of conservation and variation scores. BMC Bioinformatics 11: 388 10.1186/1471-2105-11-388 [DOI] [PMC free article] [PubMed] [Google Scholar]
- 36. Johansson F, Toh H (2010) A comparative study of conservation and variation scores. Bmc Bioinformatics 11. [DOI] [PMC free article] [PubMed] [Google Scholar]
- 37. Lu CH, Huang SW, Lai YL, Lin CP, Shih CH, Huang CC, et al. (2008) On the relationship between the protein structure and protein dynamics. Proteins-Structure Function and Bioinformatics 72: 625–634. [DOI] [PubMed] [Google Scholar]
- 38. Shih CH, Huang SW, Yen SC, Lai YL, Yu SH, Hwang JK (2007) A simple way to compute protein dynamics without a mechanical model. Proteins-Structure Function and Bioinformatics 68: 34–38. [DOI] [PubMed] [Google Scholar]
- 39. Lin CP, Huang SW, Lai YL, Yen SC, Shih CH, Lu CH, et al. (2008) Deriving protein dynamical properties from weighted protein contact number. Proteins 72: 929–935. 10.1002/prot.21983 [DOI] [PubMed] [Google Scholar]
- 40. Schultz GE, Schirmer RH (1979) Pinciples of Protein Structure: Springer. [Google Scholar]
- 41. Maguid S, Fernandez-Alberti S, Pariso G, Echave J (2006) Evolutionary Conservation of Protein Backbone Flexibility. J Mol Evol 63: 448–457. [DOI] [PubMed] [Google Scholar]
- 42. Halle B (2002) Flexibility and packing in proteins. Proc Natl Acad Sci U S A 99: 1274–1279. [DOI] [PMC free article] [PubMed] [Google Scholar]
- 43. Halle B (2002) Flexibility and packing in proteins. Proceedings of the National Academy of Sciences of the United States of America 99: 1274–1279. [DOI] [PMC free article] [PubMed] [Google Scholar]
- 44. Warshel A, Sharma PK, Kato M, Xiang Y, Liu H, Olsson MH (2006) Electrostatic basis for enzyme catalysis. Chem Rev 106: 3210–3235. [DOI] [PubMed] [Google Scholar]
- 45. Warshel A, Naray-Szabo G, Sussman F, Hwang JK (1989) How do serine proteases really work? Biochemistry 28: 3629–3637. [DOI] [PubMed] [Google Scholar]
- 46. Warshel A (1978) Energetics of enzyme catalysis. Proc Natl Acad Sci U S A 75: 5250–5254. [DOI] [PMC free article] [PubMed] [Google Scholar]
Associated Data
This section collects any data citations, data availability statements, or supplementary materials included in this article.
Supplementary Materials
The conservation surface representation is shown on the left, the centroid surface representation in the middle, and the WCN surface representation on the right.
(PDF)
Comparison of the radius distribution profile (solid line) and conservation profile (dotted line) (the top plot under the PDB ID) and the WCN profile (solid line) and the conservation profile (dotted line) (the bottom plot under the PDB ID).
(PDF)
(PDF)
Data Availability Statement
All relevant data are within the paper and its Supporting Information files.


