

Abstract
On-column focusing is essential for satisfactory performance using capillary scale columns. On-column focusing results from generating transient conditions at the head of the column that lead to high solute retention. Solvent-based on-column focusing is a well-known approach to achieve this. Temperature-assisted on-column focusing (TASF) can also be effective. TASF improves focusing by cooling a short segment of the column inlet to a temperature that is lower than the column temperature during the injection and then rapidly heating the focusing segment to the match the column temperature. A troublesome feature of an earlier implementation of TASF was the need to leave the capillary column unpacked in that portion of the column inside the fitting connecting it to the injection valve. We have overcome that problem in this work by packing the head of the column with solid silica spheres. In addition, technical improvements to the TASF instrumentation include: selection of a more powerful thermo-electric cooler to create faster temperature changes and electronic control for easy incorporation into conventional capillary instruments. Used in conjunction with solvent-based focusing and with isocratic elution, volumes of paraben samples (esters of p-hydroxybenzoic acid) up to 4.5-times the column liquid volume can be injected without significant bandspreading due to volume overload. Interestingly, the shapes of the peaks from the lowest volume injections that we can make, 30 nL, are improved when using TASF. TASF is very effective at reducing the detrimental effects of precolumn dispersion using isocratic elution. Finally, we show that TASF can be used to focus the neuropeptide galanin in a sample solvent with elution strength stronger than the mobile phase. Here, the stronger solvent is necessitated by the need to prevent peptide adsorption prior to and during analysis.
Keywords: Volume overload, capillary HPLC, on-column focusing, temperature
1. Introduction
When sample volumes are small and quantitative analysis of low-concentration analytes is the goal, it is generally advantageous to use capillary liquid chromatography [1]. The advantage arises from the fact that the use of capillary columns minimizes the dilution of the analytes [2,3]. With a concentration-sensitive detector, concentration detection limits improve as the injected volume of the sample increases or the column diameter decreases up to a point, however volume overload results when the injection volume contribution to observed bandspreading becomes significant [4,5]. This contribution of the injected volume to bandspreading is dependent on the solute retention factor in the sample solvent. If retention is low, injection-related band spreading can be significant. Volume overload effects are lower for highly retained solutes. Thus, injecting aqueous samples onto a reversed phase column can be effective at eliminating volume overload as solutes are retained well while the sample solvent is temporarily acting as the mobile phase. This concentration effect is termed solvent-based on-column focusing and is a simple solution to the volume overload problem [3,6].
Temperature also affects retention. Typically in reversed-phase liquid chromatography retention increases as temperature decreases [7,8]. Thus, as we have recently shown [9], temperature-based on-column solute focusing (TASF) can be used to minimize the volume overload problem. TASF works by maintaining a temperature of a short segment (e.g., 1 cm) at the head of the column well below the rest of the column temperature for the time period during the injection. Following sample loading and analyte focusing due to increased retention, the temperature of the column (focusing) segment is rapidly heated to match the rest of the column. TASF should be most effective with capillary-scale columns because of their low thermal mass and small radius. The former permits rapid temperature changes while the latter is responsible for rapid relaxation of thermal gradients in the column.
Previously, the Greibrokk group exploited sub-ambient column temperatures to focus large-volume samples of retinyl esters, polyolefin based Irganox antioxidants and ceramides onto the head of capillary columns [10–14]. High solute hydrophobicity and poor solubility in water necessitated the use of neat acetonitrile mobile phases. Temperature was left as the only variable to enhance focusing and control elution. They initiated temperature programs (for the entire column) at sub-ambient temperatures, ca. 5 °C, to focus these solutes in samples made in 80–100% acetonitrile. Later Holm et al. developed a column oven with separate hot and cold zones where a capillary column was moved in-space from the cold zone to a hot zone following temperature-assisted online preconcentration of Irganox samples dissolved in acetonitrile [15]. Eghabali et al. also used temperature to enhance detection sensitivity in capillary LC [16]. In this approach a 1 cm long segment of column near the outlet was cooled cryogenically to −20 °C to trap and re-focus specific proteins within defined regions of the chromatogram. Following focusing, boiling water was used to heat the nitrogen gas flowing around the cooled segment to rapidly release focused bands in targeted regions of the chromatogram.
In our previous work [9], we demonstrated that TASF decreases volume overload significantly when the sample is prepared in a liquid with the same composition (chromatographic strength) as the mobile phase. Here, we demonstrate that TASF is also effective in isocratic elution: 1) when the sample solvent is weaker than the mobile phase, and 2) when the sample solvent is stronger than the mobile phase. In the former case, TASF and solvent together dictate the k′ of the solutes during the injection. In the latter case, TASF makes it possible to inject large volumes. Among other technical improvements to the TASF system, we have also automated its control and we demonstrate here its reproducibility in controlling column temperature and focusing for large volume samples.
2. Materials and methods
2.1 Reagents and solutions
Methyl, ethyl, and n-propyl esters of p-hydroxybenzoate (parabens) were purchased from Sigma-Aldrich (St. Louis, MO). Standard solutions of each paraben were prepared by first dissolving in acetonitrile (AN), then diluting to the desired concentration and solvent composition with deionized water (DI). Galanin (1–29) (rat) was obtained from Tocris Bioscience (Ellisville, MO). DI water was from an in-house Milli-Q Synthesis A10 purification system (Billerica, MA) and used without further treatment. Phosphoric acid (HPLC grade) and LC/MS grade acetonitrile were from Fisher Scientific (New Brunswick, NJ). Trifluoracetic acid (HPLC grade) and uracil were also from Sigma-Aldrich.
2.2 van’t Hoff retention studies using commercial columns
2.2.1 Chromatographic instrumentation
A Jasco X-LC system composed of a 3059AS autosampler, dual 3085PU pumps, 3080DG degasser, 3080MX high pressure mixer, CO-2060 thermostated column compartment, 3177UV variable wavelength UV absorbance detector and LC-Net II/ADC from Jasco Inc. (Easton, MD) was used to evaluate the temperature dependence of solute retention. Instrument control and data analysis was achieved using EzChrom Elite software (version 3.2.1, Agilent Technologies, Santa Clara, CA)
2.2.2 Chromatographic conditions
A total of three van’t Hoff retention studies using a commercially available 1 mm I.D. Waters Acquity BEH C18 column (50 mm x 1.0 mm I.D.; 1.7 μm dp; Waters Corp., Millford, MA). were performed for methylparaben, ethylparaben, and propylparaben Solute retention enthalpy values were determined for mobile phases consisting of 70:30, 80:20 and 90:10 (10 mM H3PO4, pH 2.7: AN). Column temperature was varied from 25 to 65 °C in 20 °C steps. Samples of 15 μM uracil and 25 μM of each paraben were made at each mobile phase composition. The injection volume was 1.0 μL, flow rate was 0.1 mL/min, and peaks were detected by absorbance of UV light at 220 and 254 nm. Injections were performed at each temperature in triplicate. Extra column time was determined by replacing the column with a zero dead volume union.
2.3 Second generation TASF instrumentation and chromatographic conditions
2.3.1 Column preparation
Capillary columns used in all TASF experiments were prepared by packing either Acquity BEH C18 or Acquity CSH C18, 1.7 μm particles (Waters) into 100 or 150 μm I.D. fused-silica capillaries from Polymicro Technologies (Phoenix, AZ). Columns were fritted using an electrical arc to sinter 2 μm solid borosilicate spheres (Thermo Scientific, Fremont, CA) into the end of the column blank. Particles were slurried, 65 mg/mL, in isopropanol and sonicated for 20 minutes prior to packing using the downward slurry method. Fritted blanks were placed into an ultrahigh pressure column packing fitting adapted from that previously described [17]. A model DSF-150 pneumatic amplification pump from Haskel (Burbank, CA) was used to pack columns at 20,000 psi for 20 minutes. Acetone was used as the packing solvent. Defined length columns, ca. 4.5–6.5 cm, were packed by controlling the mass of particles loaded into the packing reservoir. The remainder of the capillary blank was packed with 8 μm solid silica spheres (Thermo) for an additional 20 minutes at 20,000 psi. The silica spheres were slurried at a concentration of 100 mg/mL in a mixture of 50:50 (v/v) isopropanol/water.
2.3.2 TASF instrumentation
A 3D rendering of the TASF instrumentation is shown in Fig. 1. A Thermo Scientific Ultimate 3000 RSLCnano high pressure gradient pump (NCS-3500RS, Germering, Germany) was used to deliver mobile phase. System pressure was monitored using an externally mounted pressure transducer (DF2-SS-01-15000, DJ Instruments, Billerica, MA). The outlet of the pressure transducer was connected to a Cheminert injection valve (C72x-669D, VICI Valco, Houston, TX) via a 75 μm x 35 cm fused silica nanoViper capillary (Thermo). A second 75 μm x 65 cm nanoViper capillary, fluidic volume of 2.9 μL, was used as the sample loop. (Note that all injection volumes were dictated by precisely controlling the period of time the injection loop was in the path of the column.) The sample loop was loaded by flow from the Ultimate ternary loading pump and an HP1050 autosampler (Agilent, Waldbronn, Germany). The autosampler injection volume was set to 75 μL and loading pump flow rate was adjusted to ensure that each sample was introduced into the nanoViper injection loop during the previous run. Capillary columns were fitted directly to the injection valve and the column outlet was connected to an Acquity TUV detector fitted with a 10 nL flow cell (Waters). Data acquisition at 25 Hz was achieved via connection of the analog output of the Acquity TUV to the Jasco ADC described in the van’t Hoff studies. Analysis was performed in MATLAB (MathWorks, Natick, MA) using a simple peak finding algorithm to automatically find and measure peak full width at half maximum (FWHM). The MATLAB script used to determine FWHM is provided in section S3 of the Supplemental Information.
Figure 1.

Schematic of instrument used to implement the TASF approach. TEC and resistive heaters are shown in gold and red. A loading pump and an autosampler introduced successive samples into a loop connected to the injection valve. Packed void columns were laid on top of the focusing segment and connected directly to the valve. The outlet of the column was connected to the inlet of the detector flow cell using a Teflon sleeve. The insert shows a top-down view of the injection valve and focusing segment of the column.
Temperature-based focusing was achieved using a 1.0 x 1.0 cm Peltier thermoelectric cooling element (TEC) from Custom Thermoelectric (part number 04801-9G30-34RB, Bishopville, MD). To enhance heat transfer between the TEC and the column a gallium-indium eutectic was used at the interface between the TEC and column. An Agilent E3646A DC power supply was used to drive the TEC. TEC temperature was set manually by adjusting the current delivered by the power supply at fixed potential. A Type T thermocouple (COCO-003, Omega, Stamford, CT) fixed to the surface of the TEC was connected to a National Instruments 9213 16-channel high speed thermocouple input module (Austin, TX). TEC polarity was changed using a simple electronically controlled relay circuit. The TEC was mounted to a custom aluminum, liquid cooled heat sink. A Kryo-Thermostat WK 5 chilled circulator (Lauda-Brinkmann, Delran, NJ) was used to pump an ethylene glycol/water mixture at 1 L/min through the heat sink.
The isothermal section of the column was heated resistively in a manner similar that used previously [18,19]. Briefly, a Love Model 1500 proportional-integral-derivative (PID) controller (Dwyer Instruments, Michigan City, IN) was used to control a Kapton resistive heater (KHLV-103/10-P, Omega). The heater was attached to an aluminum block and an SA1-RTD temperature sensor (Omega) was used to monitor temperature.
Instrument control and acquisition of temperature and pressure profiles was collected at 10 Hz using a simple LabVIEW program (National Instruments) written in-house. The injection valve and TEC polarity were also controlled using LabVIEW via an NI 9403 digital I/O module, pressure and HP1050 autosampler remote start signals were monitored using a NI USB-6008 DAQ.
2.3.3 TASF reproducibility study
To evaluate the instrumental improvements and assess the speed of column temperature and pressure transients, an eighty-five injection sequence was performed. The column was an 8.9 cm-long, 150 μm I.D capillary packed with 1.7 μm Acquity BEH C18 particles in the downstream 6.5 cm. The 2.4 cm segment of the column at the inlet, which is inside the fitting holding it (see Fig. 1) to the injection valve and also includes the space between the valve and edge of the TEC, was packed with 8 μm dp solid silica spheres. We refer to such columns as “packed void” columns. In all subsequent references to column length only the length of the stationary phase is reported; a 2.4 cm packed void segment is assumed. Flow rate was 4.0 μL/min, the mobile phase was 75:25 10 mM H3PO4/AN and the detection wavelength was 254 nm. A focusing time of 35 s was used; T1 and T2 were set to 0 and 65 °C, respectively. Each run was set to 10 minutes (an 11.5 minute total cycle time including time for 1050AS to perform the injection) with the whole experiment lasting 975 minutes.
2.3.4 Injection volume study
To replicate the results of our previous work with the new TASF system a series of ten timed injection volumes in the range of 30 to 750 nL were made in triplicate with and without TASF. The column was an Acquity BEH C18 packed void column, 4.7 cm x 150 μm I.D, 1.7 μm dp. Flow rate was 4.5 μL/min, the mobile phase was 80:20 10 mM H3PO4/AN and the detection wavelength was 254 nm. Column temperature was 70 °C. TASF separations employed focusing temperatures of 5 °C, focusing times of 15 s. Samples were made in mobile phase. Table S2 provides details regarding injection volumes and sample concentrations used.
2.3.5 Solvent- and temperature-focusing injection volume study
The complementary nature of solvent- and temperature-based on-column focusing was demonstrated for injection volumes ranging from 100–2000 nL. Isothermal and TASF injections of uracil, methylparaben, ethylparaben, and propylparaben were made in triplicate with sample compositions of 80:20 (matching the mobile phase) and 95:5 10 mM H3PO4/AN to evaluate the effect of solvent- and temperature-based focusing when both focusing techniques were used together. An Acquity BEH C18 packed void column as described in Section 2.3.3 was used. The fluidic volume of the column, excluding the packed void, was estimated to be 450 nL. The flow rate was 3 μL/min; the mobile phase and detection wavelengths were the same as Section 2.3.4. Column and focusing temperatures were reduced to −5 and 62.5 °C to enhance temperature-based focusing. To accommodate the larger injection volumes the focusing time was increased to 45 s. Table S3 provides details about the injection volumes and sample concentrations used.
2.3.6 TASF applied to increasing the sensitivity for the peptide galanin
Isothermal and TASF separations were performed on samples of 100 nM galanin prepared in 80:20 water/AN. Injection volumes of 500 nL were made onto a packed void Acquity CSH C18 column (6.0 cm x 100 μm I.D., 1.7 μm dp) with the mobile phase composition set to 85:15 0.1% trifluoroacetic acid/AN. Flow rate and detection wavelength were 0.85 μL/min and 214 nm, respectively. Isothermal separations were performed at 65 °C. TASF separations utilized focusing temperatures of −10 °C and focusing times of 40 s.
3. Results and discussion
3.1 Temperature dependence of retention factors
A commercially available Acquity BEH C18 column was used to determine retention factors under the various solvent and temperature conditions used in TASF experiments. Retention factors were corrected for extra-column volume using Eq. S1. Partial molar enthalpies (Table S1) for each solute were determined from the van’t Hoff plots shown in Fig. S3 (Eq. S2), using retention data collected over the 25–65 °C temperature range. Residual plots showed no evidence of significant curvature, thus there was no substantial change in retention enthalpy with temperature. We took advantage of this linearity to extrapolate retention factors to sub-ambient column temperatures.
3.2 TASF instrumentation
We improved the technical capabilities of the TASF system by adding electronic control with data logging, and incorporating the TASF system into the instrument control process of a commercial autosampler. In addition, the physical apparatus is now robust and easily incorporated into a capillary chromatography system. Fig. 1 is a 3D rendering of the arrangement of the valve, column, TEC, resistive heater, pressure transducer, and other related components of the TASF system. The inset panel shows the placement of the TEC and capillary column. The TEC (1.0 cm x 1.0 cm x 1.6 mm, shown in gold) was mounted to a custom aluminum heat sink fit inside a PVC fixture machined to hold the TEC-heat sink assembly and resistive heater for the downstream separation segment of the column. The resistive heater (shown in red) used to heat the separation segment of the column was maintained at constant temperature (T2) throughout the run. The TEC changes the column temperature of the focusing segment from T1 to T2 and back again. It is clear from the inset panel of Fig. 1 that the majority of the thermal mass requiring the temperature change is within the TEC, not the 360 μm O.D. column. Therefore selection of a thin (low thermal mass), high power TEC is desirable for rapid temperature changes from T1 to T2. The TEC is rated at 10.9 W, significantly more powerful than the TEC (6.3 W) used in our previous work [9] and is capable of changing temperatures of the focusing segment by approximately 60–70 °C (T2− T1). The operator can choose actual T1 and T2 values according to the need. For example, to concentrate samples with low retention solutes (at the column temperature and in the sample solvent), a low T1 would be appropriate to increase focusing and decrease volume overload. However, there is an attendant limitation on how high T2 can be when is T1 low. If the desire is for high column temperature, then a higher focusing temperature (T1) can be used, but this is accompanied by the need to inject smaller volumes to avoid volume overload for the lower retention solutes.
To realize the benefits of TASF, solutes must arrive at the cooled trapping segment at the same time. Thus, in our earlier work we advocated leaving the first ca. 2 cm of capillary – the portion located within the injection valve and fittings – unpacked. The same concept was applied in the work of Holm et al. work using temperature-based focusing with Irganox antioxidants [15]. This void introduced a pre-column volume of more than 350 nL for the 150 um I.D. columns used in our work. The void added significantly to pre-column dispersion and introduced a time delay on the order of 5 s to the separation. To address these problems we created so-called “packed void” capillary columns. First, the column blank was packed with stationary phase to the desired length. Then the remainder of the capillary was packed with non-interacting solid silica spheres. The silica spheres do not contribute to retention; they act only to fill up the empty space in front of the column. Packing the void reduces the pre-column volume by roughly 65% to 120 nL. Reduced pre-column volume shortened the time delay, but more importantly the particles significantly reduce pre-column dispersion seen in the absence of temperature- or solvent-based focusing.
To demonstrate the effectiveness of the TASF instrumentation for routine separations and evaluate the speed of column temperature and pressure transients an overnight injection sequence was performed consisting of eighty-five injections. Each run was 10 minutes; cycle time was 11.5 minutes when accounting for the autosampler injection time. The whole sequence lasted just over 16 hours. Fig. 2 shows overlays of focusing temperature and column pressure. The colored overlays correspond to the first TASF separation performed in the sequence. Black temperature and pressure traces represent traces from the last injection. There are no visible changes in the pressure profile and a minimal deviation between the first and last temperature profiles over the course of the sequence. TEC temperature reached 90% of the set value (58.5 °C) in 5.6 s; this corresponds to a temperature gradient of 625 °C/min. Column pressure transients mirrored those for temperature with minimal time lag. This is due to the low thermal mass and high thermal conductivity of fused silica capillaries [20]. We refer interested readers to section S2 for further discussion regarding TASF instrumentation.
Figure 2.
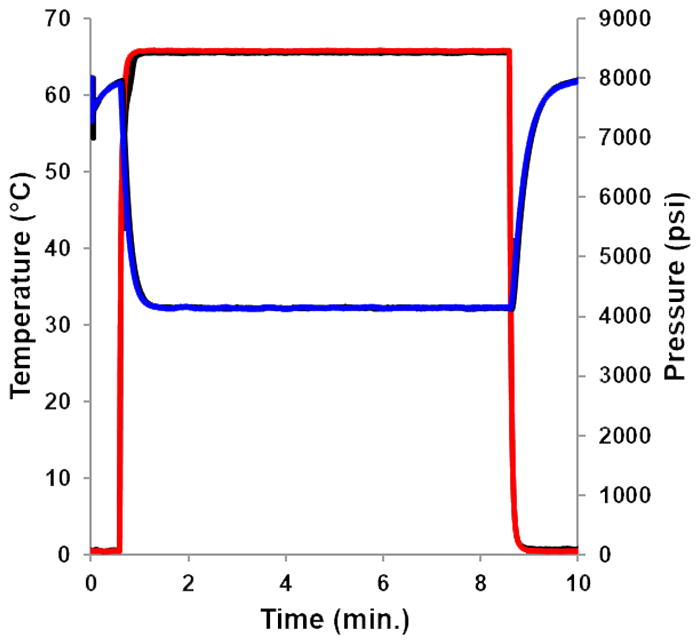
Focusing segment temperature profiles are shown in red (———) and column pressure traces in blue (———) for the first TASF separation performed in the 85 injection sequence. Black traces (———) show temperature and pressure profiles for the last TASF separation in the sequence. Column temperature was 65 °C, focusing temperature was 0 °C; the focusing time was 35 s. For chromatographic conditions see Section 2.3.3.
3.3 Effect of TASF on peak width
Figure S4 (see Supplementary Information) shows representative chromatograms with and without TASF for small (30 nL) and large (750 nL) injections of parabens prepared in mobile phase. Figure S5 shows measured peak width at half height for each solute as a function of injection volume. Solute retention factor dictates how susceptible an analyte is to volume overload. Here, we have chosen solutes and conditions to give a range of 3.0 (methylparaben) < k′ < 17.5 (propylparaben; ethylparaben has a k′ of 7.1) at T2 = 70 °C. The data show that for this range of practically useful isocratic retention factors, TASF alone can be effective. At the 5 °C focusing temperature retention factors for each solute are greater: 11.7, 32.0 and 99.4, respectively. (Retention factors were calculated based on the van’t Hoff studies detailed in Section 3.1. For further details see section S1 for the Supplementary Information.) Under these conditions, TASF is able to limit the increase in FWHM to 5% for injection volumes up to nearly 100% of the column volume (450 nL) for methylparaben and 165% for ethylparaben and propylparaben. These data are similar to our published data [9] confirming, as expected, that technical changes did not alter the essential function of the TASF device.
3.4 Combination of solvent- and temperature-based on-column solute focusing
Fig. 3 shows results from the large-volume injections performed under isothermal and TASF conditions with paraben samples prepared in 80:20 and 95:5 10 mM H3PO4/AN. These experiments were conducted to demonstrate the effectiveness the combination of solvent- and temperature-based on-column focusing can have to limit increases in peak FWHM for sample volumes up to 450% of the column volume. Panels A, B, and C present results for methylparaben, ethylparaben, and propylparaben, respectively. Error bars are the standard error for each measured FWHM, with n = 3.
Figure 3.
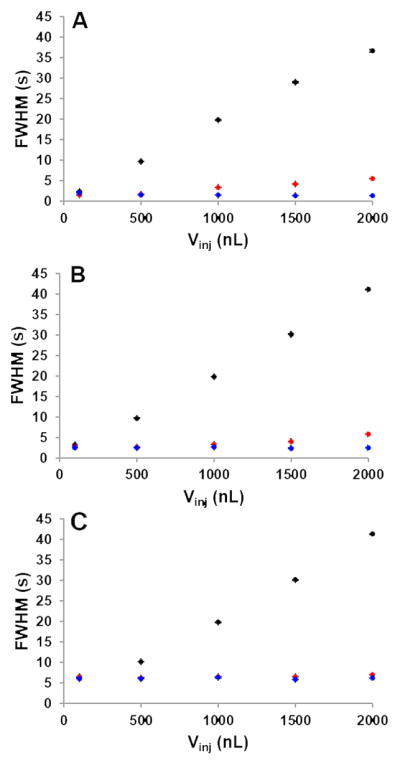
Peak width vs. injection volume for solvent- and temperature-based focusing made under isothermal and TASF conditions. Panels A, B, and C correspond to methylparaben through propylparaben peaks, respectively. Black circles represent isothermal separations with sample made in mobile phase. Red, isothermal with samples in 95:5 phosphate/acetonitrile. TASF separations with samples made in 95:5 phosphate/acetonitrile are in blue. For chromatographic conditions see Section 2.3.5.
The benefits of solvent-based on-column focusing are clearly evident from each panel of Fig. 3. Observed peak width is reduced for every injection volume from 100 nL to 2 μL for each solute. For the 2 μL injections, representing a volume 450% of the column volume, peak width values for methylparaben, ethylparaben and propylparaben were reduced from about 40 s (injection width) when no solvent focusing was present to 5.5, 5.8, and 7.1 s, respectively when injecting samples made in 95:5 phosphate/AN. TASF and solvent focusing together reduced the influence of volume overload significantly. FWHM values for the 2 μL injection with solvent- and temperature-based focusing together were reduced to 1.4, 2.5, and 6.2 s.
Fig. 4 shows an overlay for 2 μL injections under the three conditions described above. The black trace shows the result from injecting the paraben mixture made in mobile phase onto an isothermal column. Clearly, this is unsatisfactory chromatography. The red trace shows the same sample made in 95:5 phosphate/AN. As expected, chromatographic performance improves when using solvent-based focusing. Improvement is due to increased solute retention factors in the sample solvent at the head of the column. Note that injecting a nearly aqueous 2 μL sample onto the column still does not induce enough on-column focusing to generate a Gaussian peak for methylparaben. The ethylparaben peak is also significantly broadened. In principle, a completely aqueous sample would focus more effectively, but not all reversed phase materials perform well with an aqueous mobile phase. Atypical peak shapes may result for large volume aqueous injections. The blue trace shows that TASF augments the on-column focusing from solvent. Using a focusing temperature of −5 °C resulted in peak height increases by factors of 3.4 and 2.2 for methylparaben and ethylparaben relative to the solvent-focusing-only injection. Better and more sensitive chromatography can result from using solvent- and temperature-based focusing together.
Figure 4.
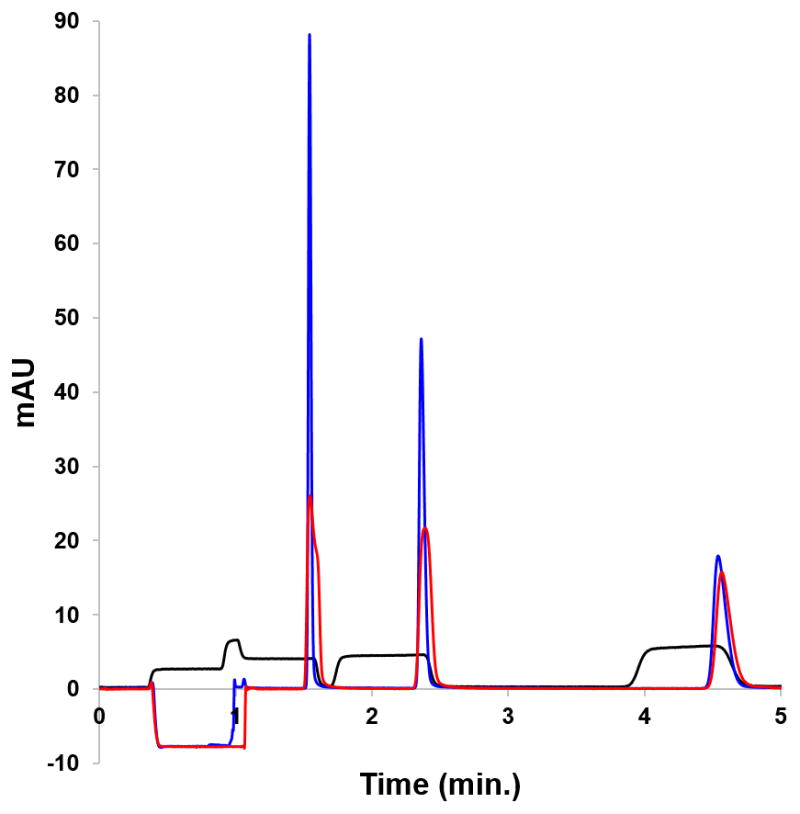
Chromatograms from the solvent- and temperature-based comparison. The injection volume was 2 μL. The isothermal no focusing example (———) was made in mobile phase. The solvent-based focusing example (———) was made in 95:5 10 mM H3PO4/acetonitrile. The TASF/solvent focusing sample was made in 95:5 (———). For chromatographic conditions see Section 2.3.5.
3.4 TASF increases sensitivity for samples made in strong elution solvent
The problem of peptide adsorption to containers and other surfaces during analysis is a serious one [21]. Very frequently, a solution of a peptide prepared in an acidic organic/aqueous mixture yields less adsorption than purely aqueous solvents [21–27]. While adsorption may occur within the LC instrument itself [23], here we are concerned with the stability of the solution prior to injection. Maes et al. [23] found that an acidic water/AN (87:13 v/v) solvent was best for a set of neuropeptides. Earlier, Vatansever et al. noted that acidic AN/water solvents were best for a series of peptides but the optimal concentration of acetonitrile, which was as high as 30%, depended on the peptide [24]. Amyloid peptides are best handled in basic water/AN 80:20 [25,26], while calcitonin is stable in water/AN (43:57). Thus, very often analytical determinations of peptides must be carried out with a sample in a solvent with significant elution strength.
We have an interest in the peptide galanin and the products of its hydrolysis in the extracellular space of hippocampal tissue cultures [28,29]. Our experimental protocol involves the use of electroosmotic flow to perfuse an organotypic hippocampal slice culture with a peptide at high (~300 μM) concentration and variable but low (10 – 25 nL/minute) flow rate. Over a 5-minute sampling time, we collect 50 – 125 nL of the perfusion solution containing peptide and hydrolysis products. This volume is diluted to 10 or 15 μL depending on the application [28–30]. The final concentration of galanin in the injected samples is a few micromolar. Zhou et al. [22] have found that galanin is most stable in an W/AN 80:20 solution. In this example the elution strength of the sample matrix is fixed at this composition and stronger than the 85:15 0.1% TFA/AN mobile phase. In principle, the sample could be diluted with water or an aqueous solution, however the point of using the acetonitrile-based solvent is to avoid losses by adsorption. Thus, dilution with an aqueous solution would be counterproductive.
TASF, on the other hand, should be capable of concentrating the injected peptide despite its relatively high organic content. Fig. 5 shows the results for isothermal (black) and TASF (blue) separations of a 500 nL injection of 100 nM galanin dissolved in 80:20 W/AN onto a 250 nL volume column. Sensitivity is important to our galanin application. Thus we have selected a sample concentration to clearly demonstrate the potential for TASF-induced improvements in preconcentration. The red dashed line in Fig. 6 indicates the detector’s limit of quantitation calculated for an absorbance value required to be a factor of ten greater than the standard deviation of the baseline noise. The isothermal column temperature was 65 °C and the focusing temperature was −10 °C. Clearly, TASF improves preconcentration and detection limits for trace level peptide samples made in strong elution solvents.
Figure 5.

Chromatograms resulting from the application of TASF to increasing analysis sensitivity for the peptide galanin. Galanin samples were made in 80:20 water/acetonitrile and 500 nL samples were injected onto a 250 nL volume column operated with a mobile phase composition of 85:15 0.1% TFA/acetonitrile. Isothermal (———) column temperature was 65 °C. TASF (———). The red dashed line represents the detectors limit of quantitation. With a focusing temperature set to −10 °C peak height increased by a factor of 3 relative to an isothermal analysis. For chromatographic conditions see Section 2.3.6.
4. Conclusions
This work demonstrates the utility of temperature-based on-column solute focusing to improve peak shape in capillary LC. We can draw the following conclusions:
Dispersion and the increase in apparent void time induced by the pre-column void necessary for effective implementation of TASF can be significantly reduced by packing the void with solid non interacting silica spheres.
The TASF system is robust; it can be easily incorporated into a modern automated instrument. It is capable of unattended operation for extend periods.
The combination of TASF with solvent-based focusing is very effective. The two focusing techniques are complementary, improving peak shape and analysis sensitivity for large volume samples.
TASF has the potential to focus large-volume samples made in solvents with elution strength greater than that of the mobile phase.
These results illustrate the potential of temperature to be used as an effective tool to enhance overall separation performance. They clearly demonstrate that TASF can be used independently or in conjunction with solvent-based on-column focusing to enhance analysis sensitivity and separation efficiency in capillary liquid chromatography.
Supplementary Material
Highlights.
Packed void capillary column significantly reduced pre-column dispersion
Effect of solvent- and temperature-based on-column focusing were compared
Combination of solvent and temperature focusing shown effective
Temperature focusing effective when sample elution strength > mobile phase
Acknowledgments
Funding for this work was provided by the National Institutes of Health through grants R01GM044842 and R01MH104386, an Arts & Sciences Fellowship from the Kenneth P. Dietrich School of Arts and Sciences (S.R.G.) and a Graduate Research Fellowship from the National Science Foundation, DGE-1247842 (S.R.G.). We thank Dr. Ed Bouvier and Dr. Moon Chul Jung of Waters Corporation for the generous gift of Acquity columns, packing material and Acquity TUV. We also thank Tom Gasmire, Josh Byler, Jim McNerney, and Joe Rabel from the Dietrich School of Arts and Sciences Machine and Electronics shops for their assistance designing and constructing the TASF instrumentation.
Footnotes
Publisher's Disclaimer: This is a PDF file of an unedited manuscript that has been accepted for publication. As a service to our customers we are providing this early version of the manuscript. The manuscript will undergo copyediting, typesetting, and review of the resulting proof before it is published in its final citable form. Please note that during the production process errors may be discovered which could affect the content, and all legal disclaimers that apply to the journal pertain.
References
- 1.Desmet G, Eeltink S. Fundamentals for LC Miniaturization. Analytical Chemistry. 2013;85:543. doi: 10.1021/ac303317c. [DOI] [PubMed] [Google Scholar]
- 2.Novotny MV, Daidō I. Microcolumn separations columns, instrumentation, and ancillary techniques. Elsevier ; Distributors for the U.S. and Canada, Elsevier Science Pub. Co; Amsterdam; New York; New York: 1985. [Google Scholar]
- 3.Guiochon G, Colin H. Microcolumn high-performance liquid chromatography. Elsevier ; Distributors for the U.S. and Canada, Elsevier Science Pub. Co; Amsterdam ; New York : New York, NY: 1984. [Google Scholar]
- 4.Colin H, Martin M, Guiochon G. Extra-column effects in high-performance liquid chromatography. Journal of Chromatography A. 1979;185:79. [Google Scholar]
- 5.Bakalyar SR, Phipps C, Spruce B, Olsen K. Choosing sample volume to achieve maximum detection sensitivity and resolution with high-performance liquid chromatography columns of 1.0, 2.1 and 4.6 mm I.D. Journal of Chromatography A. 1997;762:167. doi: 10.1016/s0021-9673(96)00851-5. [DOI] [PubMed] [Google Scholar]
- 6.Mills MJ, Maltas J, John Lough W. Assessment of injection volume limits when using on-column focusing with microbore liquid chromatography. Journal of Chromatography A. 1997;759:1. [Google Scholar]
- 7.Teutenberg T. High-temperature liquid chromatography: a user’s guide for method development. RSC Pub; Cambridge: 2010. [Google Scholar]
- 8.Snyder LR, Kirkland JJ, Dolan JW. Introduction to Modern Liquid Chromatography. Wiley; Hoboken, N.J: 2010. [Google Scholar]
- 9.Groskreutz SR, Weber SG. Temperature-assisted on-column solute focusing: A general method to reduce pre-column dispersion in capillary high performance liquid chromatography. Journal of Chromatography A. 2014;1354:65. doi: 10.1016/j.chroma.2014.05.056. [DOI] [PMC free article] [PubMed] [Google Scholar]
- 10.Larsen Å, Molander P. Temperature optimization for improved determination of phosphatidylserine species by micro liquid chromatography with electrospray tandem mass spectrometric detection. Journal of Separation Science. 2004;27:297. doi: 10.1002/jssc.200301706. [DOI] [PubMed] [Google Scholar]
- 11.Molander P, Haugland K, Hegna DR, Ommundsen E, Lundanes E, Greibrokk T. Determination of low levels of an antioxidant in polyolefins by large-volume injection temperature-programmed packed capillary liquid chromatography. Journal of Chromatography A. 1999;864:103. doi: 10.1016/s0021-9673(99)01006-7. [DOI] [PubMed] [Google Scholar]
- 12.Molander P, Holm A, Lundanes E, Greibrokk T, Ommundsen E. Separation of Ceramides by Sub-Ambient Temperature-Assisted Large Volume Injection in Temperature-Programmed Packed Capillary Liquid Chromatography. Journal of High Resolution Chromatography. 2000;23:653. [Google Scholar]
- 13.Molander P, Holm A, Lundanes E, Hegna DR, Ommundsen E, Greibrokk T. Temperature-promoted large-volume solute enrichment in column-switching miniaturized liquid chromatography: Determination of an antioxidant. The Analyst. 2002;127:892. doi: 10.1039/b201651f. [DOI] [PubMed] [Google Scholar]
- 14.Molander P, Thommesen SJ, Bruheim IA, Trones R, Greibrokk T, Lundanes E, Gundersen TE. Temperature-Programmed Packed Capillary Liquid Chromatography Separation with Large Volume On-Column Focusing of Retinyl Esters. Journal of High Resolution Chromatography. 1999;22:490. [Google Scholar]
- 15.Holm A, Molander P, Lundanes E, Greibrokk T. Novel column oven concept for cold spot large volume sample enrichment in high throughput temperature gradient capillary liquid chromatography. Journal of Separation Science. 2003;26:1147. [Google Scholar]
- 16.Eghbali H, Sandra K, Tienpont B, Eeltink S, Sandra P, Desmet G. Exploring the Possibilities of Cryogenic Cooling in Liquid Chromatography for Biological Applications: A Proof of Principle. Analytical Chemistry. 2012;84:2031. doi: 10.1021/ac203252u. [DOI] [PubMed] [Google Scholar]
- 17.Patel KD, Jerkovich AD, Link JC, Jorgenson JW. In-Depth Characterization of Slurry Packed Capillary Columns with 1.0-μm Nonporous Particles Using Reversed-Phase Isocratic Ultrahigh-Pressure Liquid Chromatography. Analytical Chemistry. 2004;76:5777. doi: 10.1021/ac049756x. [DOI] [PubMed] [Google Scholar]
- 18.Zhang J, Liu Y, Jaquins-Gerstl A, Shu Z, Michael AC, Weber SG. Optimization for speed and sensitivity in capillary high performance liquid chromatography. The importance of column diameter in online monitoring of serotonin by microdialysis. Journal of Chromatography A. 2012;1251:54. doi: 10.1016/j.chroma.2012.06.002. [DOI] [PMC free article] [PubMed] [Google Scholar]
- 19.Zhang J, Jaquins-Gerstl A, Nesbitt KM, Rutan SC, Michael AC, Weber SG. In Vivo Monitoring of Serotonin in the Striatum of Freely Moving Rats with One Minute Temporal Resolution by Online Microdialysis–Capillary High-Performance Liquid Chromatography at Elevated Temperature and Pressure. Analytical Chemistry. 2013;85:9889. doi: 10.1021/ac4023605. [DOI] [PMC free article] [PubMed] [Google Scholar]
- 20.Verstraeten M, Pursch M, Eckerle P, Luong J, Desmet G. Modelling the thermal behaviour of the Low-Thermal Mass Liquid Chromatography system. Journal of Chromatography A. 2011;1218:2252. doi: 10.1016/j.chroma.2011.02.023. [DOI] [PubMed] [Google Scholar]
- 21.Maes K, Smolders I, Michotte Y, Van Eeckhaut A. Strategies to reduce aspecific adsorption of peptides and proteins in liquid chromatography–mass spectrometry based bioanalyses: An overview. Journal of Chromatography A. 2014;1358:1. doi: 10.1016/j.chroma.2014.06.072. [DOI] [PubMed] [Google Scholar]
- 22.Zhou Y, Kennedy RT. Capillary Liquid Chromatography-Mass Spectrometry Detection of Trace Level Neuropeptides. 41st International Symposium on High Performance Liquid Phase Separations and Related Techniques; 2014. [Google Scholar]
- 23.Maes K, Van Liefferinge J, Viaene J, Van Schoors J, Van Wanseele Y, Béchade G, Chambers EE, Morren H, Michotte Y, Heyden YV, Claereboudt J, Smolders I, Van Eeckhaut A. Improved sensitivity of the nano ultra-high performance liquid chromatography-tandem mass spectrometric analysis of low-concentrated neuropeptides by reducing aspecific adsorption and optimizing the injection solvent. Journal of Chromatography A. 2014 doi: 10.1016/j.chroma.2014.07.086. [DOI] [PubMed] [Google Scholar]
- 24.Vatansever B, Lahrichi SL, Thiocone A, Salluce N, Mathieu M, Grouzmann E, Rochat B. Comparison between a linear ion trap and a triple quadruple MS in the sensitive detection of large peptides at femtomole amounts on column. Journal of Separation Science. 2010;33:2478. doi: 10.1002/jssc.201000157. [DOI] [PubMed] [Google Scholar]
- 25.Dillen L, Cools W, Vereyken L, Timmerman P. A screening UHPLC–MS/MS method for the analysis of amyloid peptides in cerebrospinal fluid of preclinical species. Bioanalysis. 2011;3:45. doi: 10.4155/bio.10.163. [DOI] [PubMed] [Google Scholar]
- 26.Oe T, Ackermann BL, Inoue K, Berna MJ, Garner CO, Gelfanova V, Dean RA, Siemers ER, Holtzman DM, Farlow MR, Blair IA. Quantitative analysis of amyloidβ peptides in cerebrospinal fluid of Alzheimer’s disease patients by immunoaffinity purification and stable isotope dilution liquid chromatography/negative electrospray ionization tandem mass spectrometry. Rapid Communications in Mass Spectrometry. 2006;20:3723. doi: 10.1002/rcm.2787. [DOI] [PubMed] [Google Scholar]
- 27.Suelter CH, DeLuca M. How to prevent losses of protein by adsorption to glass and plastic. Analytical Biochemistry. 1983;135:112. doi: 10.1016/0003-2697(83)90738-8. [DOI] [PubMed] [Google Scholar]
- 28.Rupert AE. Dissertation. Department of Chemistry, University of Pittsburgh; 2012. p. 132. [Google Scholar]
- 29.Rupert AE, Ou Y, Sandberg M, Weber SG. Electroosmotic Push–Pull Perfusion: Description and Application to Qualitative Analysis of the Hydrolysis of Exogenous Galanin in Organotypic Hippocampal Slice Cultures. ACS Chemical Neuroscience. 2013;4:838. doi: 10.1021/cn400082d. [DOI] [PMC free article] [PubMed] [Google Scholar]
- 30.Ou Y, Wu J, Sandberg M, Weber SG. Electroosmotic perfusion of tissue: sampling the extracellular space and quantitative assessment of membrane-bound enzyme activity in organotypic hippocampal slice cultures. Analytical and Bioanalytical Chemistry. 2014;406:6455. doi: 10.1007/s00216-014-8067-2. [DOI] [PMC free article] [PubMed] [Google Scholar]
Associated Data
This section collects any data citations, data availability statements, or supplementary materials included in this article.