

ABSTRACT
Phenotypic variability among bacteria depends on gene expression in response to different environments, and it also reflects differences in genomic structure. In this study, we analyzed transcriptome sequencing (RNA-seq) profiles of 151 Pseudomonas aeruginosa clinical isolates under standard laboratory conditions and of one P. aeruginosa type strain under 14 different environmental conditions. Our approach allowed dissection of the impact of the genetic background versus environmental cues on P. aeruginosa gene expression profiles and revealed that phenotypic variation was larger in response to changing environments than between genomically different isolates. We demonstrate that mutations within the global regulator LasR affect more than one trait (pleiotropy) and that the interaction between mutations (epistasis) shapes the P. aeruginosa phenotypic plasticity landscape. Because of pleiotropic and epistatic effects, average genotype and phenotype measures appeared to be uncorrelated in P. aeruginosa.
IMPORTANCE
This work links experimental data of unprecedented complexity with evolution theory and delineates the transcriptional landscape of the opportunistic pathogen Pseudomonas aeruginosa. We found that gene expression profiles are most strongly influenced by environmental cues, while at the same time the transcriptional profiles were also shaped considerably by genetic variation within global regulators. The comprehensive set of transcriptomic and genomic data of more than 150 clinical P. aeruginosa isolates will be made publically accessible to all researchers via a dedicated web interface. Both Pseudomonas specialists interested in expression and regulation of specific genes and researchers from other fields with more global interest in the phenotypic and genotypic variation of this important model species can access all information on various levels of detail.
INTRODUCTION
One of the key traits of living organisms is the ability to maintain a dynamic equilibrium of metabolism even in changing environments (1). Bacterial populations can respond phenotypically by environment-driven flexible changes in the transcriptional profiles (phenotypic plasticity) and adapt to selective pressures through the process of evolution (evolutionary adaptation) to benefit in distinct habitats (2).
Recent technological advances in acquiring genome-wide data have led to substantial progress in identifying the genomic sequence of a plethora of bacterial pathogens. These genomes are shaped by evolutionary processes and encode optimized gene expression-based systems that guarantee phenotypic plasticity (3, 4). However, only knowledge on the dynamic expression of interacting gene regulatory networks will lead to a more comprehensive understanding of the biology underlying complex bacterial adaptation mechanisms and the expression of virulence traits (5).
Pseudomonas aeruginosa is a ubiquitous Gram-negative bacterium that is capable of surviving in a broad range of natural environments (6, 7). Furthermore, it is an important opportunistic bacterial pathogen and a causative agent of severe acute infections and chronic infections that are often associated with biofilms (8, 9). The reason for this remarkable ecological success can be attributed to its large metabolic versatility and flexibility (7). Global regulators and signaling systems are highly abundant in the P. aeruginosa genome (10, 11) and form a complex and dynamic regulatory network responsible for phenotypic plasticity and the expression of virulence genes (12–14).
The finding that the distribution of various P. aeruginosa clones found in the clinic largely match those found in environmental habitats (15–17) suggests that all or most members of the P. aeruginosa species are equipped with optimized regulatory mechanisms that guarantee bacterial survival in diverse environments, including the human host. Nevertheless, nosocomial transmission can increase the prevalence of distinct clones in P. aeruginosa-positive patients at a particular center, and there might be subspecies variants of P. aeruginosa that are particularly adapted and benefit in the clinical setting.
Here, we aimed at exploring the transcriptional landscape of the opportunistic pathogen P. aeruginosa. By analyzing strand-specific RNA sequences of 151 clinical P. aeruginosa isolates, we gained profound insights into the variation of transcription patterns across genomically heterogeneous lineages. Furthermore, we analyzed the transcriptome of the P. aeruginosa type strain PA14 that has been recorded under a plethora of different environmental conditions (18–21), including conditions encountered within the eukaryotic host. The transcriptional states were affected considerably by environmental cues, and almost the entire genome of P. aeruginosa PA14 was transcriptionally active at least under certain conditions. As opposed to this significant phenotypic plasticity, the variation in gene expression profiles was much smaller among the transcriptomes of the 151 clinical P. aeruginosa isolates cultivated under one environmental condition. Furthermore, we found only a weak correlation between genomic similarity and expression profiles; instead, the expression profiles were shaped by a few genetic variations within global regulators.
RESULTS
Global survey of P. aeruginosa gene expression profiles.
With the aim to delineate the P. aeruginosa transcriptional landscape, we analyzed strand-specific single-nucleotide-resolution mRNA sequence data that have been recorded on 151 clinical P. aeruginosa isolates (22) (genome data set; available in the SRA database under accession numbers SRP034661 and SRP036144) and the transcriptomes of the P. aeruginosa type strain PA14 grown under 14 different conditions (environment data set), including conditions encountered within the eukaryotic host (18–21) (the environment data set is accessible in the GEO database under accession number GSE55197).
The distribution of normalized gene expression for all transcribed regions, following mapping to the P. aeruginosa PA14 reference genome, was continuous and unimodal in both data sets (histograms in Fig. 1). Overall, between 24 and 46% of the genes within one transcriptome showed an average level of expression below the sensitivity limit (as defined in Materials and Methods); however, most of these genes were found to be actively expressed at least in some isolates or under some culture condition(s) (Fig. 1). Only 243 genes in the clinical data set and 82 genes in the environment data set never exceeded the sensitivity limit (red dots in Fig. 1). These results indicate that almost the entire genome of P. aeruginosa is transcriptionally active at least under certain conditions. On the other end of the scale, 1,488 genes in the clinical data set and 2,139 genes in the environment data set were found to be transcriptionally active above the sensitivity limit in all transcriptomes within a data set. Next, we recorded the 25% most highly expressed genes for every transcriptome and assigned them to functional classes. Among the transcriptomes of the 151 clinical isolates, a common set of 430 genes was always expressed at high levels. This set included many genes involved in central cellular processes like transcription, translation, and cell division. In the environment data set, the core set of highly active genes was smaller, but still 356 genes were always found among the 25% most active ones. Overall, 261 genes were highly expressed in all isolates and under all culture conditions (see Table S1 in the supplemental material).
FIG 1 .
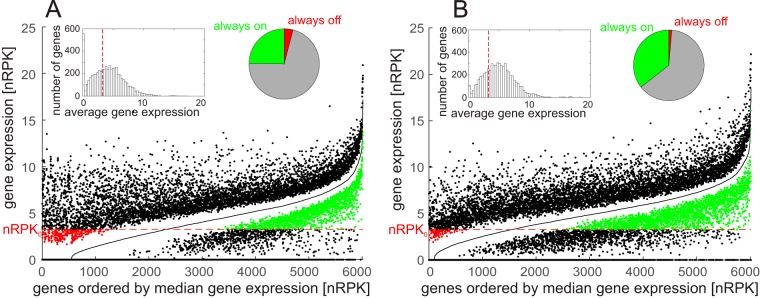
Distribution of transcriptional activity throughout all samples. (A and B) The genes were ordered from left to right by their median gene expression (black line) for the genome data set (A) and environment data set (B). Dots above and below the median indicate the observed maximum and minimum gene expression for a particular gene. Red dots indicate the genes that were always below the sensitivity limit (red dotted line; nRPK0 = 3.26), and green dots indicate the genes that were always above the sensitivity limit. Inserts show the histogram of gene expression (nRPK values) for all genes annotated in reference strain PA14 and a pie chart indicating the fractions of genes that are always above (always on) and always below (always off) the nRPK0 limit.
Next, we compared the impact of environmental conditions and genomic background on global gene expression patterns. The transcriptional profiles were compared pairwise within the 151 clinical isolates and within the 51 samples of the reference strain PA14 grown in 14 different environmental conditions to determine the differential gene expression. Altogether, 1,121 genes were found to exhibit highly variable gene expression with 25% of all gene expression comparisons exhibiting a differential larger than 4 (75th percentile of fold changes, FC75 > 4) either in the genome or environment data set of samples (see Table S2 in the supplemental material). The number of such genes with highly variable expression profiles was larger (796 genes) among the PA14 samples in different culture conditions than in the clinical data set (592 genes). A total of 267 genes exhibited a FC75 of >4 in both data sets. Figure 2 visualizes the transcriptional variation in the genome data set and environment data set. Despite the heterogeneous origin of the clinical isolates, the overall pattern of transcriptional activity in the genome data set was more uniform, whereas changes in the environment had a substantial impact on the transcriptional profile of the P. aeruginosa type strain PA14.
FIG 2 .

Global comparison of transcriptional activity. (A) Principal component analysis of the combined data set, including the 151 clinical isolates (genome data set) and the 51 samples of strain PA14 under 14 different environmental conditions (environment data set). The analysis was based on the expression of the 1,121 genes that showed highly variable expression in at least one of the two data sets. The first three principal components (PC1 to PC3) displayed account for ~47% of the total variance of the data. The environmental conditions used for cultivation were as follows: late exponential phase (late exp.), exponential growth phase (exp.), stationary growth phase (stat.), heat shock at 42°C or 50°C, low osmolarity (osmol.), iron deficiency (iron def.), 24-h-old static biofilm (BF 24h), 48-h-old biofilm (BF 48h), attached cells (attach), nonattached population in attachment experiment (att. cont), anoxic cultivation, minimal phosphate concentration (low P), and mouse tumor infection model (ex vivo). (B) Hierarchical clustering of the combined data set, including both the genome and environment data sets. Branches representing samples of the environment data set are drawn in red with thick black lines. The colored boxes in panel B correspond to the colors used in panel A and reflect the different culture conditions. Clinical isolates are indicated by white boxes with gray outlines.
Figure 3 illustrates the assignment of the differentially regulated genes to different functional categories. The functional class of secreted factors showed the highest fraction of highly variably expressed genes both in the clinical isolates (variably expressed in 52% of the isolates) and in the PA14 samples (variably expressed in 51% of the environmental conditions), including virulence-related genes involved in the synthesis of phenazines and effectors of type III secretion. Genes that are related to mobile genetic elements (functional class PhaTraPla [related to phage, transposon, plasmid]) or involved in antibiotic resistance (class ABresist [antibiotic resistance and susceptibility]) showed substantially higher variability in the clinical isolates (Fig. 3), which may reflect the effect of evolutionary adaptation to specific habitats, rather than a phenotypic response. In contrast, noncoding RNA genes (ncRNA) and genes classified as functional class adaptation and protection (AdptProt) and functional class chaperones and heat shock proteins (ChapHsp) were much more variable under different culture conditions and showed much less variation in the clinical isolates.
FIG 3 .
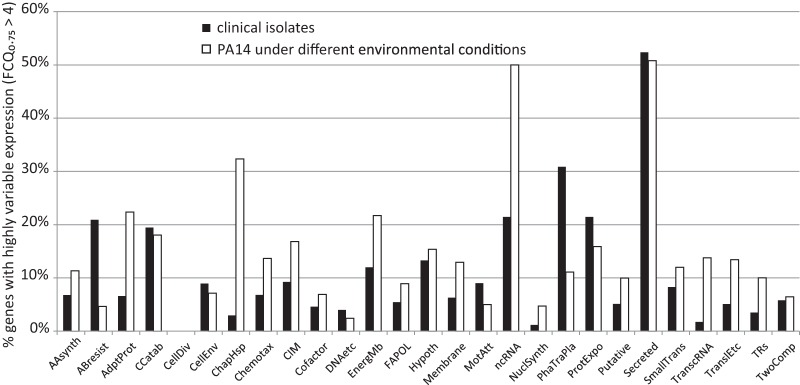
Assignment of genes that varied among the transcriptomes to different functional categories. Bars indicate the percentage of genes that exhibited highly variable gene expression (FC75 of >4) within each functional category. Values for the genome data set of 151 clinical isolates and values for the environment data set of reference strain PA14 samples grown under 14 different culture conditions are shown. Functional categories were assigned according to the annotation for strain PA14 available from the Pseudomonas genome database (43, 44). The PseudoCAP functional classes are abbreviated as follows: AAsynth, amino acid biosynthesis and metabolism; ABresist, antibiotic resistance and susceptibility; AdptProt, adaptation and protection; CCatab, carbon compound catabolism; CellDiv, cell division; CellEnv, Cell wall/lipopolysaccharide (LPS)/capsule; ChapHsp, chaperones and heat shock proteins; Chemotax, chemotaxis; CIM, central intermediary metabolism; Cofactor, biosynthesis of cofactors, prosthetic groups, and carriers; DNAetc, DNA replication, recombination, modification, and repair; EnergMb, energy metabolism; FAPOL, fatty acid and phospholipid metabolism; Hypoth, hypothetical, unclassified, and unknown; membrane, membrane proteins; MotAtt, motility and attachment; ncRNA, noncoding RNA (rRNA and tRNA were excluded in this study); NuclSynth, nucleotide biosynthesis and metabolism; PhaTraPla, related to phage, transposon, or plasmid; ProtExpo, protein secretion/export apparatus; Putative, putative enzymes; Secreted, secreted factors (toxins, enzymes, alginate); SmallTrans, transport of small molecules; TranscRNA, transcription, RNA processing and degradation; TranslEtc, translation, posttranslational modification, degradation; TRs, transcriptional regulators; TwoComp, two-component regulatory systems.
Genotypic component of phenotypic variation.
Since all clinical isolates were cultivated under identical growth conditions, any differential in gene expression between the clinical isolates can be assumed to be caused by differences in the genetic background and thus reflects the genotypic component of phenotypic variability within the P. aeruginosa species. We calculated the phenotypic distance between isolates based on Pearson correlations and constructed a phenotypic tree showing a representation of all isolates clustered by their phenotype (Fig. 4A). In order to compare phenotypic and genotypic similarity, we also constructed a dendrogram reflecting genotypic relatedness based on the occurrence of oligonucleotide sequences (k-mers; Fig. 4A). One can observe several smaller subclusters that correspond in both dendrograms, but no global correlation between genomic similarity and transcriptional profiles. Even distantly related P. aeruginosa isolates exhibited gene expression profiles that were as similar as the transcriptional profiles of more closely related isolates. A direct comparison of phenotypic and genotypic distances (Fig. 4B) confirms that phenotypic distance is on average independent of the genotypic distance beyond genotypically highly similar strains (coefficient of correlation [r] = 0.08, P > 0.05, simple Mantel test). Notably, quite distinct transcriptional profiles were also recorded for many closely related isolates, and the reduced average phenotypic distance was caused mainly by some of the clusters (Fig. 4A and B). This suggests that independent of the genetic background, any strain may adopt a distinct transcriptional profile and that the transcriptional landscape seems to be shaped considerably by only a few genetic variations.
FIG 4 .

Comparison of the genomic and phenotypic tree. (A) Correlation matrix comparing gene expression profiles (the phenotype) and the genotypic relatedness of the clinical isolates. Each square reflects the position of an individual isolate on the two axes. The horizontal dimension represents the genomic relatedness calculated by a hierarchical clustering of the similarity of k-mer profiles of each isolate’s RNA-seq data. The vertical dimension represents the hierarchical clustering of gene expression data based on normalized expression of the 592 genes that were classified as highly variable (FC75 of >4) in the data set of clinical isolates. Clusters of similar expression profiles (a to d) are indicated by colored subtrees within the dendrogram. Clinical isolates that harbor a loss-of-function mutation in lasR are marked with red squares in the matrix and by red bars alongside the two axes. The seven isolates that were included in an in-depth analysis of the genotype as shown in Fig. 5B are marked by green symbols. (B) The phenotypic distance is calculated as the Pearson correlation distance between the normalized expression profiles of the 592 genes that were classified as highly variable (FC75 of >4) in the genome data set. Genomic distance is the difference in the k-mer profiles of each isolate’s RNA-seq data. Each dot represents a pairwise comparison between two transcriptomic profiles. The orange dashed line represents the fit of a saturation function (analogous to Michaelis-Menten and Monod-type kinetics) to represent the approximate average phenotypic distance in response to genotypic distance. (C) Boxplots showing the phenotypic distances of all pairwise comparisons in the genome and environment data sets. The difference between the two distributions is highly significant (P < 10−200 by Mann-Whitney U test).
Environmental component of phenotypic variation.
The environment data set consists of transcriptomes of the PA14 type strain that were recorded under different culture conditions and thus reflects the pattern of phenotypic expression variation of a single genotype across a range of environments (reaction norm). Although the environment data set is smaller than the genome data set (51 instead of 151 transcriptomes), the median phenotypic distance was larger in the environment data set (Fig. 4C). This is also reflected in the combined data set, where most of the clinical isolates form a cluster that is distinct from the more diverse environment samples (Fig. 2). The only samples of the PA14 strain that clustered phenotypically within the clinical isolates were those grown in exponential or late exponential growth phase and under low-osmolarity conditions. The growth conditions for the clinical isolates were identical to those of the late exponential cultures and the difference to the exponential cultures was merely the time point at which RNA was isolated. The clinical isolates are phenotypically intermediate between exponential and late exponential cultures, which may be due to a different “timing” of their growth phase regulation. Further deviations in the environmental conditions mostly resulted in distinct transcriptional profiles (Fig. 2).
Inactivation mutations within lasR are frequent and considerably alter the transcriptional profile.
On a global level, the dendrograms of transcriptional profiles can be subdivided into four large clusters of similar phenotypes (clusters a to d in Fig. 4A). We performed a more in-depth analysis of a group of seven clinical isolates (highlighted by green symbols in Fig. 4A) which formed a distinct genotypic cluster within the k-mer dendrogram due to their high genomic similarity but showed large differences in their transcriptional profiles. Two of the isolates grouped with phenotypic cluster a (hexagons in Fig. 4A), while five highly similar isolates belonged to cluster b (squares). We next searched for an enrichment of group-specific sequence variations in isolates grouping with cluster a (2 isolates) and b (five isolates). Interestingly, we found that whereas the lasR gene, which encodes a global transcriptional regulator (LasR), was intact in the two isolates grouping with cluster a, an identical inactivating deletion within the lasR gene was present in the other five isolates. To test whether this mutation is responsible for the observed transition of the transcriptional profiles from cluster b to cluster a, we complemented two isolates of the subgroup harboring the lasR mutation with the PA14 wild-type lasR gene and recorded the transcriptional profiles of the complemented strains. As depicted in Fig. 5, the transcriptional profiles of the complemented strains now grouped with those of the strains of the subgroup harboring the wild-type lasR allele.
FIG 5 .
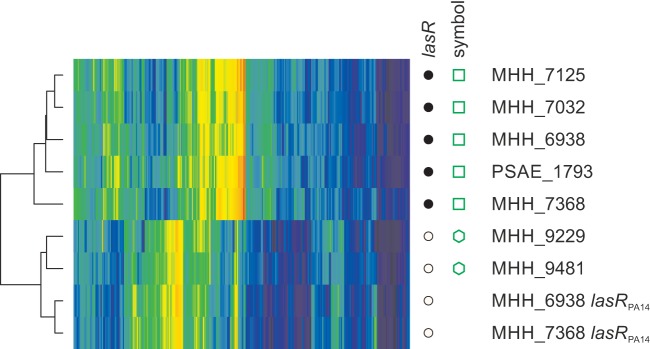
Pleiotropic effects of a mutation in the lasR gene. Heatmap of the gene expression profiles of the clonal subgroup of isolates selected for further analysis. Only the 592 genes classified as highly variable (FC75 of >4) in the data set of clinical isolates were used to create the heatmap. The lasR genotype of each of the isolates and the two complemented strains (labeled “lasRPA14”) is indicated by white (wild type) or black (17-bp deletion) circles in the lasR column. Green symbols in the symbol column indicate different subclusters within this group of isolates as defined by their location in the genomic/phenotypic correlation matrix (Fig. 4A).
These results indicate that the differences in the transcriptional profiles between the two subgroups of the phylogenetically related isolates can be almost exclusively explained by the mutation in lasR in the one subgroup that is absent in the other. Nevertheless, despite this dominant effect of an inactivating mutation in lasR on the transcriptional profile in this particular strain background, not all strains that exhibited a similar transcriptional profile harbored a mutation in lasR (cluster b in Fig. 4A). Conversely, we found LasR inactivating mutations very frequently (indels and/or stop codons in 48 of the 151 P. aeruginosa isolates [indicated in red in Fig. 4A]) not only in cluster b but also in clusters a and c, but strikingly never in cluster d.
A comparison of the transcriptional profiles between cluster d and clusters a, b, and c revealed a lower expression of many genes that are known to be under LasR control (including, e.g., lasA, lasB, pqsABCDE, and rhlR) in the clusters with defective LasR.
Apparently, a large fraction of the clinical P. aeruginosa isolates included in this study harbor LasR-inactivating mutations (indicated in red in Fig. 4A) and consequently exhibit a LasR-negative phenotype. In addition, many isolates were found to have similar transcriptional profiles, thus clustering closely with the LasR-defective isolates despite harboring no LasR-inactivating mutations (although the possibility that there are single nucleotide polymorphisms [SNPs] that impact on the functionality of LasR in this subgroup cannot be excluded). This indicates that other (downstream) mutations within clusters a, b, and c might mimic the LasR-negative phenotype, although our search for additional mutations that are specifically enriched in cluster b was not successful.
DISCUSSION
Phenotypic plasticity allows living organisms to react at least to some extent to changes in their environment by adjusting their metabolism through specific regulation of gene expression. Such phenotypic plasticity might be favored either by natural selection in changing environments or reduced by the fixation of genetic variants that contribute to adaptive phenotypes if conditions remain constant for a prolonged time period. This process has been analyzed in detail in long-term experiments of in vitro evolution of Escherichia coli for example and led to the identification of parallel changes in gene expression profiles (3, 23, 24).
The opportunistic pathogen P. aeruginosa is commonly described as highly versatile, because it is able to thrive in a great variety of different habitats, including host organisms all across the tree of life (6, 25). This versatility is usually traced back to its large genomic potential with more than 5,000 genes and a high regulatory complexity reflected by the large proportion of transcriptional regulators and two-component regulatory systems that represent about 10% of the genome (10). P. aeruginosa seems to be a generalist organism that sustains the ability to survive in a large variety of habitats. Its range of environments encompasses a broad range of phenotypes that are governed by a complex regulatory network with a modular structure with each module controlling specific phenotypic traits in response to environmental stimuli (21).
Such phenotypic plasticity can be enhanced and greatly facilitated via genome expansion by acquisition of mobile genomic elements (11, 26, 27); however, longitudinal studies on the genomes of P. aeruginosa isolates originating from the chronically infected lung of patients with cystic fibrosis (CF) also highlighted the importance of specific mutations in global regulatory elements in the adaptation process (28–30).
Here, a broad cross-sectional study based on the transcriptomes of 151 clinical isolates enabled a comprehensive analysis of the genotypic dimension of phenotypic variation. The (transcriptional) phenotypes of the 151 isolates varied substantially, but the isolates still formed clusters in the global comparison of both data sets (Fig. 2) and showed a lower median phenotypic distance compared to the transcriptional profiles of one P. aeruginosa genotype (PA14) in response to different environmental conditions (Fig. 4C). It has been reported that the overall genome-wide SNP ratio is in the range of 1 order of magnitude lower in P. aeruginosa than the ratio reported for other bacterial organisms such as Escherichia coli (30–32), which was also confirmed by the sequence data obtained from the clinical isolates in this study (data not shown). This underpins that survival of P. aeruginosa in diverse habitats is mainly achieved by phenotypic variability rather than via adaptive mutations.
In general, the correlation between genomic background and transcriptional phenotype was low. We observed that even between highly similar genotypes, the divergence of the transcriptional phenotype was substantial, while some completely unrelated genotypes exhibited strikingly similar phenotypes. This pattern strongly supports the idea of pleiotropic and epistatic effects. If the phenotype (the gene expression profile) is under control of a few master regulators, where mutations result in phenotypic changes in many traits (pleiotropy), average genotype and phenotype measures can be uncorrelated, since what matters is not the average genotype but the sequence of those few loci. Thus, groups of similar phenotypes may be traced back to certain key genetic variations that reflect adaptations to specific environments during the evolutionary history of the isolates. One important example is the loss-of-function mutation in lasR that has a strong impact on the phenotype as shown in the example of a small cluster of isolates. The common appearance of mutations within lasR has been noted previously in clinical settings (33–35), especially in P. aeruginosa isolates recovered from the chronically infected respiratory tracts of patients suffering from cystic fibrosis (28, 30, 36). However, apart from the pleiotropic effect of LasR, which is a global regulator affecting the expression of more than 100 genes, we also observed epistatic effects. Clinical isolates that exhibit a mutation in LasR did not cluster with respect to phenotypic similarity. Obviously, there are multiple interacting genes that lead to the same phenotype, such that mutations in LasR do not lead to dominant changes in the phenotype that would be observed in all isolates. In conclusion, our results indicate that in general, the P. aeruginosa species is able to thrive in diverse habitats and that survival is greatly facilitated by regulatory processes, which are mainly organized in modular regulons under the control of master regulators. Any P. aeruginosa strain seems to have a similar potential to cope with a broad range of distinct environmental conditions that probably also include those encountered within the human host. In addition, mutations in master regulators, such as LasR, allow for a fast adaptation of global expression patterns (18, 21, 37–39) that mimic environmentally elicited phenotypes. Thus, the versatility of P. aeruginosa as a species does not stem only from flexible responsiveness of a complex regulatory network but also from the abundance of various regulatory modules that facilitate fixation of adaptive traits in an evolutionary process. Our results highlight the need to understand the nature and structure of variation as the basis for complex adaptation processes that generate phenotypic variation and drive its evolution. The identification of key regulatory components and their impact on the transcriptomic landscape might have implications for unique interferences with bacterial pathogenicity.
MATERIALS AND METHODS
Bacterial strains and growth conditions.
Single-nucleotide-resolution RNA sequencing data from 151 clinical P. aeruginosa isolates (22) served as the basis for the delineation of the P. aeruginosa transcriptional landscape in this study. The clinical isolates were recovered from clinical infections at various sites from a total of 143 individuals. Twenty-three of the clinical isolates were isolated from cystic fibrosis patients. Total RNA was isolated after growth to late exponential growth phase (optical density at 600 nm [OD600] of 2.0) in LB medium at 37°C with shaking at 180 rpm (22). Raw sequence data of the clinical isolates is available from the SRA database with accession numbers SRP034661 and SRP036144.
Furthermore, RNA sequencing data of the P. aeruginosa PA14 reference strain cultivated under 14 different growth conditions (a total of 51 samples) were used in the global gene expression analysis in this study. Those conditions included growth within biofilms, at various temperatures, growth phases, osmolarities, phosphate and iron concentrations, under anaerobic conditions, attached to a surface, and conditions encountered within the eukaryotic host. The P. aeruginosa PA14 transcriptome sequencing (RNA-seq) data have in part been generated in the context of previous studies in our lab (18–21) and are accessible as a single data set from the GEO database under the accession number GSE55197. Four replicates of PA14 that are available under the accession number SRP034661 (genome data set) were included in 51 samples used for this part of this analysis. Details on the culture conditions of strain PA14 to generate environment-driven differentials in gene expression as well as the differential gene expression profiles on single or groups of PA14 strains can be explored via the web-based Bactome database (https://bactome.helmholtz-hzi.de).
Calculation of gene expression.
Sequence reads were separated according to their bar codes, and bar code sequences were removed. The longer reads (110 nucleotides [nt]) resulting from the sequencing of clinical samples were trimmed using the fastq-mcf script of the ea-utils package (40) removing adapters and low-quality sequences. Trimming was omitted for short reads (50 nt), since the fraction of artifacts and poor-quality sequence was found to be low (data not shown). Trimmed sequences were mapped to the genome sequence of the reference strain P. aeruginosa PA14 using stampy (41) with default settings. Absolute gene expression was calculated by counting the number of reads that mapped to annotated genes as described previously (19). The R package DESeq (42) was used for further expression analysis. Absolute read counts were normalized to yield nRPK (normalized reads per kilobase of gene sequence) values using the following equation:
where nRPKij is the number of normalized reads per kilobase of gene sequence of gene i and expression profile j, li is the length of gene i, RPGi is the number of reads that mapped to the locus of gene i, and Fj is the size factor (calculated by DESeq) of expression profile j.
Identification of highly expressed and nonexpressed genes.
Since the sensitivity toward genes with low transcriptional activity strongly depends on the sequencing depth, which varied across all samples between 427,000 (427K) and 8,800K total reads, we sought to level off this difference. Therefore, we defined a sensitivity limit for gene expression nRPK0, based on the sample showing the lowest sequencing depth (i.e., the expression profile with the lowest size factor as calculated by DESeq). By that means, a gene is defined as not expressed if its normalized read count is below the sensitivity limit defined as follow:
where nRPK0 is the nRPK at the limit of sensitivity, lavg is the median length (in base pairs) of a gene in the PA14 genome (excluding rRNA and tRNA genes), and Fmin is the smallest size factor resulting from the simultaneous normalization of all expression profiles with DESeq. Depending on the strain, between 20 and 46% of all genes showed an expression level below this sensitivity limit (nRPKij < nRPK0). It is important to note that this fraction was independent of the total read count (Pearson correlation with size factors, r = −0.12) but was larger in clinical strains (median, 37.5%) than in the 51 PA14 samples (median, 29.7%), presumably due to accessory genes that are fully absent from their genomes.
Comparison of gene expression profiles.
Gene expression profiles were compared by calculating the fold change for each gene between any pair of samples across all 151 clinical isolates and independently across the 51 samples of the reference strain PA14, using the nbinomTest function of the DESeq package. The variation of gene expression was calculated for each gene by determining the 75th percentile of the absolute fold changes (FC75) across all pairwise comparisons. Genes with a FC75 of >4 were classified as highly variable. Functional classification of genes was adapted from the Pseudomonas genome project using the PseudoCAP functional annotation (43, 44). rRNA and tRNA genes were excluded from the classification and analysis.
A phenotypic tree was calculated by clustering the gene expression profiles using hierarchical clustering with the unweighted pair group method with arithmetic mean (UPGMA, in R using the “method=‘average’” option of the hclust function) of their Pearson correlation distance, which was calculated as (1 − r)/2 with r being the Pearson correlation calculated using the R function cor using normalized read counts (nRPK) of the 592 highly variable genes (FC75 of >4) of the genome data set. To test the robustness of this method, distances were calculated from Kendall and Spearman correlation coefficients and as Euclidean and Manhattan distance (a summary of the different measures applied here can be found in reference 45). The clustering method was also varied using weighted pair group method using arithmetic averages (WPGMA), median linkage (weighted pair group method using centroids [WPGMC]), centroid linkage (unweighted pair group method using centroids [UPGMC]), single linkage, and complete linkage as alternatives.
The phenotypic distances of the two individual data sets were compared using the Mann-Whitney U test, a nonparametric test of the null hypothesis that the mean ranks of two populations are equal.
Bactome database.
Access to the data stored in the Bactome database is achieved through a system of web services (https://bactome.helmholtz-hzi.de), which offer tools for the display of the data, e.g., in the form of a “Gene Feature Card,” or for the processing of data sets with statistical analysis in R. The Bactome database is implemented on a Linux-based Apache web server and consists of data stored in a MySQL database system. Programs are written in Python, while web pages are in HTML with JavaScript functionality. Bactome stores the basic sequence information in flat files, whereas all of the annotation is contained in the MySQL database. Group comparisons of clinical isolates for significant gene expression enrichment in one of the groups were performed using Student’s t test. The Benjamini-Hochberg (bh) correction was used to calculate adjusted P values (padj) to control the false discovery rate (FDR) in the list of regulated genes.
Calculation of genotypic distances (k-mer tree).
The genotypic tree was created using the sequencing reads of the clinical isolates and the four wild-type samples of reference strain PA14 directly. Genotypic distances between the strains were calculated using a k-mer approach developed by Ole Lund and Rolf Kaas (46). The reads were split into 17-mers, which were then compared between the strains. The number of times a 17-mer appeared in a single isolate was not taken into account. This approach uses genome-wide sequence data and as such offers a high resolution in the comparison of global genotypes. Its comparability with gene-based methods like multilocus sequence typing (MLST) was tested by calculating an alternative genotypic tree from the sequences of nine consistently expressed genes: spuD (PA14_03920), nirS (PA14_06750), rpoB (PA14_08760), icd (PA14_30190), clpX (PA14_41230), tig (PA14_41250), hpd (PA14_53070), ftsZ (PA14_57275), and atpD (PA14_73240). The resulting tree showed high similarity with the k-mer-based tree but offered much less resolution in the segregation of closely related strains (data not shown).
The genotypic distances between the clinical isolates were compared statistically with the phenotypic distances calculated from the Pearson correlation distances as described in the section “comparison of gene expression profiles” using the simple Mantel test (100,000 iterations), implemented as the command line script zt by Eric Bonnet (47).
Accession numbers.
Data for sequences determined during this study can be found under accession numbers SRP034661 and SRP036144 (genome dataset); and GSE55197 (environment dataset).
SUPPLEMENTAL MATERIAL
Genes of P. aeruginosa that commonly showed a high level of expression. This Excel file contains three sheets with lists of genes that ranked in the top 25% of normalized gene expression (nRPK > nRPK75) in all 151 clinical isolates (430 genes), in all samples cultivated under 14 different environmental conditions (356 genes), or in both data sets (261 genes). The genes are annotated using the reference genome of P. aeruginosa PA14 according to the Pseudomonas genome database (43, 44) augmented by recently annotated noncoding RNA genes (19).
Genes of P. aeruginosa that commonly showed large fold changes in the level of expression. This Excel file contains three sheets with the lists of genes with the 75th percentile of the absolute fold changes larger than 4 (FC75 of >4) in pairwise comparison between all 151 clinical isolates (592 genes), in all samples cultivated under 14 different environmental conditions (796 genes), or in at least one of the two data sets (1,121 genes). The genes are annotated using the reference genome of P. aeruginosa PA14 according to the Pseudomonas genome database (43, 44) augmented by recently annotated noncoding RNA genes (19).
ACKNOWLEDGMENTS
This work was supported by an ERC starter grant (RESISTOME 260276), the German Research Foundation (DFG SFB 900), the BioInterfaces program of the Helmholtz Association and the Federal Ministry of Education and Research. S.S. and A.K. were supported by the Helmholtz International Graduate School for Infection Research, grant VHGS-202. TWINCORE GmbH is a joint venture of the Hannover Medical School, Hannover, Germany, and the Helmholtz Centre for Infection Research, Braunschweig, Germany. We acknowledge support by Deutsche Forschungsgemeinschaft and the Open Access Publishing Fund of Karlsruhe Institute of Technology.
We thank Daniel Jonas (Freiburg University Medical Centre, Freiburg, Germany), Iris Chaberny (Hannover Medical School, Hannover, Germany), Martin Kaase and Sören Gatermann (Ruhr University Bochum, Bochum, Germany), and Yvonne Pfeiffer (Robert Koch Institute, Wernigerode, Germany) for providing us with clinical P. aeruginosa strains. We thank Raimo Franke for excellent assistance and fruitful discussions on differential expression analysis and Robert Geffers and the Genome Analytics group at HZI for Illumina sequencing.
We declare that we have no conflicts of interest.
Footnotes
Citation Dötsch A, Schniederjans M, Khaledi A, Hornischer K, Schulz S, Bielecka A, Eckweiler D, Pohl S, Häussler S. 2015. The Pseudomonas aeruginosa transcriptional landscape is shaped by environmental heterogeneity and genetic variation. mBio 6(4):e00749-15. doi:10.1128/mBio.00749-15.
REFERENCES
- 1.Lewontin RC. 1957. The adaptations of populations to varying environments. Cold Spring Harb Symp Quant Biol 22:395–408. doi: 10.1101/SQB.1957.022.01.037. [DOI] [PubMed] [Google Scholar]
- 2.Elena SF, Lenski RE. 2003. Evolution experiments with microorganisms: the dynamics and genetic bases of adaptation. Nat Rev Genet 4:457–469. doi: 10.1038/nrg1088. [DOI] [PubMed] [Google Scholar]
- 3.Philippe N, Crozat E, Lenski RE, Schneider D. 2007. Evolution of global regulatory networks during a long-term experiment with Escherichia coli. Bioessays 29:846–860. doi: 10.1002/bies.20629. [DOI] [PubMed] [Google Scholar]
- 4.Dekel E, Mangan S, Alon U. 2005. Environmental selection of the feed-forward loop circuit in gene-regulation networks. Phys Biol 2:81–88. doi: 10.1088/1478-3975/2/2/001. [DOI] [PubMed] [Google Scholar]
- 5.Fusco G, Minelli A. 2010. Phenotypic plasticity in development and evolution: facts and concepts. Philos Trans R Soc Lond B Biol Sci 365:547–556. doi: 10.1098/rstb.2009.0267. [DOI] [PMC free article] [PubMed] [Google Scholar]
- 6.Goldberg JB. 2000. Pseudomonas: global bacteria. Trends Microbiol 8:55–57. doi: 10.1016/S0966-842X(99)01671-6. [DOI] [PubMed] [Google Scholar]
- 7.Silby MW, Winstanley C, Godfrey SA, Levy SB, Jackson RW. 2011. Pseudomonas genomes: diverse and adaptable. FEMS Microbiol Rev 35:652–680. doi: 10.1111/j.1574-6976.2011.00269.x. [DOI] [PubMed] [Google Scholar]
- 8.Lyczak JB, Cannon CL, Pier GB. 2000. Establishment of Pseudomonas aeruginosa infection: lessons from a versatile opportunist. Microbes Infect 2:1051–1060. doi: 10.1016/S1286-4579(00)01259-4. [DOI] [PubMed] [Google Scholar]
- 9.Costerton JW, Stewart PS, Greenberg EP. 1999. Bacterial biofilms: a common cause of persistent infections. Science 284:1318–1322. doi: 10.1126/science.284.5418.1318. [DOI] [PubMed] [Google Scholar]
- 10.Stover CK, Pham XQ, Erwin AL, Mizoguchi SD, Warrener P, Hickey MJ, Brinkman FS, Hufnagle WO, Kowalik DJ, Lagrou M, Garber RL, Goltry L, Tolentino E, Westbrock-Wadman S, Yuan Y, Brody LL, Coulter SN, Folger KR, Kas A, Larbig K, Lim R, Smith K, Spencer D, Wong GK, Wu Z, Paulsen IT, Reizer J, Saier MH, Hancock RE, Lory S, Olson MV. 2000. Complete genome sequence of Pseudomonas aeruginosa PAO1, an opportunistic pathogen. Nature 406:959–964. doi: 10.1038/35023079. [DOI] [PubMed] [Google Scholar]
- 11.Lee DG, Urbach JM, Wu G, Liberati NT, Feinbaum RL, Miyata S, Diggins LT, He J, Saucier M, Déziel E, Friedman L, Li L, Grills G, Montgomery K, Kucherlapati R, Rahme LG, Ausubel FM. 2006. Genomic analysis reveals that Pseudomonas aeruginosa virulence is combinatorial. Genome Biol 7:R90. doi: 10.1186/gb-2006-7-10-r90. [DOI] [PMC free article] [PubMed] [Google Scholar]
- 12.Schuster M, Greenberg EP. 2006. A network of networks: quorum-sensing gene regulation in Pseudomonas aeruginosa. Int J Med Microbiol 296:73–81. doi: 10.1016/j.ijmm.2006.01.036. [DOI] [PubMed] [Google Scholar]
- 13.Balasubramanian D, Schneper L, Kumari H, Mathee K. 2013. A dynamic and intricate regulatory network determines Pseudomonas aeruginosa virulence. Nucleic Acids Res 41:1–20. doi: 10.1093/nar/gks1039. [DOI] [PMC free article] [PubMed] [Google Scholar]
- 14.Galán-Vásquez E, Luna B, Martínez-Antonio A. 2011. The regulatory network of Pseudomonas aeruginosa. Microb Inform Exp 1:3. doi: 10.1186/2042-5783-1-3. [DOI] [PMC free article] [PubMed] [Google Scholar]
- 15.Wiehlmann L, Wagner G, Cramer N, Siebert B, Gudowius P, Morales G, Köhler T, van Delden C, Weinel C, Slickers P, Tümmler B. 2007. Population structure of Pseudomonas aeruginosa. Proc Natl Acad Sci U S A 104:8101–8106. doi: 10.1073/pnas.0609213104. [DOI] [PMC free article] [PubMed] [Google Scholar]
- 16.Pirnay JP, Matthijs S, Colak H, Chablain P, Bilocq F, Van Eldere J, De Vos D, Zizi M, Triest L, Cornelis P. 2005. Global Pseudomonas aeruginosa biodiversity as reflected in a Belgian river. Environ Microbiol 7:969–980. doi: 10.1111/j.1462-2920.2005.00776.x. [DOI] [PubMed] [Google Scholar]
- 17.Alonso A, Rojo F, Martínez JL. 1999. Environmental and clinical isolates of Pseudomonas aeruginosa show pathogenic and biodegradative properties irrespective of their origin. Environ Microbiol 1:421–430. doi: 10.1046/j.1462-2920.1999.00052.x. [DOI] [PubMed] [Google Scholar]
- 18.Blanka A, Schulz S, Eckweiler D, Franke R, Bielecka A, Nicolai T, Casilag F, Düvel J, Abraham WR, Kaever V, Häussler S. 2014. Identification of the alternative sigma factor SigX regulon and its implications for Pseudomonas aeruginosa pathogenicity. J Bacteriol 196:345–356. doi: 10.1128/JB.01034-13. [DOI] [PMC free article] [PubMed] [Google Scholar]
- 19.Dötsch A, Eckweiler D, Schniederjans M, Zimmermann A, Jensen V, Scharfe M, Geffers R, Häussler S. 2012. The Pseudomonas aeruginosa transcriptome in planktonic cultures and static biofilms using RNA sequencing. PLoS One 7:e31092. doi: 10.1371/journal.pone.0031092. [DOI] [PMC free article] [PubMed] [Google Scholar]
- 20.Bielecki P, Komor U, Bielecka A, Müsken M, Puchałka J, Pletz MW, Ballmann M, Martins dos Santos VA, Weiss S, Häussler S. 2013. Ex vivo transcriptional profiling reveals a common set of genes important for the adaptation of Pseudomonas aeruginosa to chronically infected host sites. Environ Microbiol 15:570–587. doi: 10.1111/1462-2920.12024. [DOI] [PubMed] [Google Scholar]
- 21.Schulz S, Eckweiler D, Bielecka A, Nicolai T, Franke R, Dötsch A, Hornischer K, Bruchmann S, Düvel J, Häussler S. 2015. Elucidation of sigma factor-associated networks in Pseudomonas aeruginosa reveals a modular architecture with limited and function-specific crosstalk. PLoS Pathog 11:e1004744. doi: 10.1371/journal.ppat.1004744. [DOI] [PMC free article] [PubMed] [Google Scholar]
- 22.Pohl S, Klockgether J, Eckweiler D, Khaledi A, Schniederjans M, Chouvarine P, Tümmler B, Häussler S. 2014. The extensive set of accessory Pseudomonas aeruginosa genomic components. FEMS Microbiol Lett 356:235–241. doi: 10.1111/1574-6968.12445. [DOI] [PubMed] [Google Scholar]
- 23.Barrick JE, Yu DS, Yoon SH, Jeong H, Oh TK, Schneider D, Lenski RE, Kim JF. 2009. Genome evolution and adaptation in a long-term experiment with Escherichia coli. Nature 461:1243–1247. doi: 10.1038/nature08480. [DOI] [PubMed] [Google Scholar]
- 24.Cooper TF, Rozen DE, Lenski RE. 2003. Parallel changes in gene expression after 20,000 generations of evolution in Escherichia coli. Proc Natl Acad Sci U S A 100:1072–1077. doi: 10.1073/pnas.0334340100. [DOI] [PMC free article] [PubMed] [Google Scholar]
- 25.Green SK, Schroth MN, Cho JJ, Kominos SK, Vitanza-Jack VB. 1974. Agricultural plants and soil as a reservoir for Pseudomonas aeruginosa. Appl Microbiol 28:987–991. [DOI] [PMC free article] [PubMed] [Google Scholar]
- 26.Mathee K, Narasimhan G, Valdes C, Qiu X, Matewish JM, Koehrsen M, Rokas A, Yandava CN, Engels R, Zeng E, Olavarietta R, Doud M, Smith RS, Montgomery P, White JR, Godfrey PA, Kodira C, Birren B, Galagan JE, Lory S. 2008. Dynamics of Pseudomonas aeruginosa genome evolution. Proc Natl Acad Sci U S A 105:3100–3105. doi: 10.1073/pnas.0711982105. [DOI] [PMC free article] [PubMed] [Google Scholar]
- 27.Klockgether J, Cramer N, Wiehlmann L, Davenport CF, Tümmler B. 2011. Pseudomonas aeruginosa genomic structure and diversity. Front Microbiol 2:150. doi: 10.3389/fmicb.2011.00150. [DOI] [PMC free article] [PubMed] [Google Scholar]
- 28.Yang L, Jelsbak L, Marvig RL, Damkiaer S, Workman CT, Rau MH, Hansen SK, Folkesson A, Johansen HK, Ciofu O, Høiby N, Sommer MO, Molin S. 2011. Evolutionary dynamics of bacteria in a human host environment. Proc Natl Acad Sci U S A 108:7481–7486. doi: 10.1073/pnas.1018249108. [DOI] [PMC free article] [PubMed] [Google Scholar]
- 29.Damkiaer S, Yang L, Molin S, Jelsbak L. 2013. Evolutionary remodeling of global regulatory networks during long-term bacterial adaptation to human hosts. Proc Natl Acad Sci U S A 110:7766–7771. doi: 10.1073/pnas.1221466110. [DOI] [PMC free article] [PubMed] [Google Scholar]
- 30.Spencer DH, Kas A, Smith EE, Raymond CK, Sims EH, Hastings M, Burns JL, Kaul R, Olson MV. 2003. Whole-genome sequence variation among multiple isolates of Pseudomonas aeruginosa. J Bacteriol 185:1316–1325. doi: 10.1128/JB.185.4.1316-1325.2003. [DOI] [PMC free article] [PubMed] [Google Scholar]
- 31.Dötsch A, Klawonn F, Jarek M, Scharfe M, Blöcker H, Häussler S. 2010. Evolutionary conservation of essential and highly expressed genes in Pseudomonas aeruginosa. BMC Genomics 11:234. doi: 10.1186/1471-2164-11-234. [DOI] [PMC free article] [PubMed] [Google Scholar]
- 32.Kiewitz C, Tümmler B. 2000. Sequence diversity of Pseudomonas aeruginosa: impact on population structure and genome evolution. J Bacteriol 182:3125–3135. doi: 10.1128/JB.182.11.3125-3135.2000. [DOI] [PMC free article] [PubMed] [Google Scholar]
- 33.Schaber JA, Carty NL, McDonald NA, Graham ED, Cheluvappa R, Griswold JA, Hamood AN. 2004. Analysis of quorum sensing-deficient clinical isolates of Pseudomonas aeruginosa. J Med Microbiol 53:841–853. doi: 10.1099/jmm.0.45617-0. [DOI] [PubMed] [Google Scholar]
- 34.Cabrol S, Olliver A, Pier GB, Andremont A, Ruimy R. 2003. Transcription of quorum-sensing system genes in clinical and environmental isolates of Pseudomonas aeruginosa. J Bacteriol 185:7222–7230. doi: 10.1128/JB.185.24.7222-7230.2003. [DOI] [PMC free article] [PubMed] [Google Scholar]
- 35.Dénervaud V, TuQuoc P, Blanc D, Favre-Bonté S, Krishnapillai V, Reimmann C, Haas D, van Delden C. 2004. Characterization of cell-to-cell signaling-deficient Pseudomonas aeruginosa strains colonizing intubated patients. J Clin Microbiol 42:554–562. doi: 10.1128/JCM.42.2.554-562.2004. [DOI] [PMC free article] [PubMed] [Google Scholar]
- 36.D’Argenio DA, Wu M, Hoffman LR, Kulasekara HD, Déziel E, Smith EE, Nguyen H, Ernst RK, Larson Freeman TJ, Spencer DH, Brittnacher M, Hayden HS, Selgrade S, Klausen M, Goodlett DR, Burns JL, Ramsey BW, Miller SI. 2007. Growth phenotypes of Pseudomonas aeruginosa lasR mutants adapted to the airways of cystic fibrosis patients. Mol Microbiol 64:512–533. doi: 10.1111/j.1365-2958.2007.05678.x. [DOI] [PMC free article] [PubMed] [Google Scholar]
- 37.Hartwell LH, Hopfield JJ, Leibler S, Murray AW. 1999. From molecular to modular cell biology. Nature 402:C47–C52. doi: 10.1038/35011540. [DOI] [PubMed] [Google Scholar]
- 38.Hintze A, Adami C. 2008. Evolution of complex modular biological networks. PLoS Comput Biol 4:e23. doi: 10.1371/journal.pcbi.0040023. [DOI] [PMC free article] [PubMed] [Google Scholar]
- 39.Wagner GP, Pavlicev M, Cheverud JM. 2007. The road to modularity. Nat Rev Genet 8:921–931. doi: 10.1038/nrg2267. [DOI] [PubMed] [Google Scholar]
- 40.Aronesty E. 2011. ea-utils. Command-line tools for processing biological sequencing data. http://code.google.com/p/ea-utils.
- 41.Lunter G, Goodson M. 2011. Stampy: a statistical algorithm for sensitive and fast mapping of Illumina sequence reads. Genome Res 21:936–939. doi: 10.1101/gr.111120.110. [DOI] [PMC free article] [PubMed] [Google Scholar]
- 42.Anders S, Huber W. 2010. Differential expression analysis for sequence count data. Genome Biol 11:R106. doi: 10.1186/gb-2010-11-10-r106. [DOI] [PMC free article] [PubMed] [Google Scholar]
- 43.Winsor GL, Lo R, Ho Sui SJ, Ung KS, Huang S, Cheng D, Ching WK, Hancock RE, Brinkman FS. 2005. Pseudomonas aeruginosa Genome Database and PseudoCAP: facilitating community-based, continually updated, genome annotation. Nucleic Acids Res 33:D338–D343. doi: 10.1093/nar/gki047. [DOI] [PMC free article] [PubMed] [Google Scholar]
- 44.Winsor GL, Lam DK, Fleming L, Lo R, Whiteside MD, Yu NY, Hancock RE, Brinkman FS. 2011. Pseudomonas Genome Database: improved com-parative analysis and population genomics capability for Pseudomonas genomes. Nucleic Acids Res 39:D596–D600. doi: 10.1093/nar/gkq869. [DOI] [PMC free article] [PubMed] [Google Scholar]
- 45.Jaskowiak PA, Campello RJ, Costa IG. 2014. On the selection of appropriate distances for gene expression data clustering. BMC Bioinformatics 15(Suppl 2):S2. doi: 10.1186/1471-2105-15-S2-S2. [DOI] [PMC free article] [PubMed] [Google Scholar]
- 46.Leekitcharoenphon P, Nielsen EM, Kaas RS, Lund O, Aarestrup FM. 2014. Evaluation of whole genome sequencing for outbreak detection of Salmonella enterica. PLoS One 9:e87991. doi: 10.1371/journal.pone.0087991. [DOI] [PMC free article] [PubMed] [Google Scholar]
- 47.Bonnet E, Van de Peer Y. 2002. zt: a software tool for simple and partial Mantel tests. J Stat Softw 7(10):1–12. [Google Scholar]
Associated Data
This section collects any data citations, data availability statements, or supplementary materials included in this article.
Supplementary Materials
Genes of P. aeruginosa that commonly showed a high level of expression. This Excel file contains three sheets with lists of genes that ranked in the top 25% of normalized gene expression (nRPK > nRPK75) in all 151 clinical isolates (430 genes), in all samples cultivated under 14 different environmental conditions (356 genes), or in both data sets (261 genes). The genes are annotated using the reference genome of P. aeruginosa PA14 according to the Pseudomonas genome database (43, 44) augmented by recently annotated noncoding RNA genes (19).
Genes of P. aeruginosa that commonly showed large fold changes in the level of expression. This Excel file contains three sheets with the lists of genes with the 75th percentile of the absolute fold changes larger than 4 (FC75 of >4) in pairwise comparison between all 151 clinical isolates (592 genes), in all samples cultivated under 14 different environmental conditions (796 genes), or in at least one of the two data sets (1,121 genes). The genes are annotated using the reference genome of P. aeruginosa PA14 according to the Pseudomonas genome database (43, 44) augmented by recently annotated noncoding RNA genes (19).