

Abstract
Impedimetric lectin biosensors capable of recognizing two different carbohydrates (galactose and sialic acid) in glycans attached to antibodies isolated from human serum were prepared. The first step entailed the modification of a gold surface by a self-assembled monolayer (SAM) deposited from a solution containing a carboxybetaine-terminated thiol applied to the subsequent covalent immobilization of lectins and to resist nonspecific protein adsorption. In the next step, Sambucus nigra agglutinin (SNA) or Ricinus communis agglutinin (RCA) was covalently attached to the SAM, and the whole process of building a bioreceptive layer was optimized and characterized using a diverse range of techniques including electrochemical impedance spectroscopy, cyclic voltammetry, quartz crystal microbalance, contact angle measurements, zeta-potential assays, X-ray photoelectron spectroscopy, and atomic force microscopy. In addition, the application of the SNA-based lectin biosensor in the glycoprofiling of antibodies isolated from the human sera of healthy individuals and of patients suffering from rheumatoid arthritis (RA) was successfully validated using an SNA-based lectin microarray. The results showed that the SNA lectin, in particular, is capable of discriminating between the antibodies isolated from healthy individuals and those from RA patients based on changes in the amount of sialic acid present in the antibodies. In addition, the results obtained by the application of RCA and SNA biosensors indicate that the abundance of galactose and sialic acid in antibodies isolated from healthy individuals is age-related.
1. Introduction
Glycosylation is the most common co- and post-translational modification of proteins; it may be estimated that approximately 70% of cytosolic and 80% of membrane-bound human proteins are glycosylated.1,2 Glycans play an important role in many different processes (e.g., viral infection, cancer development, cell-signaling and adhesion, proper functioning of an immune system), as they enhance the solubility and stability of many proteins but may also determine the function of proteins.3−10 The presence/absence of a single carbohydrate within a glycan structure can significantly influence the function of proteins. The addition of a single molecule of sialic acid (N-acetylneuraminic acid) to the glycan present in the Fc fragment of immunoglobulin (IgG), thereby changing the protein from being a pro-inflammatory to an anti-inflammatory agent, can serve as a good example.11,12 Although over 70% of all therapeutic proteins are glycoproteins,13 the first glyco-engineered therapeutic antibody was only launched as recently as in 2012;14 today significant focus is directed toward controlling the glycosylation of therapeutics.15
Changes in the glycan structure in selected glycoprotein biomarkers are often the result of a disease progression,8,16,17 but may also be associated with aging.18 In the case of autoimmune diseases (e.g., rheumatoid arthritis, RA),19,20 where the antibodies present in human plasma are produced against the host’s own tissues, their glycan composition is changed.21 Detailed analysis of glycans is only made possible by using a battery of instruments,16 but lectins (natural glycan decipherers) interacting with glycans attached to intact proteins can provide functional information about glycans.22 Lectins are (glyco)proteins selectively binding some glycan residues or simple mono- or oligosaccharide structures present in more complex glycans. These molecules are potentially more useful in the search for new biomarkers in complex biological samples than the standard immunochemical protocols because, in lectin-based applications, prior knowledge of a biomarker’s identity or its structure is not required. For glycocode-deciphering, lectins are often applied as an effective tool in many clinical diagnostic procedures, mostly in the microarray analysis, affording an extremely high throughput, simplicity, and reproducibility of assays.23−26
Faradaic electrochemical impedance spectroscopy (EIS) is a powerful tool in bioanalysis, because it enables the determination of analytes down to the aM concentration range.8 The method is based on a small sinusoidal perturbation of a thin conductive or semiconductive surface layer using a low amplitude voltage; for a spectrum of different frequencies, it provides information about surface capacitance, solution, and charge-transfer resistance.27 Moreover, it represents a label-free detection method, hence reducing the negative effect of labeling on a biorecognition event and lectin structure.8,28 It has been successfully used for the detection of a variety of molecules, viruses, or even whole bacterial or eukaryotic cells in different configurations.8,29 Most recently, some new variations of this method have been presented, that is, impedance-derived electrochemical capacitance spectroscopy for the evaluation of lectin-glycoprotein binding affinity30 and immittance electroanalysis.31
It is of the utmost importance to control nonspecific protein-binding, especially when using biosensor devices based on label-free detection platforms.32−34 While molecules bearing oligoethylene glycol (OEG) moieties have been successfully applied to resist nonspecific protein binding in the past, zwitterionic molecules that bind water molecules more strongly than OEG-based molecules, thus exhibiting greater repulsive force against protein adsorption, are becoming more widely used.32,35 Oligo- and poly-zwitterionic molecules attached to various interfaces can be used in a number of applications.36 In addition to the ability to resist nonspecific protein binding,34,37 zwitterionic polymers can provide nonbiofouling surfaces (resisting microbial adhesion),38,39 exhibiting bactericidal effects38,39 beneficial for wound-healing or the prolonged blood circulation of polymer-modified particles.40 Poly- and oligo-zwitterionic molecules are not ideal for the construction of impedimetric biosensors, because the interfacial layer of such devices has to be built up so as to produce a moderate initial charge-transfer resistance (RCT ≈ tens of kΩ).22 Hence, in a previous study, thiolated sulphobetaine (SB) with only one zwitterionic unit was applied to the construction of an EIS lectin-based biosensor with the subsequent glycoprofiling of serum samples.41 Resistance to the adsorption of nonspecific proteins was guaranteed by the formation of a mixed SAM composed of 11-mercaptoundecanoic acid (MUA, for covalent lectin immobilization) and SB (resisting nonspecific interactions and being a MUA diluent).41 The problematic mixing of these two thiols (SB dissolved in water and MUA in ethanol) resulted in the preparation of interfacial layers, which affected the performance of such a device.41 The present study’s first aim was to increase the reproducibility of the biosensor preparation by the application of a carboxybetaine-containing thiol (CB, applicable for covalent lectin immobilization and resisting nonspecific protein binding) to form a one-component SAM with high reproducibility. The second aim was to separate antibodies (i.e., IgG’s, Figure 1) from human serum from healthy individuals and RA patients to increase the sensitivity of glycoprofiling. It should be noted that a short aliphatic thiol bearing a carboxybetaine moiety was recently applied to gold patterning together with a boronate-containing thiol recognizing fructose for the label-free detection of this analyte.42
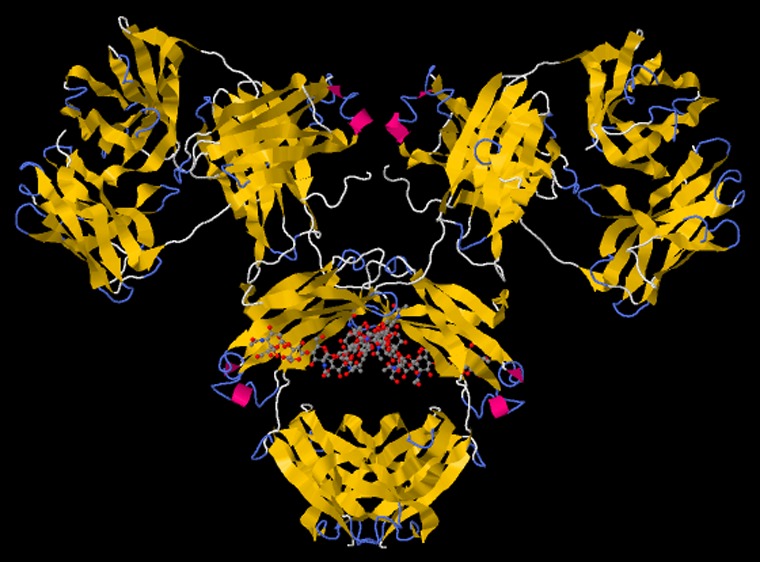
Figure 1.
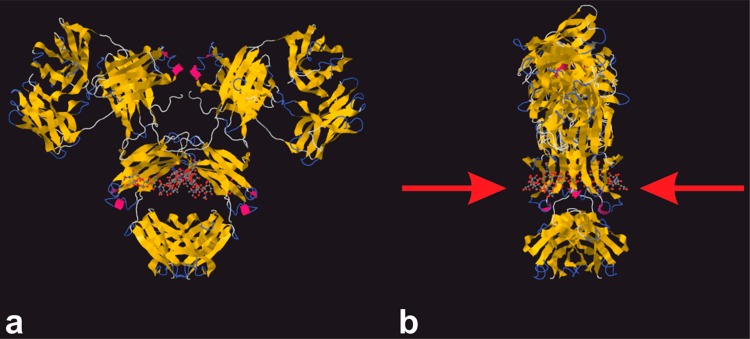
Structure of human immunoglobulin G (IgG) (pdb code 1MCO) with (a) visible glycan moieties in the cavity created by two heavy chains in Fc fragment and (b) lateral view of the same molecule showing availability of two glycan chains for lectin biorecognition (red arrows).
2. Materials and Methods
2.1. Chemicals
Potassium hexacyanoferrate(III) (ferricyanide), potassium hexacyanoferrate(II) trihydrate (ferrocyanide), potassium chloride, phosphate buffer saline tablets, sulfuric acid, sodium hydroxide, N-hydroxysuccinimide (NHS), N-(3-(dimethylamino)propyl)-N′-ethylcarbodiimide hydrochloride (EDC), Ricinus communis agglutinin (RCA, recognizing galactose, caution: handle with special care because it is a biological toxin), fetuin (FET, contains 8.7% of sialic acid), and asialofetuin (ASF, contains ≤0.5% of sialic acid) were purchased from Sigma-Aldrich (U.S.). Sambucus nigra agglutinin type I (SNA, recognizing sialic acid) lectin from Sambucus nigra was purchased from EYLabs (U.S.). Ethanol for UV/vis spectroscopy (ultrapure) was purchased from Slavus (Slovakia). Biotinylated lectins and a carbo-free blocking solution were purchased from Vector Laboratories (U.S.). CF555-streptavidin fluorescent label was purchased from Biotium (U.S.). All solutions were filtered prior to use (using 0.2 μm sterile filters) and prepared in ultrapure distilled water (DW). The synthesis of the carboxybetaine thiol (CB) together with its spectral analysis is provided in the Supporting Information, and the key steps in the synthesis are shown in Scheme 1.
Scheme 1. Synthesis of Carboxybetaine-Containing Thiol Derivative 1.

(i) N,N-Dimethyl glycine ethyl ester, acetone, 3 days, ambient temperature; (ii) CH3CSOH, AIBN, MeOH, UV, ambient temperature; (iii) IRA 400.
2.2. Human Serum Samples
Three (N = 3) serum samples from female patients with seropositive RA (#6, #11, #62, mean age = 72.0 yrs) were used. All RA patients had a severe form of RA (stage III) and were on treatment with methotrexate. One RA patient was treated with nonsteroidal anti-inflammatory drugs. All RA patients met the 2010 ACR-EULAR classification criteria for RA.43 The RA patients were recruited from the National Institute for Rheumatic Diseases in Piešt’any, Slovakia. Six (N = 6) control serum samples from females were included in the study (younger (#34, #37, #64, mean age = 30.0 yrs) and older healthy individuals (#28, #41, #82, mean age = 67.3 yrs)). The control subjects were recruited from the laboratory staff of the Institute of Experimental Endocrinology, Slovak Academy of Sciences, Bratislava, Slovakia. All subjects gave their informed written consent, and the study was approved by the Ethics Committee of the National Institute for Rheumatic Diseases, Piešt’any, Slovakia, in accordance with the ethical guidelines of the Helsinki Declaration as revised in 2000. The blood samples were collected into polyethylene tubes with a clotting activator (S-Monovette, Sarstedt AG & Co., Nümbrecht, Germany). After centrifugation, the serum aliquots were stored at −20 °C until they were analyzed.
2.3. Gold Chip Preparation
Thin films of titanium (purity 99.995%, thickness ∼5 nm) and gold (purity 99.995%, ∼100 nm) were evaporated in an ultrahigh vacuum PVD apparatus on an oxidized silicon wafer 76 mm in diameter. The thin Ti sublayer was used for enhancing the adhesion of the Au layer. Next, the wafer was cut into chips 10 × 10 mm2 using a diamond saw (MicroAce 3AV+, Loadpoint; UK) commonly used in the microelectronics industry.
2.4. Electrode Pretreatment and SAM Layer Formation
The polycrystalline gold electrodes (BASi, U.S., d = 1.6 mm) were treated as previously described using electrochemical reductive desorption, mechanical polishing, chemical treatment, and a repeated electrochemical polishing and stripping procedure.44 In summary, in the first step the previously bound thiol molecules were desorbed from the surface using cyclic voltammetry (CV) in 100 mM NaOH under anaerobic conditions (100 scans from −500 to −1500 mV at a scan rate of 100 mV s–1), and then the electrodes were polished mechanically using a polishing pad and alumina slurry (particle size 1 and 0.3 μm, each for 5 min) and left after short sonication in a hot piranha solution for 20 min (H2O2 and H2SO4 at 1:3 ratio, caution: handle with special care). Next, CV was performed again in 100 mM H2SO4 (25 scans from −200 to +1500 mV at a scan rate of 100 mV s–1) for the electrochemical polishing and gold oxide stripping (10 scans, from +750 to +200 mV at a scan rate of 100 mV s–1), respectively. All steps were performed using a laboratory potentiostat/galvanostat PGSTAT 128N (Ecochemie, The Netherlands) in a three-electrode cell system, using auxiliary Pt and reference Ag/AgCl electrodes. Immediately after the gold oxide stripping procedure was completed, the electrodes were washed with DW, left to dry in a dust-free environment, and subsequently used for formation of the self-assembled monolayer (SAM) of 1 mM thiol stock solution in DW freshly prepared prior to use.
2.5. Zeta (ζ) Potential Measurements
Square-shaped gold chips (10 × 10 mm2, provided by the Institute of Electrical Engineering, Slovak Academy of Sciences; see section 2.3) were modified as previously described for the planar gold electrodes. The ζ potential of the modified Au surfaces was determined using a SurPASS Electrokinetic Analyzer (Anton Paar GmbH, Austria) with a commercial adjustable gap cell and with a background KCl electrolyte with a concentration of 1 mM. A solution of 0.1 M electrolyte solution was used for correcting the resistance. The flow of electrolyte solution, which is forced by hydraulic pressure against the electrochemical double layer, disrupts the distribution of ions in the electrochemical double layer and generates a potential difference, denoted as the streaming potential. The ζ potential was obtained from the streaming potential measurements on the basis of the Helmholtz–Smoluchowski equation as follows:
where U is the streaming potential, p is the pressure drop across the streaming channel, ε0 is the vacuum permittivity, εr is the dielectric constant of the aqueous solution, η is the electrolyte solution viscosity, L is the channel length, A is the cross-section area of the streaming channel, and R is the resistance of the measuring cell. The streaming pressures in the rinse mode and in the measurement mode were set at 20 and 50 kPa, respectively. The viscosity and permittivity of the electrolyte were calculated on the basis of the temperature using a calibration curve.
2.6. Electrochemical Impedance Spectroscopy (EIS) Measurements
On an electrode modified by a SAM, the biorecognition elements (SNA and RCA lectins) were immobilized using standard amine coupling with carboxylic groups of CB being activated by a 1 + 1 mixture of 0.2 M EDC in DW and 0.05 M NHS in DW for 10 min (Scheme 2). The lectins were covalently immobilized on the activated SAM layer from a 40 μL stock solution (1 mg mL–1 in PBS). All electrochemical impedance spectroscopy (EIS) measurements were performed in a filtered electrolyte containing 5 mM ferricyanide, 5 mM ferrocyanide, and 0.1 M KCl. The analysis was conducted at 50 different frequencies (ranging from 0.1 Hz to 100 kHz) using Nova Software 1.10 (Ecochemie, The Netherlands). The data acquired were evaluated by the same software using a Nyquist plot with a Randles–Erschler equivalent circuit R(C[RW]) employed. The change in charge-transfer resistance (RCT) relative to a reference surface (a biosensor surface after the lectin immobilization and stabilization in a sterile 100 mM KCl solution for at least 15 min) expressed in % was used as a measurement signal. Each analyte/sample was measured in triplicate at least, using an independent biosensor device, and the results are shown with a standard deviation (±SD) calculated in Excel. Human samples were diluted in a sterile and filtered 10 mM PBS buffer, pH 7.4 containing chloride ions (tablets) to prevent any significant changes in ionic strength during the experiment. The analysis of each sample lasted for 40 min including incubation of the sample with the biosensor device for 20 min, and then the biosensor was incubated for 10 min in a sterile 100 mM KCl solution with a subsequent impedimetric analysis conducted for an additional 10 min. All stock solutions (lectins, standard glycoproteins, and human samples) were stored at −20 °C in aliquots for periods not exceeding 1 month.
Scheme 2. Graphical Representation of Biosensor Built Up with Initial Formation of SAM Layer (Carboxybetaine-Containing Thiol) on Au Surface, Followed by Activation of −COOH Groups by a Mixture of EDC and NHS and Finally by Immobilization of Lectin (Blue).
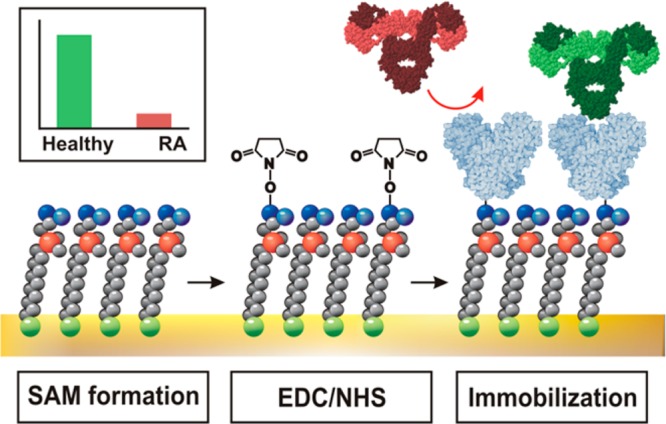
Interaction of analyte (antibody in green) with biosensor is shown, and repulsion of proteins, which is not an analyte (antibody in red), is also shown.
2.7. Atomic Force Microscopy (AFM) Measurements
Peak force tapping mode atomic force microscopy (Scan Asyst, Bruker, U.S.) in air mode was carried out on a Bioscope Catalyst instrument and Olympus IX71 microscope in conjunction with NanoScope 8.15 software using ScanAsyst in air mode. Square-shaped gold chips (10 × 10 mm2, provided by the Institute of Electrical Engineering, Slovak Academy of Sciences; see section 2.3) modified as previously described for the planar gold electrodes were scanned using a SCANASYST-AIR silicon tip on a nitride lever (Bruker, U.S., with f0 = 50–90 kHz and k = 0.4 N m–1), sharpened to a tip radius of 2 nm.
2.8. Quartz Crystal Microbalance (QCM) Measurements
All QCM measurements were performed using Autolab PGSTAT 128N (Ecochemie, The Netherlands) equipment using an EQCM module. The changes per mass were evaluated using Sauerbrey’s equation:
| 1 |
where Δf is the frequency change (Hz), f0 is the nominal resonant frequency of the crystal (6 MHz), Δm is the change in mass (g cm–2) and μq is the shear modulus of a quartz crystal (g cm–1 s–2), A is the surface area, and ρq is the density of quartz in g mL–1. For a 6 MHz crystal, the whole equation can be simplified to
| 2 |
where Cf is the frequency constant 0.0815 Hz ng–1 cm–2. The measurements were monitored and evaluated using Nova 1.10 software, and all measurements were carried out at ambient temperature.
2.9. Lectin Microarrays (MA)
The lectin microarray experiments were performed with 10 mM phosphate buffer solution (PBS) as a printing buffer, PBST (phosphate buffer solution with the addition of 0.05% Tween 20) as a washing buffer, and PBST containing 10× diluted carbo-free blocking solution applied as a blocking buffer. In summary, at least four different concentrations and five different spots for each standard glycoprotein (FET, ASF) or 800× diluted human serum samples, respectively, were spotted using a SpotBot3Microarray Protein edition (Arrayit, U.S.) on epoxide-coated slides Nexterion E (Schott, Germany) using a previously optimized protocol.45 The spotting temperature was set at 10 °C and the humidity up to 60%. Subsequently, the slide was placed in a humidity chamber for 1 h at ambient temperature with a humidity of 80–90%, blocked using a blocking buffer at ambient temperature for 1 h, and with slow shaking, rinsed under a gentle stream of a printing buffer in a Petri dish, then drained. Next, 80 μL of 25 μg mL–1 biotinylated lectin in a binding buffer was applied to the slide surface and incubated for 1 h. After the lectin incubation, the slide was incubated with the Biotium CF555-streptavidin solution (80 μL of 5 μg mL–1 in a printing buffer) for 15 min in the dark. After the washing procedure (PBS, distilled water), the slide was scanned using an InnoScan710 scanner (Innopsys, France) at a wavelength of 532 nm. The slide image was evaluated using Mapix 5.5.0 by evaluating the intensity of the fluorescence and the intensity of all independent array spots on the array.
2.10. Isolation of Antibodies from Human Serum
Human IgG (from real human sera) were isolated using a Melon Gel IgG Spin Purification Kit (Thermo Scientific, U.S.), affording a reproducible purification of human samples, comparable to those using protein A or G. In summary, serum samples were diluted and processed according to the manufacturer’s protocol. After the procedure, the IgG concentrations in the stock solution and in the original sample were determined by UV spectrophotometry (at 280 nm) and the Lambert–Beer law using the molar extinction coefficient ε = 210 000 M–1 cm–1 provided by the manufacturer. The output signals obtained from both of the lectin-based bioanalytical methods (EIS and MA) were divided by the IgG concentration in the stock solution.
3. Results and Discussion
3.1. SAM Layer Formation and Characterization
Contact Angle Measurements
The bare Au surface (after the piranha cleaning procedure for a few minutes) exhibited a moderate level of hydrophobicity/hydrophilicity with a contact angle of 63.5°, a value comparable to the values of 70°46 and 62°47 obtained in previous studies. After formation of the CB monolayer on the Au surface, the hydrophilicity of an interface increased, as can be observed from the contact angle of 40° obtained on such a modified gold surface. This contact angle value is in agreement with the value of 34° obtained on a poly(carboxybetaine methacrylate)-modified surface48 and within the contact angles of 33–53° obtained on various poly(carboxybetaine methacrylamide)-modified surfaces.49
AFM Measurements
Monitoring of the differences in surface topology between the bare Au chips and the same chips modified with a CB monolayer using AFM exhibited no difference in surface roughness ((0.37 ± 0.18) nm for bare Au and (0.39 ± 0.12) nm for a CB SAM-modified surface, respectively; p > 0.05 for at least three different samples), suggesting that the topology of the SAM copied the surface topology of the bare gold surface, creating a uniform and dense layer.
Zeta (ζ) Potential Measurements
Zeta potential measurements at pH 7 revealed that, upon formation of CB SAM, the value of the ζ potential of the bare Au surface decreased from −80 to −120 mV. Note that the zeta potential values are very dependent on pH value and overall conductivity of the substrate surface and partially dependent on shape and structure of the substrate and zeta potential assay method. These values are comparable to the ζ potential of a similar system where the value for carboxylic acid-SAM was determined as −100 mV at pH 7.50 Other studies refer to the ζ potential value of (−187 ± 7) mV for carboxylic acid-terminated SAMs.51,52 Moreover, mixed positive/negative charged SAMs have isoelectric point shifted to pH lower than 7.50 Even zwitterionic SAM on the gold solid surface might have significantly negative ζ potential value at pH 7.
All of these measurements together with XPS data on SAM (see Supporting Information) are consistent with the successful formation of CB SAM on a bare gold surface. Accordingly, the CB-modified gold surface was ready for the subsequent activation of −COOH groups of CB for covalent immobilization of two different lectins, RCA and SNA.
3.2. Optimization of Activation Time Using EDC/NHS Chemistry
Because the CB SAM does not contain any diluting thiol, the density of the −COOH groups present in the SAM is too high, and the only way to control the density of the immobilized lectin is to optimize the time of activation by EDC/NHS. The optimal time of activation of the −COOH groups by EDC/NHS was followed by QCM (obtaining surface lectin density) and AFM (reading surface roughness). The results obtained from QCM and AFM consistently showed that the highest lectin density was obtained with an activation time of 10 min (Figure 2).
Figure 2.
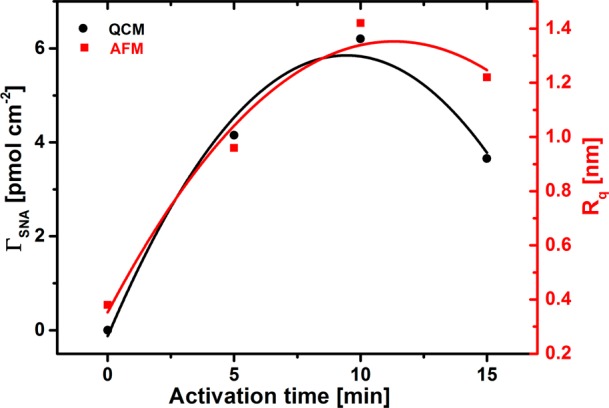
Correlation between surface density of immobilized SNA lectin (black) and surface roughness of the surface with immobilized SNA expressed as Rq (red) obtained from QCM and AFM experiments, respectively. SNA lectin was immobilized from 1 mg mL–1 stock solution in 10 mM PBS.
The lectin surface coverage increased from a value of 4.2 pmol cm–2 to a value of 6.2 pmol cm–2 when the activation time was increased from 5 to 10 min. It is worth noting that the lectin surface coverage decreased to a value of 3.7 pmol cm–2 when the surface confined −COOH groups were activated for 15 min. This low lectin surface coverage of 3.7 pmol cm–2 can be explained by hydrolysis of the activated esters in an aqueous solution during incubation for 15 min, resulting in a decreased density of activated esters available for covalent lectin immobilization. The AFM experiments revealed a similar pattern, that is, an increased surface roughness Rq from a value of 0.39 nm (without activation, i.e., CB SAM) to a value of 0.96 nm (5 min activation) and further to a value of 1.4 nm (10 min activation) (Figure 3). Finally, a decrease to a value of 1.2 was observed when the surface was activated for 15 min (Figure 3). On the basis of these results, a 10 min activation time was selected for the covalent immobilization of lectins in subsequent experiments.
Figure 3.

3D AFM images (from top left to bottom right) of CB SAM-modified Au surface after piranha cleaning procedure (0 min activation) and after SNA lectin immobilization with 5, 10, and 15 min activation times. The range of the z-axis in all AFM images was set at 5 nm to see the differences in the surface topology clearly.
3.3. EIS Characterization and Measurements
First, the charge-transfer resistance (RCT) of the prepared surfaces, corresponding to a diameter in a semicircle region of a Nyquist plot, was investigated (Figure 4A). The bare Au electrodes exhibited an average initial RCT value of 87 Ω. However, the RCT value only shifted slightly to a value of (98 ± 4) Ω after incubation with a CB solution. After SNA lectin immobilization, RCT increased to a value of (620 ± 10) Ω. A sharp increase in RCT to a value of (2700 ± 640) Ω was observed upon incubation of the biosensor with IgG analyte (Figures 4A and 5). The cyclic voltammetry measurements (Figure 4B) are consistent with the EIS investigation, showing that immobilization of an SNA lectin on CB SAM-modified gold formed a quite effective barrier, resulting in a decreased reversibility of the ferricyanide electrochemistry with ΔEp = 134 mV in comparison with ΔEp = 94 mV observed on a CB SAM-modified Au surface.
Figure 4.
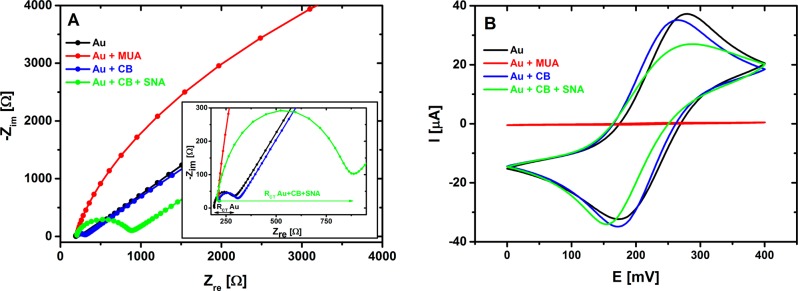
Nyquist plots (obtained from EIS investigation) of bare gold electrode (black), CB SAM layer deposited on Au surface (blue), and the same layer after immobilization of SNA lectin (green) (A). Inset in (A) shows Nyquist plots with high magnification zoomed to initial values, and also shows that RCT value is read as a diameter of a semicircle for a particular Nyquist plot as depicted for bare Au surface (black) and for surface after immobilization of SNA lectin (green). Corresponding cyclic voltammograms for all interfacial layers are also shown (B). In this experiment, EIS and CV of traditional SAM layer applied to covalent protein immobilization composed of 11-mercaptoundecanoic acid (MUA, red line with RCT too high to be calculated) were also characterized.
Figure 5.

Charge-transfer resistance (RCT) of prepared surfaces after each step of biosensor construction, for example, bare gold (Au), SAM layer (+CB), SAM layer after SNA lectin immobilization (+SNA), and the same surface after incubation with IgG stock solution (+IgG).
3.4. Calibration of EIS Lectin Biosensor and Analysis of Real Biological Samples
Calibration of the EIS lectin biosensor was performed only with the SNA lectin immobilized, because the limit of detection and working concentration ranges for the SNA- and RCA-based lectin biosensors were found to be similar in a previous study.41 ASF containing a much lower amount of sialic acid than in FET can also be detected, but with a slightly lower sensitivity ((21.0 ± 1.5)% for ASF vs (30.8 ± 1.1)% for FET). For every calibration curve constructed (in Figure 6), an average SD was calculated. As noise for the measurement for a particular analyte, 3× average SD was calculated. In the subsequent step, the concentration of both analytes (FET and ASF) for both methods of analysis (EIS and MA) above this noise level was found, and this value is presented as the limit of detection (LOD). For EIS measurements, the LOD for FET was 3.5 × 10⁻⁶ mg mL–1 (73 pM) and for ASF was 1.3 × 10⁻⁶ mg mL–1 (2.7 nM). For the MA assays, the LOD for FET was 0.015 mg mL–1 (310 nM) and for ASF was 0.020 mg mL–1 (420 nM). The lectin-based microarray affords an LOD approximately 4 orders of magnitude higher than the EIS lectin-based biosensor for the main analyte FET (Figure 6). A much lower limit of detection for EIS than for MA was also observed in the previous study.41 It is worth noting that the SD in Figure 6 for EIS is not the SD of the assay but rather the SD of a biosensor preparation, because every calibration or sample measurement by EIS was performed with an independently prepared biosensor device. The LOD of the impedimetric SNA biosensor based on CB is 73 pM, a value much higher than the value of 24 fM (a value recalculated from ref (41)) for the impedimetric SNA biosensor based on a mixed SAM composed of MUA and SB. This difference might be the result of a larger initial RCT of the interface of the SNA biosensor previously published (32 kΩ)41 as compared to this study (620 Ω), indicating that a moderate initial RCT is essential to obtain a high level of detection for impedimetric devices, as discussed previously.27 Moreover, the impedimetric SNA biosensor based on a mixed SAM composed of MUA and SB was more resistant to nonspecific protein binding (6.1% of the specific response),41 in comparison with the 30% of nonspecific response (using human serum albumin) observed for the current SNA biosensor (data not shown). The beneficial features of the current SNA biosensor over that previously published based on MUA and SB41 are the higher reproducibility of the biosensor construction (average RSD of 8.9% vs 16.1%), higher sensitivity of analysis (30.8% M–1 vs 14.6% M–1), and a more reliable calibration curve expressed as R2 (0.993 vs 0.954).41 The increase in initial RCT needed to render the EIS-based lectin biosensor more sensitive and robust can be achieved by blocking the biosensor surface with bovine serum albumin as previously proposed for suspended microchannel resonators;34 this blocking procedure made the analysis of analytes in serum reliable.34
Figure 6.
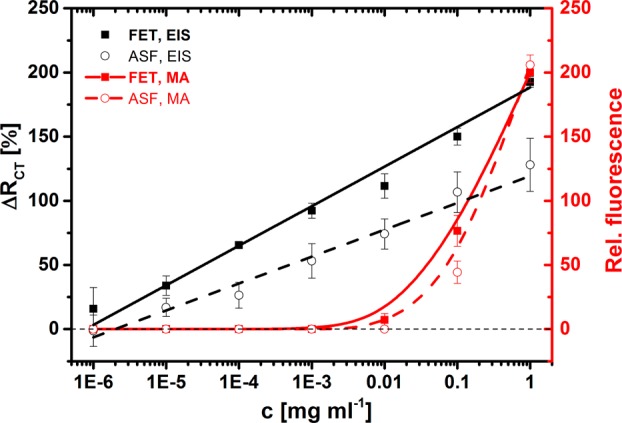
Calibration of EIS-based SNA lectin biosensor with two different glycoproteins FET and ASF differing in amount of sialic acid present on protein backbone. Calibration of SNA-based lectin microarray with the same glycoproteins is provided to show differences in sensitivity of analysis of glycoproteins by these two devices.
Suitable data for comparing the analytical performance of the proposed impedimetric biosensor with other glycoprofiling methods are not easy to find, but a lectin-based analogy of ELISA can offer an LOD down to the pM level with a linear range (LR) spanning 1 order of concentration magnitude;45,53 the lowest LOD for EIS-based biosensors is in aM–fM range with the LR spanning 3–9 orders of magnitude,8,28 and an LOD of 67 nM for SPR and QCM lectin-based methods with LR of 1–2 orders of magnitude was demonstrated.28 Label-based lectin biosensors offer an LOD down to 3 pM with the LR spanning 3 orders of magnitude.28 The main advantage of lectin-based glycoprofiling is the ability to analyze even intact cells (i.e., cancerous cells) without any treatment.10,37 Instrumental techniques make it possible to glycoprofile samples down to the attomolar–femtomolar level with a few microliters of the sample (∼pM–nM level) with a linear range spanning 2–3 orders of magnitude.16,54,55
Because the second aim of this study was to apply developed EIS-based lectin biosensors to the glycoprofiling of isolated IgG’s (antibodies), the analysis of which is more relevant to studying the progression of the RA disease than glycoprofiling a whole serum sample, affinity columns were applied to isolate IgG’s (antibodies) from the serum samples. A simple comparison of the relative output signal (i.e., ΔRCT divided by the total protein content) revealed an enhancement of the signal 65.6-fold (slope of 25.6 ± 1.2 vs 0.39 ± 0.01) (Figure 7), a feature important for the enhanced reliability of the analysis. In the subsequent experiment, the nonfouling properties of the CB SAM were tested. Figure 7 shows that the calibration curve for isolated IgG is affected by a large SD (average RSD of 22.6% as compared to average RSD of 8.9% for standard glycoprotein FET), which might be explained by the presence of small components within the serum depleted from highly abundant proteins. In forthcoming studies, other methods will be applied to purify the IgG fraction (i.e., using protein A/G columns). The LOD of 3.2 nM calculated for isolated IgG was quite high due to the large SD of the assays.
Figure 7.
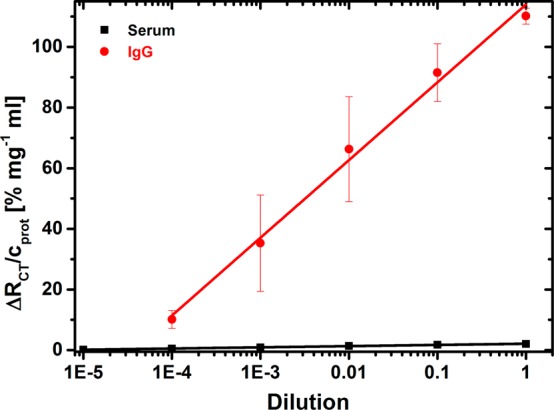
Calibration of EIS-based SNA lectin biosensor with either whole human serum or IgG’s (antibodies) isolated from human serum with various dilutions.
A gold surface patterned only by CB SAM was exposed to IgG’s isolated from human serum with different dilutions to probe nonspecific interactions. While only a negligible nonspecific signal was observed at dilutions 10 000× and 1000× the isolated IgG’s, when the same concentration of IgG’s was applied to the SNA-based biosensor, a good and reliable biospecific response was obtained (Figure 8). Incubation of the IgG’s with the CB SAM at a dilution of 100× resulted in a significant relative response of 10.6% as compared to a biospecific relative response of 63.8%. Accordingly, in subsequent experiments, isolated IgG’s diluted 1000× were applied to glycoprofiling.
Figure 8.
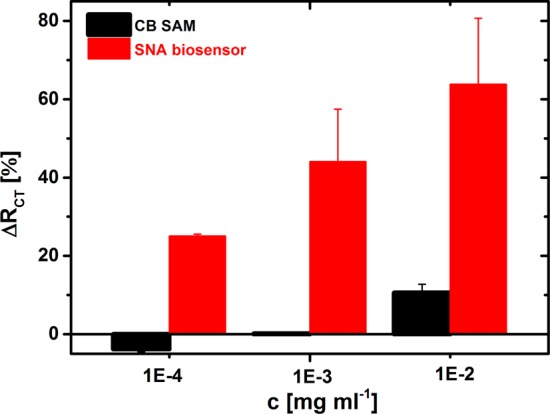
Investigation of protein adsorption resistant properties of impedimetric SNA-based lectin biosensor developed on CB SAM-modified gold surface. Nonspecific interaction of isolated IgG’s was investigated by incubation of IgG’s with CB SAM-modified surface, while a biospecific interaction was read by the EIS biosensor with SNA lectin immobilized.
The final part of this study is the application of RCA- and SNA-based biosensors to the glycoprofiling of IgG’s isolated from the serum of healthy individuals and of those suffering from the RA disease. In addition, a pool of samples from healthy individuals was divided into two batches by the age of these individuals. The results presented in Figure 9 show that the RCA lectin can hardly distinguish between the IgG’s isolated from healthy individuals and those suffering from RA (slope of 57.6 ± 2.0 vs 47.7 ± 1.6) at different dilutions of IgG’s. Interestingly, the glycoprofiling of IgG’s from young healthy individuals exhibited a larger signal (slope of 66.1 ± 2.2) than that of the other two types of IgG samples (from RA patients and older healthy individuals).
Figure 9.
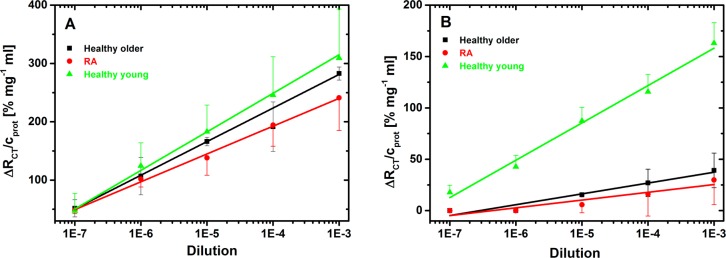
Analysis of isolated IgG’s with different dilutions with RCA-based lectin biosensor (A) or SNA-based lectin biosensor (B) to detect changes in content of galactose or sialic acid, respectively, within glycan structures.
The glycoprofiling of isolated IgG’s by the SNA-based biosensor revealed larger differences among all three types of samples in the present study as compared to the output obtained by the RCA-based biosensor. While a moderate difference was observed in the sialic acid content in the IgG’s isolated from the serum of healthy older individuals and RA patients (slope of 10.5 ± 1.4 vs 7.6 ± 1.6), the sialic acid on the IgG’s isolated from young healthy individuals was much higher (slope of 36.4 ± 2.1) than in the above two groups. In the most recent studies, it is suggested that altered glycosylation might be age-related, because glycan synthesis is influenced by the activity of two different types of enzymes, that is, anabolic (glycosyltransferases) and catabolic (exoglycosidases) enzymes. Age-driven changes in the enzymatic activities of these two types of glycan-processing enzymes thus result in an altered glycan synthesis.18,56,57 The present results indicate that age-related changes in the glycan profile should be taken into account to make glycoprofiling more reliable for future diagnostics of various diseases.
IgG’s from all three types of human serum samples were also glycoprofiled with SNA lectin in a microarray analysis. The results showed that the EIS-based biosensor was capable of providing reliable data, because validation of the biosensor by a widely applied lectin microarray method was in good agreement with R2 = 0.990 (Figure 10). The large error bars shown in Figure 10 are due to the analysis of several samples with each of the three categories (RA, healthy older, healthy young) naturally differing in the level of IgG and glycosylation.
Figure 10.
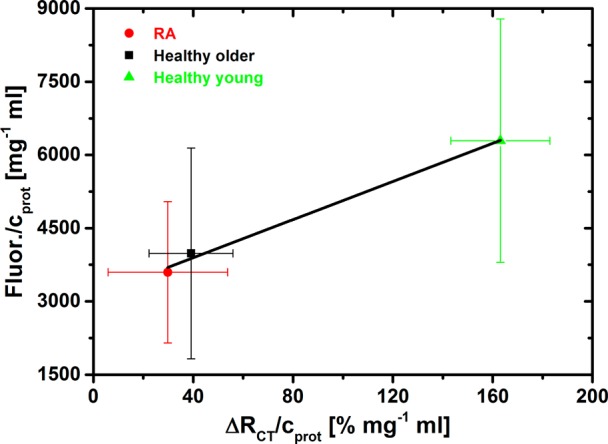
Validation of glycoprofiling of IgG’s isolated from human serum performed by EIS-based SNA lectin biosensor (x-axis) with extensively used fluorescent SNA-based microarray (y-axis).
Extensive recent strategies aimed at discovering novel biomarkers have revealed that to have just a single biomarker for a particular disease is proving quite elusive and that, for the sensitive and specific diagnosis of different diseases, a panel of biomarkers is required.58 As well as the frequent application of several genetic and protein biomarkers, it is proposed that glycoprofiling will be an important biomarker for inclusion in the panel of biomarkers for future disease diagnostics.
4. Conclusions
The study investigated the preparation of a biointerface for an easy, reproducible, robust, and sensitive impedimetric detection of two carbohydrate residues (galactose and sialic acid) present on the IgG molecules isolated from the human sera of healthy individuals and patients with RA. Because the biological signal for the assay derives from an affinity biorecognition event, it is extremely important to adequately block nonspecific protein adsorption on the surface. For this purpose, a new CB derivative was synthesized, because zwitterionic materials are known to offer good properties for resisting nonspecific protein binding. By a simple chemical modification of gold electrode surfaces by SAMs composed of a newly synthesized thiol (CB), it was possible to prepare a highly sensitive impedimetric lectin-based electrochemical assay. In addition, the lectin-based biosensors were applied to the analysis of real human samples (IgG’s isolated from human sera with glycans still attached to the Fc fragment of IgG), and the SNA-based biosensor was able to distinguish between patients suffering from RA and healthy individuals. Furthermore, the study also revealed that the desialylation and degalactosylation of human IgG’s might be an age-related process,59 which should be taken into account for these kinds of analyses in future works. To enhance the robustness of glycoprofiling by the impedimetric lectin biosensor based on CB, a more efficient blocking of the interface is needed, which can result in a decreased LOD with increased specificity of analysis. The analysis of one sample can be made considerably less time-consuming by integration of the electrodes into an array format of analysis. Furthermore, improved purification of the antibodies from human serum is needed for overall enhancement of IgG glycoprofiling.
Acknowledgments
We thank Dr Sardar Ali, GPC Qatar University, for carrying out XPS analysis. Financial support received from the Slovak Scientific Grant Agency VEGA 2/0162/14 and from the Slovak Research and Development Agency APVV 0282-11 is acknowledged. The research leading to these results received funding from the European Research Council under the European Union’s Seventh Framework Programme (FP/2007-2013)/ERC Grant Agreement no. 311532. This publication was made possible by NPRP grant no. 6-381-1-078 from the Qatar National Research Fund (a member of the Qatar Foundation). The statements made herein are solely the responsibility of the authors.
Supporting Information Available
Synthesis together with the characterization of CB and XPS spectra. The Supporting Information is available free of charge on the ACS Publications website at DOI: 10.1021/acs.langmuir.5b00944.
Author Contributions
○ T.B. and A.Š. contributed equally to this work.
The authors declare no competing financial interest.
Supplementary Material
References
- Arnaud J.; Audfray A.; Imberty A. Binding sugars: from natural lectins to synthetic receptors and engineered neolectins. Chem. Soc. Rev. 2013, 42, 4798–4813. [DOI] [PubMed] [Google Scholar]
- Cummings R. D.; Pierce J. M. The challenge and promise of glycomics. Chem. Biol. 2014, 21, 1–15. [DOI] [PMC free article] [PubMed] [Google Scholar]
- Crispin M.; Doores K. J. Targeting host-derived glycans on enveloped viruses for antibody-based vaccine design. Curr. Opin. Virol. 2015, 11, 63–69. [DOI] [PMC free article] [PubMed] [Google Scholar]
- Dalziel M.; Crispin M.; Scanlan C. N.; Zitzmann N.; Dwek R. A. Emerging principles for the therapeutic exploitation of glycosylation. Science 2014, 343, 37. 10.1126/science.1235681. [DOI] [PubMed] [Google Scholar]
- Dirr L.; El-Deeb I. M.; Guillon P.; Carroux C. J.; Chavas L. M. G.; von Itzstein M. The catalytic mechanism of human parainfluenza virus type 3 haemagglutinin-neuraminidase revealed. Angew. Chem., Int. Ed. 2015, 54, 2936–2940. [DOI] [PubMed] [Google Scholar]
- Hushegyi A.; Bertok T.; Damborsky P.; Katrlik J.; Tkac J. An ultrasensitive impedimetric glycan biosensor with controlled glycan density for detection of lectins and influenza hemagglutinins. Chem. Commun. 2015, 51, 7474–7477. [DOI] [PMC free article] [PubMed] [Google Scholar]
- Macauley M. S.; Crocker P. R.; Paulson J. C. Siglec-mediated regulation of immune cell function in disease. Nat. Rev. Immunol. 2014, 14, 653–666. [DOI] [PMC free article] [PubMed] [Google Scholar]
- Paleček E.; Tkáč J.; Bartošík M.; Bertók T.; Ostatná V.; Paleček J. Electrochemistry of non-conjugated proteins and glycoproteins. Towards sensors for biomedicine and glycomics. Chem. Rev. 2015, 115, 2045–2108. [DOI] [PMC free article] [PubMed] [Google Scholar]
- Rouvinski A.; Guardado-Calvo P.; Barba-Spaeth G.; Duquerroy S.; Vaney M.-C.; Kikuti C. M.; Sanchez M. E. N.; Dejnirattisai W.; Wongwiwat W.; Haouz A.; Girard-Blanc C.; Petres S.; Shepard W. E.; Despres P.; Arenzana-Seisdedos F.; Dussart P.; Mongkolsapaya J.; Screaton G. R.; Rey F. A. Recognition determinants of broadly neutralizing human antibodies against dengue viruses. Nature 2015, 10.1038/nature14130. [DOI] [PubMed] [Google Scholar]
- Stencel-Baerenwald J. E.; Reiss K.; Reiter D. M.; Stehle T.; Dermody T. S. The sweet spot: defining virus-sialic acid interactions. Nat. Rev. Microbiol. 2014, 12, 739–749. [DOI] [PMC free article] [PubMed] [Google Scholar]
- Anthony R. M.; Nimmerjahn F.; Ashline D. J.; Reinhold V. N.; Paulson J. C.; Ravetch J. V. Recapitulation of IVIG anti-inflammatory activity with a recombinant IgG Fc. Science 2008, 320, 373–376. [DOI] [PMC free article] [PubMed] [Google Scholar]
- Kaneko Y.; Nimmerjahn F.; Ravetch J. V. Anti-inflammatory activity of immunoglobulin G resulting from Fc sialylation. Science 2006, 313, 670–673. [DOI] [PubMed] [Google Scholar]
- Baker J. L.; Çelik E.; DeLisa M. P. Expanding the glycoengineering toolbox: the rise of bacterial N-linked protein glycosylation. Trends Biotechnol. 2013, 31, 313–323. [DOI] [PubMed] [Google Scholar]
- Beck A.; Reichert J. M. Marketing approval of mogamulizumab. mAbs 2012, 4, 419–425. [DOI] [PMC free article] [PubMed] [Google Scholar]
- Lepenies B.; Seeberger P. H. Simply better glycoproteins. Nat. Biotechnol. 2014, 32, 443–445. [DOI] [PubMed] [Google Scholar]
- Alley W. R.; Mann B. F.; Novotny M. V. High-sensitivity analytical approaches for the structural characterization of glycoproteins. Chem. Rev. 2013, 113, 2668–2732. [DOI] [PMC free article] [PubMed] [Google Scholar]
- Gilgunn S.; Conroy P. J.; Saldova R.; Rudd P. M.; O’Kennedy R. J. Aberrant PSA glycosylation–a sweet predictor of prostate cancer. Nat. Rev. Urol. 2013, 10, 99–107. [DOI] [PubMed] [Google Scholar]
- Dall’Olio F.; Vanhooren V.; Chen C. C.; Slagboom P. E.; Wuhrer M.; Franceschi C. N-glycomic biomarkers of biological aging and longevity: A link with inflammaging. Ageing Res. Rev. 2013, 12, 685–698. [DOI] [PubMed] [Google Scholar]
- Goulabchand R.; Vincent T.; Batteux F.; Eliaou J.-f.; Guilpain P. Impact of autoantibody glycosylation in autoimmune diseases. Autoimmun. Rev. 2014, 13, 742–750. [DOI] [PubMed] [Google Scholar]
- Albrecht S.; Unwin L.; Muniyappa M.; Rudd P. M. Glycosylation as a marker for inflammatory arthritis. Cancer Biomarkers 2014, 14, 17–28. [DOI] [PMC free article] [PubMed] [Google Scholar]
- Zauner G.; Selman M. H. J.; Bondt A.; Rombouts Y.; Blank D.; Deelder A. M.; Wuhrer M. Glycoproteomic analysis of antibodies. Mol. Cell. Proteomics 2013, 12, 856–865. [DOI] [PMC free article] [PubMed] [Google Scholar]
- Tang H.; Hsueh P.; Kletter D.; Bern M.; Haab B.. The detection and discovery of glycan motifs in biological samples using lectins and antibodies: New methods and opportunities. In Advances in Cancer Research; Richard R. D., Lauren E. B., Eds.; Academic Press: New York, 2015; Vol. 126, Chapter 5, pp 167–202. [DOI] [PMC free article] [PubMed] [Google Scholar]
- Cecioni S.; Imberty A.; Vidal S. Glycomimetics versus multivalent glycoconjugates for the design of high affinity lectin ligands. Chem. Rev. 2015, 115, 525–561. [DOI] [PubMed] [Google Scholar]
- Geissner A.; Anish C.; Seeberger P. H. Glycan arrays as tools for infectious disease research. Curr. Opin. Chem. Biol. 2014, 18, 38–45. [DOI] [PubMed] [Google Scholar]
- Solis D.; Bovin N. V.; Davis A. P.; Jimenez-Barbero J.; Romero A.; Roy R.; Smetana K. Jr.; Gabius H. J. A guide into glycosciences: How chemistry, biochemistry and biology cooperate to crack the sugar code. Biochim. Biophys. Acta 2015, 1850, 186–235. [DOI] [PubMed] [Google Scholar]
- Song X.; Heimburg-Molinaro J.; Cummings R. D.; Smith D. F. Chemistry of natural glycan microarrays. Curr. Opin. Chem. Biol. 2014, 18, 70–77. [DOI] [PMC free article] [PubMed] [Google Scholar]
- Tkac J.; Davis J. J.. Label-free field effect protein sensing. Engineering the Bioelectronic Interface: Applications to Analyte Biosensing and Protein Detection; The Royal Society of Chemistry: UK, 2009; Chapter 7, pp 193–224. [Google Scholar]
- Klukova L.; Bertok T.; Kasak P.; Tkac J. Nanoscale-controlled architecture for the development of ultrasensitive lectin biosensors applicable in glycomics. Anal. Methods 2014, 6, 4922–4931. [DOI] [PMC free article] [PubMed] [Google Scholar]
- Loaiza O. A.; Lamas-Ardisana P. J.; Jubete E.; Ochoteco E.; Loinaz I.; Cabañero G. n.; García I.; Penadés S. Nanostructured disposable impedimetric sensors as tools for specific biomolecular interactions: Sensitive recognition of Concanavalin A. Anal. Chem. 2011, 83, 2987–2995. [DOI] [PubMed] [Google Scholar]
- Santos A.; Carvalho F. C.; Roque-Barreira M.-C.; Bueno P. R. Impedance-derived electrochemical capacitance spectroscopy for the evaluation of lectin–glycoprotein binding affinity. Biosens. Bioelectron. 2014, 62, 102–105. [DOI] [PubMed] [Google Scholar]
- Patil A. V.; Bedatty Fernandes F. C.; Bueno P. R.; Davis J. J. Immittance electroanalysis in diagnostics. Anal. Chem. 2014, 87, 944–950. [DOI] [PubMed] [Google Scholar]
- Vaisocherová H.; Brynda E.; Homola J. Functionalizable low-fouling coatings for label-free biosensing in complex biological media: advances and applications. Anal. Bioanal. Chem. 2015, 407, 3927–3953. [DOI] [PubMed] [Google Scholar]
- Vaisocherová H.; Zhang Z.; Yang W.; Cao Z.; Cheng G.; Taylor A. D.; Piliarik M.; Homola J.; Jiang S. Functionalizable surface platform with reduced nonspecific protein adsorption from full blood plasma—Material selection and protein immobilization optimization. Biosens. Bioelectron. 2009, 24, 1924–1930. [DOI] [PubMed] [Google Scholar]
- von Muhlen M. G.; Brault N. D.; Knudsen S. M.; Jiang S.; Manalis S. R. Label-free biomarker sensing in undiluted serum with suspended microchannel resonators. Anal. Chem. 2010, 82, 1905–1910. [DOI] [PMC free article] [PubMed] [Google Scholar]
- Shao Q.; Jiang S. Molecular understanding and design of zwitterionic materials. Adv. Mater. 2015, 27, 15–26. [DOI] [PubMed] [Google Scholar]
- Sundaram H. S.; Han X.; Nowinski A. K.; Brault N. D.; Li Y.; Ella-Menye J.-R.; Amoaka K. A.; Cook K. E.; Marek P.; Senecal K.; Jiang S.. Achieving one-step surface coating of highly hydrophilic poly(carboxybetaine methacrylate) polymers on hydrophobic and hydrophilic surfaces. Adv. Mater. Interfaces 2014, 1, DOI: 10.1002/admi.201400071. [DOI] [PMC free article] [PubMed] [Google Scholar]
- Zhu Y.; Xu X.; Brault N. D.; Keefe A. J.; Han X.; Deng Y.; Xu J.; Yu Q.; Jiang S. Cellulose paper sensors modified with zwitterionic poly(carboxybetaine) for sensing and detection in complex media. Anal. Chem. 2014, 86, 2871–2875. [DOI] [PubMed] [Google Scholar]
- Mi L.; Jiang S. Integrated antimicrobial and nonfouling zwitterionic polymers. Angew. Chem., Int. Ed. 2014, 53, 1746–1754. [DOI] [PubMed] [Google Scholar]
- Cao B.; Tang Q.; Cheng G. Recent advances of zwitterionic carboxybetaine materials and their derivatives. J. Biomater. Sci., Polym. Ed. 2014, 25, 1502–1513. [DOI] [PubMed] [Google Scholar]
- Yang W.; Liu S.; Bai T.; Keefe A. J.; Zhang L.; Ella-Menye J.-R.; Li Y.; Jiang S. Poly(carboxybetaine) nanomaterials enable long circulation and prevent polymer-specific antibody production. Nano Today 2014, 9, 10–16. [Google Scholar]
- Bertok T.; Klukova L.; Sediva A.; Kasák P.; Semak V.; Micusik M.; Omastova M.; Chovanová L.; Vlček M.; Imrich R.; Vikartovska A.; Tkac J. Ultrasensitive impedimetric lectin biosensors with efficient antifouling properties applied in glycoprofiling of human serum samples. Anal. Chem. 2013, 85, 7324–7332. [DOI] [PMC free article] [PubMed] [Google Scholar]
- Sun F.; Ella-Menye J.-R.; Galvan D. D.; Bai T.; Hung H.-C.; Chou Y.-N.; Zhang P.; Jiang S.; Yu Q. Stealth surface modification of surface-enhanced raman scattering substrates for sensitive and accurate detection in protein solutions. ACS Nano 2015, 9, 2668–2676. [DOI] [PubMed] [Google Scholar]
- Aletaha D.; Neogi T.; Silman A. J.; Funovits J.; Felson D. T.; Bingham C. O.; Birnbaum N. S.; Burmester G. R.; Bykerk V. P.; Cohen M. D.; Combe B.; Costenbader K. H.; Dougados M.; Emery P.; Ferraccioli G.; Hazes J. M. W.; Hobbs K.; Huizinga T. W. J.; Kavanaugh A.; Kay J.; Kvien T. K.; Laing T.; Mease P.; Ménard H. A.; Moreland L. W.; Naden R. L.; Pincus T.; Smolen J. S.; Stanislawska-Biernat E.; Symmons D.; Tak P. P.; Upchurch K. S.; Vencovský J.; Wolfe F.; Hawker G. 2010 Rheumatoid arthritis classification criteria: An American College of Rheumatology/European League Against Rheumatism collaborative initiative. Arthritis Rheum. 2010, 62, 2569–2581. [DOI] [PubMed] [Google Scholar]
- Tkac J.; Davis J. J. An optimized electrode pre-treatment for SAM formation on polycrystalline gold. J. Electroanal. Chem. 2008, 621, 117–120. [Google Scholar]
- Klukova L.; Bertok T.; Petrikova M.; Sediva A.; Mislovicova D.; Katrlik J.; Vikartovska A.; Filip J.; Kasak P.; Andicsová-Eckstein A.; Mosnáček J.; Lukáč J.; Rovenský J.; Imrich R.; Tkac J. Glycoprofiling as a novel tool in serological assays of systemic sclerosis: A comparative study with three bioanalytical methods. Anal. Chim. Acta 2015, 853, 555–562. [DOI] [PMC free article] [PubMed] [Google Scholar]
- Abdelsalam M. E.; Bartlett P. N.; Kelf T.; Baumberg J. Wetting of regularly structured gold surfaces. Langmuir 2005, 21, 1753–1757. [DOI] [PubMed] [Google Scholar]
- Mattiuzzi A.; Jabin I.; Mangeney C.; Roux C.; Reinaud O.; Santos L.; Bergamini J.-F.; Hapiot P.; Lagrost C. Electrografting of calix[4]arenediazonium salts to form versatile robust platforms for spatially controlled surface functionalization. Nat. Commun. 2012, 3, 1130. [DOI] [PubMed] [Google Scholar]
- Rodriguez Emmenegger C.; Brynda E.; Riedel T.; Sedlakova Z.; Houska M.; Alles A. B. Interaction of blood plasma with antifouling surfaces. Langmuir 2009, 25, 6328–6333. [DOI] [PubMed] [Google Scholar]
- Abraham S.; Unsworth L. D. Multi-functional initiator and poly(carboxybetaine methacrylamides) for building biocompatible surfaces using “nitroxide mediated free radical polymerization” strategies. J. Polym. Sci., Part A: Polym. Chem. 2011, 49, 1051–1060. [Google Scholar]
- Lin W.-C.; Lee S.-H.; Karakachian M.; Yu B.-Y.; Chen Y.-Y.; Lin Y.-C.; Kuo C.-H.; Shyue J.-J. Tuning the surface potential of gold substrates arbitrarily with self-assembled monolayers with mixed functional groups. Phys. Chem. Chem. Phys. 2009, 11, 6199–6204. [DOI] [PubMed] [Google Scholar]
- Lin J.-H.; Chang H.-Y.; Kao W.-L.; Lin K.-Y.; Liao H.-Y.; You Y.-W.; Kuo Y.-T.; Kuo D.-Y.; Chu K.-J.; Chu Y.-H.; Shyue J.-J. Effect of surface potential on extracellular matrix protein adsorption. Langmuir 2014, 30, 10328–10335. [DOI] [PubMed] [Google Scholar]
- Chang H.-Y.; Huang C.-C.; Lin K.-Y.; Kao W.-L.; Liao H.-Y.; You Y.-W.; Lin J.-H.; Kuo Y.-T.; Kuo D.-Y.; Shyue J.-J. Effect of surface potential on NIH3T3 cell adhesion and Proliferation. J. Phys. Chem. C 2014, 118, 14464–14470. [Google Scholar]
- Zhang S.; Jiang K.; Zhang Q.; Guo K.; Liu Y. Serum fucosylated paraoxonase 1 as a potential glycobiomarker for clinical diagnosis of early hepatocellular carcinoma using ELISA Index. Glycoconjugate J. 2015, 1–7. [DOI] [PubMed] [Google Scholar]
- Hong Q.; Lebrilla C. B.; Miyamoto S.; Ruhaak L. R. Absolute quantitation of immunoglobulin G and its glycoforms using multiple reaction monitoring. Anal. Chem. 2013, 85, 8585–8593. [DOI] [PMC free article] [PubMed] [Google Scholar]
- Ahmed U.; Anwar A.; Savage R. S.; Costa M. L.; Mackay N.; Filer A.; Raza K.; Watts R. A.; Winyard P. G.; Tarr J.; Haigh R. C.; Thornalley P. J.; Rabbani N. Biomarkers of early stage osteoarthritis, rheumatoid arthritis and musculoskeletal health. Sci. Rep. 2015, 5, 9259. 10.1038/srep09259. [DOI] [PMC free article] [PubMed] [Google Scholar]
- Pawelec G.; Goldeck D.; Derhovanessian E. Inflammation, ageing and chronic disease. Curr. Opin. Immunol. 2014, 29, 23–28. [DOI] [PubMed] [Google Scholar]
- Krištić J.; Vučković F.; Menni C.; Klarić L.; Keser T.; Beceheli I.; Pučić-Baković M.; Novokmet M.; Mangino M.; Thaqi K.; Rudan P.; Novokmet N.; Šarac J.; Missoni S.; Kolčić I.; Polašek O.; Rudan I.; Campbell H.; Hayward C.; Aulchenko Y.; Valdes A.; Wilson J. F.; Gornik O.; Primorac D.; Zoldoš V.; Spector T.; Lauc G. Glycans are a novel biomarker of chronological and biological ages. J. Gerontol., Ser. A 2014, 69, 779–789. [DOI] [PMC free article] [PubMed] [Google Scholar]
- Rusling J. F.; Kumar C. V.; Gutkind J. S.; Patel V. Measurement of biomarker proteins for point-of-care early detection and monitoring of cancer. Analyst 2010, 135, 2496–2511. [DOI] [PMC free article] [PubMed] [Google Scholar]
- Anumula K. R. Quantitative glycan profiling of normal human plasma derived immunoglobulin and its fragments Fab and Fc. J. Immunol. Methods 2012, 382, 167–176. [DOI] [PubMed] [Google Scholar]
Associated Data
This section collects any data citations, data availability statements, or supplementary materials included in this article.