

Abstract
Background
Family support and patient satisfaction with treatment are crucial for aiding in the recovery from stroke. However, current validated stroke-specific questionnaires may not adequately capture the impact of these two variables on patients undergoing clinical trials of new drugs. Therefore, the aim of this study was to develop and evaluate a new stroke patient-reported outcome measure (Stroke-PROM) instrument for capturing more comprehensive effects of stroke on patients participating in clinical trials of new drugs.
Methods
A conceptual framework and a pool of items for the preliminary Stroke-PROM were generated by consulting the relevant literature and other questionnaires created in China and other countries, and interviewing 20 patients and 4 experts to ensure that all germane parameters were included. During the first item-selection phase, classical test theory and item response theory were applied to an initial scale completed by 133 patients with stroke. During the item-revaluation phase, classical test theory and item response theory were used again, this time with 475 patients with stroke and 104 healthy participants. During the scale assessment phase, confirmatory factor analysis was applied to the final scale of the Stroke-PROM using the same study population as in the second item-selection phase. Reliability, validity, responsiveness and feasibility of the final scale were tested.
Results
The final scale of Stroke-PROM contained 46 items describing four domains (physiology, psychology, society and treatment). These four domains were subdivided into 10 subdomains. Cronbach’s α coefficients for the four domains ranged from 0.861 to 0.908. Confirmatory factor analysis supported the validity of the final scale, and the model fit index satisfied the criterion. Differences in the Stroke-PROM mean scores were significant between patients with stroke and healthy participants in nine subdomains (P < 0.001), indicating that the scale showed good responsiveness.
Conclusions
The Stroke-PROM is a patient-reported outcome multidimensional questionnaire developed especially for clinical trials of new drugs and is focused on issues of family support and patient satisfaction with treatment. Extensive data analyses supported the validity, reliability and responsiveness of the Stroke-PROM.
Electronic supplementary material
The online version of this article (doi:10.1186/s12955-015-0246-0) contains supplementary material, which is available to authorized users.
Keywords: Stroke, Patient-reported outcome, Item response theory, Classical test theory, Confirmatory factor analysis, Reliability, Validity, Measurement
Background
Stroke is the second leading cause of mortality worldwide [1], and stroke survivors are often severely disabled for the rest of their lives [2]. More than 85% of strokes occur in developing countries [3]. Epidemiological surveys have shown that there are 150–200 million new cases of stroke each year in China. The age-adjusted annual incidence rate of stroke is 116–219 per 100,000 people, and the annual mortality rate from stroke is 58–142 per 100,000 people [4].
Stroke has considerable adverse physical and psychological impacts on patients over time [5,6]. For the diagnosis and treatment of stroke and its sequelae, therefore, purely objective indicators do not accurately measure the multifaceted impact of stroke on patients. Assessment of the effects of treatment on any individual patient should include the patient’s own evaluation of therapy, or patient-reported outcome (PRO) [7]. A PRO is any report of the status of a patient’s health condition that comes directly from the patient, without interpretation of the patient’s response by a clinician or anyone else [8,9].
In recent years, multiple measures, including generic and disease-specific measures, have been used to assess outcomes of patients with stroke. Generic instruments are useful for comparing quality of life impact in populations with different diseases; however, disease-specific tools are generally more responsive and sensitive to disease-specific issues and are therefore more appropriate for clinical trials in which specific therapeutic interventions are being evaluated [10,11]. Although PRO tools developed specifically for stroke do exist (e.g., Newcastle Stroke-Specific Quality of Life Measure; Stroke and Aphasia Quality of Life Scale-39 item version; Stroke Impact Scale version 2.0), a review of these instruments yielded no measure that captures PRO associated with family support and patient satisfaction with treatment, two particularly significant issues for many stroke survivors [12-15]. Given the absence of stroke-specific measures in the subdomains of family support and treatment satisfaction, the development is necessary of a more comprehensive multidimensional scale that evaluates all facets of the health status in patients with stroke.
Therefore, the aim of this study was to develop an understandable, reliable and valid PRO measure for patients with stroke that captures valuable data from the patient’s viewpoint. This article reports on the development of the initial pool of items, selection of the final item set, and evaluation of a new stroke patient-reported outcome measure (Stroke-PROM).
Methods
Ethics statement
The study protocol and the Stroke-PROM were reviewed and approved by the Medical Ethics Committee of Shanxi Medical University. Participants signed informed consent forms prior to study participation, and all were compensated for their time.
Study population and design
Patients were enrolled from nine different hospitals, communities, and rural areas in Shanxi province in China. Clinical investigators at all study sites recruited participants using the International Classification of Diseases, Ninth Revision, Clinical Modification (ICD-9-CM). Patients participating in this study were diagnosed with stroke by a physician and were not in the acute phase of stroke. The severity of poststroke sequelae in these patients varied from mild to severe. Individuals with tetraplegia, psychosis, or serious comorbidities (e.g., cancer) were excluded. Control participants were recruited from lists of patients who did not have cerebral vascular disease, cancer, or mental illness. Investigators helped patients with severe visual impairments fill in the questionnaires according to the patients’ verbal responses to items.
Ten patients with stroke were interviewed to identify potential items for use in the questionnaire. Five patients with stroke, three physician experts in stroke and one psychometric expert were interviewed for item revision and refinement to ensure that all items were appropriate and relevant. Five stroke patients were interviewed to evaluate their comprehension of each item. For the first item pool reduction, 135 patients with stroke were recruited from nine different hospitals, communities, and rural areas in Shanxi province; valid data from 133 participants were collected. For the item-revaluation phase and the validation phase of the Stroke-PROM, 485 patients with stroke and 110 controls from the same nine geographical regions were recruited, but only 475 and 104, respectively, were available to participate in the study. There was no overlap in the participants who contributed to the first and second item-reduction processes [16,17].
Development of the Stroke-PROM
The Stroke-PROM was developed in four phases: (1) conceptual framework construction and preliminary item generation; (2) formation of the initial scale by the first item-selection process; (3) formation of the final scale by an item-revaluation process based on the second item-selection process; and (4) validation of the Stroke-PROM. Phase 1 involved a qualitative analysis, whereas the other three phases used quantitative analyses. A flowchart of this four-phase developmental process is shown in Figure 1.
Figure 1.
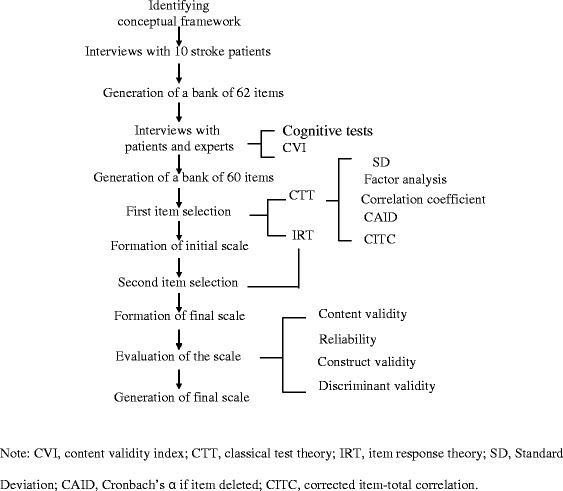
Flowchart of the Stroke-PROM developmental process. Note: CVI, content validity index; CTT, classical test theory; IRT, item response theory; SD, Standard Deviation; CAID, Cronbach’s α if item deleted; CITC, corrected item-total correlation.
Identifying the conceptual framework and preliminary item content
A comprehensive review of existing stroke questionnaires was performed to identify an appropriate conceptual framework (see Figure 2). Four domains and 10 subdomains were generated. In-depth open-ended interviews of 10 stroke patients (5 men and 5 women; ages: ≤45, n = 2; 45–65, n = 5; ≥65, n = 3) were conducted to identify potential items for the Stroke-PROM using the selected conceptual framework. Patients were interviewed about their symptoms, their main psychological burden, the effects of stroke on them and their families, and their evaluations of the therapeutic effect and medical workers. As a result, a bank of 62 potential items was generated. Four chief physicians and five patients (3 men and 2 women; ages: ≤45, n = 1; 45–65, n = 2; ≥65, n = 2; education: high school degrees or above), all of whom were recruited from the First Hospital of Shanxi Medical University and Second Hospital of Shanxi Medical University, participated in revising these 62 preliminary items using a content validity index (CVI) (62 items and scale structure described in Additional file 1: Appendices 1–1 and 1–2).
Figure 2.
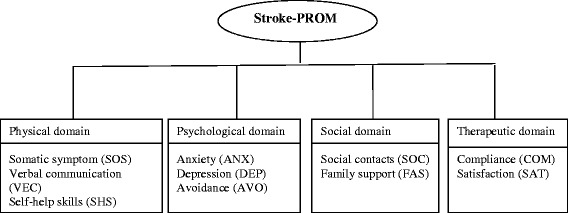
Conceptual framework of the Stroke-PROM.
The CVI is widely used for quantifying content validity for scales. Item-level CVI (I-CVI) is calculated by having experts rate the relevance of each item to its own subdomain (1 = not relevant, 2 = somewhat relevant, 3 = quite relevant, 4 = highly relevant). The I-CVI of each item is defined as the number of experts offering a rating of 3 or 4, divided by the number of experts.
As an adjustment for chance agreements, the multi-rater kappa statistic (K*) was adopted and is described as follows [18,19]:
where Pc is the probability of chance agreement, n is the number of experts, and A is the number approving with good relevance. K* was calculated using the I-CVI and the probability of chance agreement as follows:
Each item on the scale was then rated as “fair,” “good,” or “excellent,” based on the following rating criteria: fair, K* = 0.40–0.59; good, K* = 0.60–0.74; excellent, K* > 0 .74. Any item that received a “fair” rating was deleted.
Five participants with stroke (2 men, 3 women; ages: ≤45, n = 1; 45–65, n = 2; ≥65, n = 2) were interviewed to evaluate their comprehension of each item. Items that were ambiguous, misunderstood, or rarely answered were reworded. The preliminary scale was developed after modifying the item pool based on the suggestions of the physician experts, psychometric expert and patients as well as on the outcomes of the comprehension tests for patients. In the end, the preliminary tool included 4 domains, 11 subdomains, and 60 items.
Formation of the initial scale
One hundred thirty-three patients were told that the aim of the questionnaire was to measure how much their stroke had affected them. For each issue presented in an item, patients responded using a five-point Likert scale to reflect how often they experienced the issue, where 0 = never, 1 = occasionally, 2 = about half of the time, 3 = often, and 4 = always. Scores of positively worded items were recoded as the original score plus 1, whereas scores of negatively worded items were recoded as 5 minus the original response. This recoding produced a score range for each item of 1 to 5, with a higher score reflecting a more positive PRO.
The item-reduction processes of the preliminary scale were based on both classical test theory (CTT) (e.g., discrete trend, factor analysis, correlation coefficient, Cronbach’s α if item deleted [CAID] values, and corrected item-total correlation [CITC]) and item response theory (IRT). CTT was used to reduce the number of items of the Stroke-PROM in the first four of the following steps, and IRT was used in the fifth step.
In step 1, the standard deviation in the score for every item was calculated. A low standard deviation indicates a low degree of differentiation and should be removed; thus, those items with a low standard deviation (<0.96) were deleted in this study.
In step 2, a principal component factor analysis with varimax rotation aided in item reduction. The value for the Kaiser–Meyer–Olkin measure of sampling adequacy was >0.5 [17]. Items with low factor loading (<0.4) or items with factor loading close to other factors was considered for removal.
In step 3, an item was considered for deletion when the Pearson correlation coefficient between the item and its own subdomain was <0.6, which indicated that the item did not represent the subdomain well.
In step 4, the internal consistency of items was evaluated using the CITC and CAID values. An item was considered to have highly contributed to the measured construct when the CITC value was more than 0.45. The CAID value also determines which item highly contributes to the reliability of the Stroke-PROM. An increase in the CAID value indicates that the items poorly contribute to Cronbach’s α value and should be deleted. Therefore, an item was deleted in the present study when the CITC value was <0.45 and the CAID value increased [20-22].
In step 5, IRT was applied to reduce the number of items in the Stroke-PROM. Each item’s parameters of discrimination (α) and difficulty (b) were estimated. Generally, items with discrimination values <0.4 should be deleted. The value of the four degrees of difficulty (b1, b2, b3, b4) ranged from −3 to 3. Items with degrees of difficulty (b1, b2, b3, b4) values outside the range of −3 to 3 should be considered for removal [23].
Both the statistical results and clinical relevance of items were also taken into account prior to an item’s deletion. The resulting initial scale resulted from the removal of items from the preliminary scale.
Formation and validation of the final scale
Thus, an initial scale was generated following the evaluation and selection of items from the preliminary scale. To ensure the reliability and validity of each item included in this initial Stroke-PROM, the items were re-evaluated based on a second item-selection of the initial scale. The CTT and IRT were applied once again to re-evaluate the items in the initial Stroke-PROM using the data gathered from 475 stroke patients, generating the final scale. The final Stroke-PROM tool was then evaluated for validity, reliability, and responsiveness using the data obtained from these 475 stroke patients as well as 104 control participants.
Content validity
Content validity was achieved by referring to relevant literature, consulting questionnaires from China and other countries, interviewing 10 patients to identify potential items, and consulting with 5 patients, 3 physician experts and 1 psychometric expert for item revision and refinement to ensure that all items were appropriate and relevant. Content validity was confirmed using the CVI.
Construct validity
Confirmatory factor analysis with the index of model fit was performed to investigate the factor structure of the scale [23]. The model indicates a good fit when the goodness-of-fit index (GFI), normed fit index (NFI), non-normed fit index (NNFI), incremental fit index (IFI) and comparative fit index (CFI) are all >0.9, and the root mean square residual (RMR) is <0.09. GFI, RMR, NFI and CFI range from 0 to 1.
Reliability
Cronbach’s α coefficients for the four domains and the total scale were calculated to measure the internal consistency of the Stroke-PROM. Generally a Cronbach’s α coefficient ≥ 0.7 indicates an acceptable level of internal consistency.
Discriminant validity
The modified Rankin Scale, a frequently used scale for measuring the degree of disability and dependence in the daily activities of people who have had a stroke, was used as the stroke outcome measure in the present study. This ordered scale ranges from 0 (no symptoms) to 5 (severe disability). Discriminant validity was assessed by comparing the mean scores for every subdomain of the Stroke-PROM among healthy participants with those among groups of stroke patients as defined by the Rankin scale, except for the subdomain of treatment. The comparison of means was performed using analysis of variance, with the significance level set at p < 0.05. The rejection of the null hypothesis would indicate that the scale has the ability to differentiate between healthy controls and stroke patients with varying degrees of disability and dependence as defined by the modified Rankin scale.
Feasibility
The feasibility of the Stroke-PROM tool was evaluated by examining the response rate, completion rate and response time to completion. Response and return rates above 95% were deemed adequate, and completion times of 8 to 13 minutes were considered acceptable.
Data analysis software
Data analyses were conducted using SPSS 13.0, Multilog 7.03 and LISREL 8.70 software.
Results
Participant characteristics
Tables 1 and 2 show the characteristics of the 133 patients with stroke who completed the preliminary scale and of the 475 stroke patients and 104 control participants who completed the initial scale.
Table 1.
Demographic characteristics of 133 patients with stroke in the first item-selection phase
| Characteristics | Stroke patients |
|---|---|
| Sex (n (%)) | |
| Male | 78 (58.4) |
| Female | 55 (41.4) |
| Age (n (%)) | |
| ≤45 | 9 (6.8) |
| 45–65 | 69 (51.9) |
| ≥65 | 55 (41.4) |
| Marital status (n (%)) | |
| Married | 114 (85.7) |
| Unmarried, divorce or widowed | 19 (14.3) |
| Highest education level completed (n (%)) | |
| Primary school or lower | 53 (39.8) |
| Junior high school | 45 (33.8) |
| Senior high school | 19 (14.3) |
| College or higher | 16 (12.0) |
Table 2.
Demographic characteristics of 475 stroke patients and 104 controls in the second item-selection phase and the Stroke-PROM validation phase
| Characteristics | Stroke patients | Controls | χ 2 | P |
|---|---|---|---|---|
| Sex (n (%)) | ||||
| Male | 283 (59.6) | 49 (47.1) | 5.418 | 0.020 |
| Female | 192 (40.4) | 55 (52.9) | ||
| Age (n (%)) | ||||
| ≤45 | 55 (11.6) | 24 (23.1) | 13.626 | 0.001 |
| 45–65 | 230 (48.4) | 54 (51.9) | ||
| ≥65 | 190 (40.0) | 26 (25.0) | ||
| Marital status (n (%)) | ||||
| Married | 398 (83.8) | 86 (82.7) | 0.075 | 0.784 |
| Unmarried, divorced or widowed | 77 (16.2) | 18 (17.3) | ||
| Highest education level completed (n (%)) | ||||
| Primary school or lower | 183 (38.5) | 43 (41.3) | 2.870 | 0.412 |
| Junior high school | 144 (30.3) | 37 (35.6) | ||
| Senior high school | 88 (18.5) | 15 (14.4) | ||
| College or higher | 60 (12.6) | 9 (8.7) |
The demographic characteristics of the participants shown in Tables 1 and 2 indicated that the stroke sample population consisted of more men than women, more than 75% of all participants were over 45 years of age, and more than 80% were married. Additionally, approximately 70% of all participants had junior high school education or less. Table 2 shows that the proportion of males with stroke was a little higher than that of healthy males, and that among participants over 65 years old, the proportion of stroke patients was slightly higher than that of healthy participants. The average length of time since stroke diagnosis was approximately 6.3 months and 7.2 months for patients in the first item pool reduction phase, and the revaluation and validation phases, respectively.
Item generation
Four domains, 10 subdomains and a pool of 62 items were generated for the Stroke-PROM based on consulting relevant literature, examining other questionnaires, and interviewing 10 patients to ensure that all germane topics were included. The items and construction of the Stroke-PROM tool are described in Additional file 1: Appendices 1–1 and 1–2.
Four chief physicians and five patients (distinguished by different letters of the alphabet) who had attained a high school degree or above participated in the revision of the 62 items of the Stroke-PROM by rating the items according to the CVI (see Table 3).
Table 3.
Content validity index based on grade of patients and experts of preliminary Stroke-PROM
| Item | Rating by experts | Rating by patients | Number giving rating of 3 or 4 | I-CVI | P C | K * | Evaluation | |||||||
|---|---|---|---|---|---|---|---|---|---|---|---|---|---|---|
| A | B | C | D | A | B | C | D | E | ||||||
| PHD 1 | 3 | 4 | 4 | 4 | 3 | 4 | 4 | 4 | 3 | 9 | 1.00 | 0.002 | 1.00 | excellent |
| PHD 2 | 3 | 4 | 4 | 3 | 3 | 4 | 4 | 4 | 3 | 9 | 1.00 | 0.002 | 1.00 | excellent |
| PHD 3 | 2 | 3 | 3 | 2 | 2 | 3 | 3 | 4 | 2 | 5 | 0.56 | 0.246 | 0.42 | fair |
| PHD 4 | 4 | 4 | 4 | 4 | 4 | 4 | 4 | 4 | 4 | 9 | 1.00 | 0.002 | 1.00 | excellent |
| PHD 5 | 2 | 2 | 2 | 1 | 2 | 3 | 3 | 2 | 2 | 2 | 0.22 | 0.070 | 0.16 | fair |
| PHD 6 | 2 | 3 | 2 | 2 | 2 | 2 | 3 | 2 | 1 | 2 | 0.22 | 0.070 | 0.16 | fair |
| PHD 7 | 3 | 4 | 4 | 3 | 4 | 4 | 4 | 4 | 3 | 9 | 1.00 | 0.002 | 1.00 | excellent |
| PHD 8 | 3 | 4 | 4 | 4 | 3 | 4 | 4 | 4 | 4 | 9 | 1.00 | 0.002 | 1.00 | excellent |
| PHD 9 | 2 | 2 | 3 | 3 | 2 | 2 | 3 | 3 | 1 | 4 | 0.44 | 0.246 | 0.26 | fair |
| PHD 10 | 1 | 2 | 1 | 2 | 2 | 2 | 3 | 2 | 2 | 1 | 0.11 | 0.018 | 0.09 | fair |
| PHD 11 | 1 | 2 | 1 | 1 | 2 | 2 | 3 | 2 | 1 | 1 | 0.11 | 0.018 | 0.09 | fair |
| PHD 12 | 3 | 4 | 3 | 4 | 4 | 4 | 4 | 3 | 2 | 8 | 0.89 | 0.014 | 0.89 | excellent |
| PHD 13 | 3 | 2 | 3 | 4 | 3 | 4 | 3 | 3 | 2 | 7 | 0.78 | 0.070 | 0.76 | excellent |
| PHD 14 | 3 | 4 | 4 | 3 | 3 | 4 | 3 | 3 | 2 | 8 | 0.89 | 0.014 | 0.89 | excellent |
| PHD 15 | 3 | 4 | 3 | 3 | 3 | 3 | 4 | 4 | 4 | 9 | 1.00 | 0.002 | 1.00 | excellent |
| PHD 16 | 3 | 3 | 2 | 3 | 2 | 2 | 3 | 4 | 4 | 6 | 0.67 | 0.164 | 0.61 | good |
| PHD 17 | 3 | 4 | 4 | 4 | 4 | 4 | 4 | 3 | 4 | 9 | 1.00 | 0.002 | 1.00 | excellent |
| PHD 18 | 3 | 4 | 2 | 4 | 3 | 3 | 4 | 2 | 4 | 7 | 0.78 | 0.070 | 0.76 | excellent |
| PHD 19 | 3 | 4 | 4 | 4 | 4 | 4 | 4 | 4 | 4 | 9 | 1.00 | 0.002 | 1.00 | excellent |
| PHD 20 | 3 | 3 | 3 | 4 | 4 | 4 | 3 | 4 | 4 | 9 | 1.00 | 0.002 | 1.00 | excellent |
| PHD 21 | 3 | 2 | 4 | 4 | 4 | 4 | 4 | 4 | 3 | 8 | 0.89 | 0.014 | 0.89 | excellent |
| PHD 22 | 3 | 3 | 3 | 3 | 4 | 3 | 3 | 4 | 3 | 9 | 1.00 | 0.002 | 1.00 | excellent |
| PHD 23 | 3 | 4 | 4 | 4 | 4 | 4 | 4 | 4 | 3 | 9 | 1.00 | 0.002 | 1.00 | excellent |
| PSD1 | 4 | 4 | 4 | 4 | 4 | 4 | 4 | 4 | 4 | 9 | 1.00 | 0.002 | 1.00 | excellent |
| PSD2 | 4 | 4 | 4 | 4 | 4 | 4 | 4 | 4 | 4 | 9 | 1.00 | 0.002 | 1.00 | excellent |
| PSD3 | 4 | 4 | 4 | 4 | 4 | 4 | 4 | 4 | 4 | 9 | 1.00 | 0.002 | 1.00 | excellent |
| PSD4 | 4 | 4 | 4 | 4 | 4 | 4 | 4 | 4 | 4 | 9 | 1.00 | 0.002 | 1.00 | excellent |
| PSD5 | 4 | 4 | 4 | 4 | 3 | 4 | 4 | 4 | 3 | 9 | 1.00 | 0.002 | 1.00 | excellent |
| PSD6 | 4 | 4 | 4 | 4 | 3 | 4 | 4 | 4 | 4 | 9 | 1.00 | 0.002 | 1.00 | excellent |
| PSD7 | 3 | 4 | 4 | 4 | 3 | 3 | 4 | 4 | 4 | 9 | 1.00 | 0.002 | 1.00 | excellent |
| PSD8 | 3 | 4 | 4 | 4 | 3 | 4 | 4 | 4 | 4 | 9 | 1.00 | 0.002 | 1.00 | excellent |
| PSD9 | 4 | 4 | 4 | 4 | 4 | 4 | 4 | 4 | 4 | 9 | 1.00 | 0.002 | 1.00 | excellent |
| PSD10 | 4 | 4 | 4 | 4 | 4 | 4 | 4 | 4 | 4 | 9 | 1.00 | 0.002 | 1.00 | excellent |
| PSD11 | 4 | 4 | 4 | 4 | 4 | 4 | 4 | 4 | 4 | 9 | 1.00 | 0.002 | 1.00 | excellent |
| PSD12 | 4 | 4 | 4 | 4 | 4 | 4 | 4 | 4 | 4 | 9 | 1.00 | 0.002 | 1.00 | excellent |
| PSD13 | 3 | 4 | 3 | 4 | 3 | 4 | 4 | 4 | 3 | 9 | 1.00 | 0.002 | 1.00 | excellent |
| PSD14 | 4 | 4 | 4 | 4 | 4 | 4 | 4 | 4 | 4 | 9 | 1.00 | 0.002 | 1.00 | excellent |
| PSD15 | 4 | 4 | 4 | 4 | 4 | 4 | 4 | 4 | 4 | 9 | 1.00 | 0.002 | 1.00 | excellent |
| PSD16 | 4 | 4 | 4 | 4 | 4 | 4 | 4 | 4 | 4 | 9 | 1.00 | 0.002 | 1.00 | excellent |
| PSD17 | 4 | 4 | 4 | 4 | 4 | 4 | 4 | 4 | 4 | 9 | 1.00 | 0.002 | 1.00 | excellent |
| PSD18 | 3 | 4 | 4 | 2 | 3 | 4 | 4 | 3 | 3 | 8 | 0.89 | 0.014 | 0.89 | excellent |
| PSD19 | 4 | 4 | 4 | 4 | 4 | 4 | 4 | 4 | 4 | 9 | 1.00 | 0.002 | 1.00 | excellent |
| PSD20 | 4 | 4 | 4 | 4 | 4 | 4 | 4 | 4 | 4 | 9 | 1.00 | 0.002 | 1.00 | excellent |
| SOD1 | 2 | 4 | 3 | 2 | 2 | 3 | 4 | 4 | 2 | 5 | 0.56 | 0.246 | 0.42 | fair |
| SOD2 | 3 | 4 | 4 | 3 | 3 | 3 | 4 | 4 | 3 | 9 | 1.00 | 0.002 | 1.00 | excellent |
| SOD3 | 3 | 4 | 4 | 4 | 3 | 4 | 4 | 4 | 3 | 9 | 1.00 | 0.002 | 1.00 | excellent |
| SOD4 | 3 | 4 | 4 | 2 | 3 | 4 | 4 | 4 | 3 | 8 | 0.89 | 0.014 | 0.89 | excellent |
| SOD5 | 4 | 4 | 4 | 4 | 4 | 4 | 4 | 4 | 4 | 9 | 1.00 | 0.002 | 1.00 | excellent |
| SOD6 | 3 | 4 | 4 | 4 | 4 | 4 | 4 | 4 | 4 | 9 | 1.00 | 0.002 | 1.00 | excellent |
| SOD7 | 4 | 4 | 4 | 4 | 4 | 4 | 4 | 4 | 4 | 9 | 1.00 | 0.002 | 1.00 | excellent |
| SOD8 | 3 | 4 | 4 | 4 | 3 | 4 | 4 | 4 | 4 | 9 | 1.00 | 0.002 | 1.00 | excellent |
| SOD9 | 4 | 4 | 4 | 4 | 4 | 4 | 4 | 4 | 4 | 9 | 1.00 | 0.002 | 1.00 | excellent |
| SOD10 | 4 | 4 | 4 | 4 | 4 | 4 | 4 | 4 | 4 | 9 | 1.00 | 0.002 | 1.00 | excellent |
| THD1 | 4 | 4 | 4 | 4 | 4 | 4 | 4 | 4 | 4 | 9 | 1.00 | 0.002 | 1.00 | excellent |
| THD2 | 3 | 4 | 4 | 4 | 4 | 4 | 4 | 4 | 4 | 9 | 1.00 | 0.002 | 1.00 | excellent |
| THD3 | 3 | 4 | 4 | 4 | 3 | 4 | 4 | 4 | 3 | 9 | 1.00 | 0.002 | 1.00 | excellent |
| THD4 | 4 | 4 | 4 | 4 | 4 | 4 | 4 | 4 | 4 | 9 | 1.00 | 0.002 | 1.00 | excellent |
| THD5 | 4 | 4 | 4 | 4 | 4 | 4 | 4 | 4 | 4 | 9 | 1.00 | 0.002 | 1.00 | excellent |
| THD6 | 4 | 4 | 4 | 4 | 3 | 4 | 4 | 4 | 4 | 9 | 1.00 | 0.002 | 1.00 | excellent |
| THD7 | 3 | 4 | 4 | 4 | 3 | 4 | 4 | 4 | 3 | 9 | 1.00 | 0.002 | 1.00 | excellent |
| THD8 | 2 | 4 | 4 | 4 | 3 | 4 | 4 | 4 | 3 | 8 | 0.89 | 0.014 | 0.89 | excellent |
| THD9 | 3 | 4 | 4 | 4 | 2 | 3 | 4 | 4 | 2 | 7 | 0.78 | 0.070 | 0.76 | excellent |
Note: Letters A to D represent individual experts; letters A to E represent individual patients; 1 = not relevant, 2 = somewhat relevant, 3 = quite relevant, 4 = highly relevant; CVI, content validity index; I-CVI, Item-level CVI; K*, the multi-rater kappa statistic; PHD, physical domain; PSD, psychological domain; SOD, social domain; THD, therapeutic domain.
On the basis of the CVI results, advice from patients and experts, and the clinical relevance of items, seven items (item PHD3, PHD5, PHD6, PHD9, PHD16, PSD18 and SOD1 shown in Additional file 1: Appendix 1-1) were deleted, and the subdomain of cognition was added. Items PHD10 and PHD11 shown in Additional file 1: Appendix 1-1 were retained based on the advice of patients and experts and other stroke-specific scales. These two items were assimilated into the newly added cognitive subdomain. The following five items were also added: Have you felt any limb abnormalities [such as a burning sensation]?; Do your hands tremble when you reach for or pick up things?; Do you have trouble remembering the date?; When you see an object suddenly, do you struggle to bring its name to mind?; When others talk about your disease, do you prefer not to discuss it? (PHD2, PHD7, PHD10, PHD11 and PSD18 shown in Additional file 1: Appendix 2-1) [13-15]. The CVI values of the five added items were calculated, the K* values of the five added items were all >0.74, and the five added items were rated “excellent.”
Five stroke patients of varying educational levels were interviewed to evaluate their comprehension of each item. Items that were ambiguous, misunderstood or rarely answered were reworded using comprehension tests for patients with stroke. The preliminary scale was developed after modifying the item pool based on the advice of the experts and the outcomes of the comprehension tests. The preliminary scale included 4 domains, 11 subdomains and 60 items. The items were also reordered (see Additional file 1: Appendices 2–1 and 2–2).
Item reduction
The two-step item selection process is described in Tables 4 and 5. This iterative process resulted in a final version that comprised 46 items within 10 subdomains. (The deletion of the compliance subdomain is explained in the next section.) Each subdomain was named according to its constituent items.
Table 4.
Results of the first item-selection phase using CTT and IRT
| Item | SD | Factor loading | Correlation coefficient | CITC | CAID | IRT | Outcome | ||||
|---|---|---|---|---|---|---|---|---|---|---|---|
| α | b 1 | b 2 | b 3 | b 4 | |||||||
| PHD1 | 1.464 | 0.752 | 0.784 | 0.705 | 0.908 | 0.88 | −1.67 | −0.37 | 0.09 | 1.72 | √ |
| PHD2 | 1.423 | 0.706 | 0.763 | 0.712 | 0.906 | 1.13 | −1.85 | −0.39 | −0.12 | 1.16 | √ |
| PHD3 | 1.446 | 0.799 | 0.811 | 0.77 | 0.900 | 1.30 | −1.44 | −0.78 | −0.32 | 0.36 | √ |
| PHD4 | 1.355 | 0.734 | 0.822 | 0.739 | 0.903 | 1.26 | −1.16 | −0.10 | 0.61 | 1.97 | √ |
| PHD5 | 1.320 | 0.845 | 0.799 | 0.825 | 0.894 | 1.59 | −1.78 | −0.71 | −0.34 | 0.25 | √ |
| PHD6 | 1.246 | 0.811 | 0.758 | 0.768 | 0.901 | 1.29 | −2.20 | −0.93 | −0.22 | 0.77 | √ |
| PHD7 | 1.213 | 0.722 | 0.743 | 0.689 | 0.908 | 1.57 | −1.90 | −0.72 | 0.03 | 0.98 | √ |
| PHD8 | 1.439 | 0.781 | 0.835 | 0.628 | 0.869 | 0.53 | −3.23 | −1.31 | −0.32 | 1.77 | X |
| PHD9 | 1.325 | 0.777 | 0.818 | 0.697 | 0.836 | 1.18 | −1.98 | −0.70 | −0.10 | 1.05 | √ |
| PHD10 | 1.266 | 0.801 | 0.802 | 0.777 | 0.804 | 1.29 | −1.71 | −0.97 | −0.49 | 0.95 | √ |
| PHD11 | 1.214 | 0.745 | 0.813 | 0.779 | 0.806 | 1.63 | −1.89 | −0.89 | −0.37 | 0.49 | √ |
| PHD12 | 1.395 | 0.473 | 0.657 | 0.515 | 0.694 | 1.37 | −1.62 | −0.58 | −0.38 | 0.50 | √ |
| PHD13 | 1.310 | 0.514 | 0.664 | 0.584 | 0.659 | 1.15 | −1.89 | −1.11 | −0.53 | 0.61 | √ |
| PHD14 | 1.520 | 0.489 | 0.793 | 0.478 | 0.718 | 0.29 | −4.94 | −2.28 | −0.60 | 2.39 | √ |
| PHD15 | 1.471 | 0.549 | 0.748 | 0.573 | 0.661 | 0.30 | −5.24 | −4.20 | −2.91 | 0.52 | √ |
| PHD16 | 1.582 | 0.786 | 0.739 | 0.634 | 0.789 | 0.47 | −2.40 | −1.77 | −1.07 | 1.19 | √ |
| PHD17 | 1.500 | 0.779 | 0.740 | 0.676 | 0.782 | 0.37 | −3.83 | −2.92 | −1.87 | 0.97 | √ |
| PHD18 | 0.930 | 0.081 | 0.405 | 0.208 | 0.843 | 0.90 | −4.18 | −2.86 | −2.25 | −1.15 | X |
| PHD19 | 1.535 | 0.262 | 0.495 | 0.299 | 0.843 | 0.74 | −2.40 | −0.3 | 0.13 | 1.01 | X |
| PHD20 | 1.756 | 0.709 | 0.789 | 0.643 | 0.787 | 0.87 | −0.31 | 0.16 | 0.47 | 1.27 | √ |
| PHD21 | 1.654 | 0.815 | 0.786 | 0.736 | 0.769 | 0.70 | −1.28 | −0.76 | −0.30 | 0.93 | √ |
| PHD22 | 1.566 | 0.865 | 0.785 | 0.753 | 0.767 | 0.72 | −1.69 | −1.01 | −0.48 | 0.87 | √ |
| PSD1 | 1.387 | 0.718 | 0.769 | 0.66 | 0.828 | 1.00 | −1.64 | −0.29 | 0.24 | 0.94 | √ |
| PSD2 | 1.413 | 0.784 | 0.735 | 0.584 | 0.840 | 1.00 | −1.41 | −0.11 | 0.32 | 2.03 | √ |
| PSD3 | 1.370 | 0.641 | 0.761 | 0.626 | 0.833 | 1.43 | −1.34 | −0.16 | 0.15 | 1.49 | √ |
| PSD4 | 1.264 | 0.679 | 0.750 | 0.704 | 0.822 | 1.76 | −1.60 | −0.63 | −0.26 | 0.85 | √ |
| PSD5 | 1.237 | 0.407 | 0.565 | 0.474 | 0.854 | 1.85 | −1.35 | −0.73 | −0.35 | 0.87 | X |
| PSD6 | 1.319 | 0.566 | 0.697 | 0.592 | 0.838 | 1.58 | −1.38 | −0.12 | 0.23 | 1.65 | √ |
| PSD7 | 1.230 | 0.595 | 0.706 | 0.696 | 0.824 | 1.80 | −1.37 | −0.63 | −0.18 | 1.15 | √ |
| PSD8 | 1.317 | 0.652 | 0.511 | 0.439 | 0.902 | 0.99 | −2.09 | −1.10 | −0.60 | 1.06 | X |
| PSD9 | 1.022 | 0.727 | 0.614 | 0.502 | 0.893 | 1.11 | −3.83 | −1.93 | −1.30 | −0.05 | X |
| PSD10 | 1.183 | 0.648 | 0.692 | 0.695 | 0.876 | 1.71 | −1.83 | −0.85 | −0.60 | 0.65 | √ |
| PSD11 | 1.106 | 0.600 | 0.640 | 0.651 | 0.881 | 1.68 | −2.15 | −1.15 | −0.62 | 0.70 | √ |
| PSD12 | 1.198 | 0.816 | 0.853 | 0.795 | 0.866 | 2.33 | −1.51 | −0.76 | −0.19 | 0.83 | √ |
| PSD13 | 1.271 | 0.791 | 0.778 | 0.755 | 0.870 | 2.90 | −1.32 | −0.30 | 0.05 | 0.87 | √ |
| PSD14 | 1.288 | 0.845 | 0.810 | 0.777 | 0.868 | 2.43 | −1.57 | −0.60 | −0.18 | 0.48 | √ |
| PSD15 | 1.200 | 0.820 | 0.776 | 0.766 | 0.869 | 2.80 | −1.45 | −0.72 | −0.17 | 0.58 | √ |
| PSD16 | 1.128 | 0.551 | 0.724 | 0.609 | 0.645 | 1.91 | −2.35 | −0.99 | −0.35 | 0.50 | √ |
| PSD17 | 1.215 | 0.589 | 0.706 | 0.632 | 0.631 | 1.86 | −1.71 | −0.87 | −0.44 | 0.62 | √ |
| PSD18 | 1.321 | 0.441 | 0.721 | 0.472 | 0.695 | 1.13 | −2.43 | −0.77 | −0.30 | 0.85 | √ |
| PSD19 | 1.222 | 0.515 | 0.655 | 0.485 | 0.689 | 1.61 | −1.60 | −1.02 | −0.59 | 0.60 | √ |
| PSD20 | 1.310 | 0.325 | 0.528 | 0.305 | 0.759 | 0.73 | −3.44 | −1.53 | −1.08 | 0.63 | X |
| SOD1 | 1.403 | 0.658 | 0.578 | 0.382 | 0.776 | 0.72 | −1.68 | −0.04 | 1.14 | 2.59 | X |
| SOD2 | 1.495 | 0.221 | 0.594 | 0.327 | 0.797 | 0.86 | −1.86 | −0.71 | 0.10 | 1.06 | X |
| SOD3 | 1.502 | 0.632 | 0.761 | 0.580 | 0.709 | 1.07 | −1.58 | −0.34 | 0.35 | 1.04 | √ |
| SOD4 | 1.384 | 0.728 | 0.869 | 0.751 | 0.649 | 1.56 | −1.47 | −0.36 | 0.16 | 0.97 | √ |
| SOD5 | 1.365 | 0.651 | 0.800 | 0.701 | 0.669 | 1.88 | −1.55 | −0.45 | 0.01 | 0.62 | √ |
| SOD6 | 1.608 | 0.835 | 0.867 | 0.614 | 0.694 | 0.20 | −4.51 | −3.13 | −2.34 | 3.21 | √ |
| SOD7 | 1.205 | 0.695 | 0.705 | 0.573 | 0.718 | 0.37 | −6.67 | −3.95 | −3.14 | 1.58 | √ |
| SOD8 | 1.589 | 0.765 | 0.849 | 0.612 | 0.694 | 0.27 | −3.91 | −2.27 | −1.66 | 2.69 | √ |
| SOD9 | 1.114 | 0.619 | 0.610 | 0.526 | 0.742 | 0.50 | −5.02 | −4.03 | −2.72 | 1.34 | √ |
| THD1 | 0.961 | 0.362 | 0.650 | 0.304 | 0.451 | 0.39 | −8.45 | −6.33 | −4.91 | −0.72 | X |
| THD 2 | 1.348 | 0.512 | 0.772 | 0.413 | 0.232 | 0.38 | −6.18 | −3.55 | −1.78 | −0.47 | X |
| THD3 | 1.438 | 0.500 | 0.743 | 0.277 | 0.501 | 0.38 | −5.01 | −0.74 | 0.64 | 2.52 | X |
| THD 4 | 1.265 | 0.585 | 0.694 | 0.495 | 0.835 | 0.37 | −6.29 | −3.13 | −1.75 | 2.30 | √ |
| THD 5 | 1.090 | 0.741 | 0.753 | 0.643 | 0.807 | 0.56 | −5.18 | −3.67 | −1.61 | 1.13 | √ |
| THD 6 | 1.299 | 0.732 | 0.785 | 0.662 | 0.801 | 0.55 | −4.09 | −2.25 | −0.90 | 1.30 | √ |
| THD 7 | 1.440 | 0.716 | 0.751 | 0.574 | 0.823 | 0.33 | −4.23 | −0.36 | 1.31 | 4.26 | √ |
| THD 8 | 1.111 | 0.833 | 0.804 | 0.728 | 0.792 | 0.45 | −8.11 | −3.77 | −1.71 | 1.14 | √ |
| THD 9 | 1.242 | 0.748 | 0.745 | 0.619 | 0.810 | 0.62 | −3.61 | −2.49 | −1.06 | 1.23 | √ |
Note: CTT, classical test theory; IRT, item response theory; SD, Standard Deviation; CITC, corrected item-total correlation; CAID, Cronbach’s α if item deleted; PHD, physical domain; PSD, psychological domain; SOD, social domain; THD, therapeutic domain; "√" decision to retain the selected item, "X" to delete the item; boldface indicates values that did not meet standard.
Table 5.
Results of the second item-selection phase using CTT and IRT
| Item | SD | Factor loading | Correlation coefficient | CITC | CAID | IRT | Outcome | ||||
|---|---|---|---|---|---|---|---|---|---|---|---|
| α | b 1 | b 2 | b 3 | b 4 | |||||||
| PHD1 | 1.526 | 0.745 | 0.685 | 0.527 | 0.777 | 0.54 | −2.65 | −1.22 | −0.31 | 1.40 | √ |
| PHD2 | 1.467 | 0.805 | 0.638 | 0.473 | 0.786 | 0.68 | −2.59 | −1.11 | −0.36 | 1.06 | √ |
| PHD3 | 1.543 | 0.643 | 0.658 | 0.488 | 0.785 | 0.88 | −0.94 | −0.06 | 0.71 | 1.80 | √ |
| PHD4 | 1.350 | 0.659 | 0.687 | 0.551 | 0.771 | 1.14 | −2.08 | −1.18 | −0.62 | 0.22 | √ |
| PHD5 | 1.230 | 0.828 | 0.726 | 0.616 | 0.762 | 1.30 | −2.33 | −1.37 | −0.73 | −0.19 | √ |
| PHD6 | 1.218 | 0.818 | 0.671 | 0.547 | 0.773 | 1.00 | −2.79 | −1.61 | −0.72 | 0.58 | √ |
| PHD7 | 1.293 | 0.628 | 0.686 | 0.557 | 0.771 | 1.02 | −2.51 | −1.45 | −0.46 | 0.44 | √ |
| PHD8 | 1.282 | 0.784 | 0.805 | 0.637 | 0.710 | 1.14 | −2.23 | −1.17 | −0.31 | 0.77 | √ |
| PHD9 | 1.314 | 0.737 | 0.812 | 0.642 | 0.706 | 1.27 | −1.84 | −0.87 | −0.12 | 0.92 | √ |
| PHD10 | 1.230 | 0.666 | 0.777 | 0.602 | 0.728 | 1.58 | −1.94 | −1.06 | −0.45 | 0.33 | √ |
| PHD11 | 1.491 | 0.560 | 0.733 | 0.470 | 0.677 | 1.38 | −1.33 | −0.65 | −0.23 | 0.47 | √ |
| PHD12 | 1.349 | 0.673 | 0.759 | 0.546 | 0.627 | 1.53 | −1.61 | −0.91 | −0.33 | 0.33 | √ |
| PHD13 | 1.390 | 0.515 | 0.732 | 0.497 | 0.783 | 1.05 | −1.84 | −0.68 | 0.00 | 1.25 | √ |
| PHD14 | 1.305 | 0.807 | 0.711 | 0.481 | 0.666 | 0.77 | −3.04 | −1.74 | −0.80 | 0.83 | √ |
| PHD15 | 1.329 | 0.772 | 0.739 | 0.519 | 0.643 | 0.93 | −2.19 | −1.68 | −0.98 | 0.43 | √ |
| PHD16 | 1.553 | 0.766 | 0.833 | 0.744 | 0.931 | 1.23 | −1.12 | −0.63 | −0.19 | 0.66 | √ |
| PHD17 | 1.546 | 0.865 | 0.893 | 0.833 | 0.915 | 1.11 | −1.17 | −0.64 | −0.03 | 0.87 | √ |
| PHD18 | 1.679 | 0.836 | 0.873 | 0.794 | 0.922 | 1.29 | −0.46 | 0.04 | 0.40 | 1.03 | √ |
| PHD19 | 1.663 | 0.888 | 0.913 | 0.857 | 0.910 | 1.27 | −0.59 | −0.13 | 0.23 | 0.97 | √ |
| PHD20 | 1.606 | 0.896 | 0.925 | 0.879 | 0.906 | 1.35 | −0.77 | −0.26 | 0.13 | 0.93 | √ |
| PSD1 | 1.461 | 0.719 | 0.763 | 0.597 | 0.809 | 0.88 | −1.53 | −0.37 | 0.20 | 1.86 | √ |
| PSD2 | 1.303 | 0.714 | 0.754 | 0.606 | 0.805 | 1.12 | −2.21 | −0.67 | −0.03 | 1.36 | √ |
| PSD3 | 1.271 | 0.763 | 0.780 | 0.649 | 0.793 | 1.38 | −1.93 | −0.85 | −0.26 | 0.99 | √ |
| PSD4 | 1.338 | 0.703 | 0.768 | 0.622 | 0.800 | 1.25 | −1.54 | −0.37 | 0.21 | 1.74 | √ |
| PSD5 | 1.296 | 0.756 | 0.806 | 0.684 | 0.783 | 1.50 | −1.67 | −0.59 | −0.01 | 1.18 | √ |
| PSD6 | 1.232 | 0.635 | 0.709 | 0.546 | 0.849 | 1.78 | −1.74 | −0.84 | −0.28 | 0.72 | √ |
| PSD7 | 1.225 | 0.507 | 0.786 | 0.656 | 0.821 | 1.65 | −1.83 | −0.91 | −0.34 | 0.79 | √ |
| PSD8 | 1.260 | 0.669 | 0.843 | 0.738 | 0.799 | 1.88 | −1.62 | −0.81 | −0.24 | 0.74 | √ |
| PSD9 | 1.302 | 0.742 | 0.806 | 0.676 | 0.816 | 1.93 | −1.53 | −0.53 | −0.19 | 0.78 | √ |
| PSD10 | 1.236 | 0.767 | 0.811 | 0.693 | 0.811 | 2.18 | −1.66 | −0.75 | −0.37 | 0.48 | √ |
| PSD11 | 1.229 | 0.556 | 0.808 | 0.649 | 0.730 | 2.07 | −1.72 | −0.81 | −0.27 | 0.59 | √ |
| PSD12 | 1.264 | 0.626 | 0.847 | 0.709 | 0.698 | 2.12 | −1.55 | −0.73 | −0.20 | 0.62 | √ |
| PSD13 | 1.352 | 0.647 | 0.758 | 0.544 | 0.783 | 1.28 | −1.93 | −0.88 | −0.26 | 0.64 | √ |
| PSD14 | 1.256 | 0.430 | 0.748 | 0.550 | 0.777 | 1.76 | −1.62 | −0.87 | −0.39 | 0.71 | √ |
| SOD1 | 1.486 | 0.797 | 0.885 | 0.745 | 0.914 | 1.28 | −1.41 | −0.19 | −0.26 | 1.05 | √ |
| SOD2 | 1.464 | 0.878 | 0.943 | 0.868 | 0.811 | 1.55 | −1.20 | −0.25 | 0.25 | 0.96 | √ |
| SOD3 | 1.511 | 0.825 | 0.920 | 0.814 | 0.857 | 1.63 | −1.13 | −0.20 | 0.19 | 0.76 | √ |
| SOD4 | 1.560 | 0.744 | 0.848 | 0.688 | 0.784 | 0.22 | −5.34 | −3.21 | −2.21 | 2.39 | √ |
| SOD5 | 1.233 | 0.833 | 0.813 | 0.680 | 0.788 | 0.39 | −6.31 | −3.12 | −2.02 | 1.70 | √ |
| SOD6 | 1.510 | 0.790 | 0.852 | 0.704 | 0.774 | 0.28 | −4.74 | −2.26 | −1.35 | 2.60 | √ |
| SOD7 | 1.189 | 0.766 | 0.766 | 0.616 | 0.814 | 0.44 | −5.74 | −3.72 | −2.61 | 1.12 | √ |
| THD1 | 1.026 | 0.817 | 0.820 | 0.736 | 0.825 | 0.54 | −6.29 | −4.54 | −1.95 | 0.33 | √ |
| THD 2 | 1.140 | 0.743 | 0.798 | 0.692 | 0.831 | 0.47 | −6.03 | −3.89 | −2.11 | 0.73 | √ |
| THD 3 | 1.252 | 0.666 | 0.711 | 0.549 | 0.861 | 0.33 | −6.00 | −2.44 | 1.08 | 4.05 | X |
| THD 4 | 1.080 | 0.750 | 0.736 | 0.614 | 0.845 | 0.50 | −6.89 | −4.28 | −1.91 | 0.59 | √ |
| THD 5 | 1.022 | 0.773 | 0.775 | 0.674 | 0.835 | 0.54 | −6.19 | −4.46 | −2.26 | 0.28 | √ |
| THD 6 | 1.151 | 0.783 | 0.796 | 0.687 | 0.831 | 0.59 | −5.00 | −3.19 | −1.31 | 0.79 | √ |
Note: CTT, classical test theory; IRT, item response theory; SD, Standard Deviation; CITC, corrected item-total correlation; CAID, Cronbach’s α if item deleted ;"√" decision to retain the selected item, "X" to delete the item; boldface indicates values that did not meet standard.
First item-selection phase based on CTT and IRT
Five statistical methods (within CTT and IRT) were used to select items. Any item recommended for deletion by two or more methods was deleted. All items were deleted or added based on their item selection results, their clinical importance, and other stroke-specific scales (see Table 4).
As seen in Table 4, 12 items were removed; however, PHD8 (Do you remember what happened two days ago?) was not deleted, because previously published results indicate that this item is crucial for the assessment of cognition [15]. PSD1 (Are you more prone to worry since your illness?) and PSD2 (Do you get angry easily?) did not discriminate well, so PSD2 was deleted in accord with the opinion of patients and experts. PSD15 (Have you felt depressed while in a cheerful atmosphere?) was deleted because it was not deemed closely relevant to stroke. As a result, 13 items (PHD18, PHD19, PSD2, PSD5, PSD8, PSD9, PSD15, PSD20, SOD1, SOD2, THD1, THD2, THD3; Additional file 1: Appendix 2-1 ) were deleted. All items in the compliance subdomain (THD1, THD2, THD3) were deleted; thus, this subdomain was also deleted [13-15].
Therefore, the initial scale contained 47 items, 10 subdomains, and 4 domains (see Appendices 3–1 and 3–2).
Revaluation phase based on CTT and IRT
To ensure the reliability and validity of each item included in the initial scale, we revaluated the items in this scale based on a second item selection. The evaluation results suggested that all items were perfect, except for item THD3. Thus, CTT and IRT analyses in the revaluation phase led to deletion of item THD3 (Are you satisfied with your medical expenses?) (see Table 5). As a result, the final scale contained 46 items, 10 subdomains, 4 domains (see Tables 6 and 7). This revision of the Stroke-PROM is described in Table 8.
Table 6.
Bank of 46 items in the final Stroke-PROM
| Item | Item |
|---|---|
| PHD1. Have you felt numbness in your lips or limbs? | PSD4. Do you worry about your condition getting worse? |
| PHD2. Have you felt any limb abnormalities (such as a burning sensation)? | PSD5. Have you felt upset? |
| PHD3. Have you felt limb weakness on just the sick side of your body? | PSD6. Have you felt depressed and passionless? |
| PHD4. Have you had facial paralysis on one side, and saliva dripping from your mouth? | PSD7. Have you felt frustrated, pessimistic, or in despair about your illness? |
| PHD5. Have you had difficulty swallowing? | PSD8. Have you felt uninterested in things and people around you? |
| PHD6. Have you experienced gagging while eating or drinking? | PSD9. Do you consider yourself a burden on your family? |
| PHD7. Do your hands tremble when you reach for or pick up things? | PSD10. Have you felt hopeless? |
| PHD8. Do you find it very difficult to focus on one thing? | PSD11. Do you not want to associate with others? |
| PHD9. Do you have trouble remembering the date? | PSD12. Do you come up with excuses to avoid social activities? |
| PHD10. When you see an object suddenly, do you struggle to bring its name to mind? | PSD13. When others talk about your disease, do you prefer not to discuss it? |
| PHD11. Do you have difficulty speaking (such as stammering, unclear enunciation, or pauses)? | PSD14. Have you felt unconfident? |
| PHD 12. Do you need to repeat yourself to others so that they can understand what you mean? | SOD1. Has your illness affected your family life? |
| PHD13. Do you remember what happened two days ago? | SOD2. Have you reduced contact with your acquaintances and friends due to your illness? |
| PHD14. Can you understand what others are saying? | SOD3. Have you avoided some social or family activities due to your illness? |
| PHD15. Can you recall your children’s or parents’ names? | SOD4. Is your family taking care of your daily life needs? |
| PHD16. Can you twist a door handle to open the door by yourself? | SOD5. Have your relatives and friends expressed concern about your condition? |
| PHD17. Can you take care of your own daily needs (such as dressing and bathing)? | SOD6. Has your family reminded you to take your medicine? |
| PHD18. Can you purchase your daily necessities alone (for example, by going shopping)? | SOD7. Does your family understand you? |
| PHD19. Can you walk up and down stairs alone? | THD1. Are you satisfied with the current effects of your treatment? |
| PHD20. Can you do light housework (such as making your bed)? | THD2. Are you satisfied with the medical treatment service you receive? |
| PSD1. Are you more prone to worry since your illness? | THD3. Has treatment at this stage had the effect of reducing your symptoms? |
| PSD2. Do you struggle to be patient with others? | THD4. Would you like to continue to maintain your current treatment schedule? |
| PSD3. Do you often feel nervous? | THD5. Has your overall confidence improved since you have been receiving treatment? |
Note: PHD, physical domain; PSD, psychological domain; SOD, social domain; THD, therapeutic domain.
Table 7.
Scale structure of the bank of 46 items of the final Stroke-PROM
| Domain | Subdomain | Item |
|---|---|---|
| Physical domain (PHD) | Somatic symptom (SOS) | 1-, 2-, 3-, 4-, 5-, 6-, 7- |
| Cognition (COG) | 8-, 9-, 10-, 13 | |
| Verbal communication (VEC) | 11-, 12-, 14, 15 | |
| Self-help skills (SHS) | 16, 17, 18, 19, 20 | |
| Psychological domain (PSD) | Anxiety (ANX) | 1-, 2-, 3-, 4-, 5- |
| Depression (DEP) | 6-, 7-, 8-, 9-, 10- | |
| Avoidance (AVO) | 11-, 12-, 13-, 14- | |
| Social domain (SOD) | Social contacts (SOC) | 1-, 2-, 3- |
| Family support (FAS) | 4, 5, 6, 7 | |
| Therapeutic domain (THD) | Satisfaction (SAT) | 1, 2, 3, 4, 5 |
Note: “-” indicates a reverse-scored item.
Table 8.
Process of revising the Stroke-PROM
| Formation of preliminary items | Formation of preliminary scale | Formation of initial scale | Formation of final scale | |
|---|---|---|---|---|
| Number of items | 62 | 60 | 47 | 46 |
| Number of domains | 4 | 4 | 4 | 4 |
| Number of subdomains | 10 | 11 (cognition subdomain was added) | 10 (compliance subdomain was deleted) | 10 |
| Number of deleted items | — | 7 (PHD3, PHD5, PHD6, PHD9, PHD16, PSD18, SOD1 of Additional file 1: Appendix 1-1) | 13 (PHD18, PHD19, PSD2, PSD5, PSD8, PSD9, PSD15, PSD20, SOD1, SOD2, THD1, THD2, THD3 of Additional file 1: Appendix 2-1) | 1 (THD3 of Additional file 1: Appendix 3-1) |
| Method used for deleting items | — | I-CVI (PHD3, PHD5, PHD6, PHD9, SOD1); Opinions of patients and clinical experts, reference to other scales (PHD16, PSD18) | CTT and IRT (PHD18, PHD19, PSD5, PSD8, PSD9, PSD20, SOD1, SOD2, THD1); IRT, opinions of patients and clinical experts, reference to other scales (THD2, THD3); Opinions of patients and clinical experts, reference to other scales (PSD2, PSD15) | CTT and IRT (THD3) |
| Number of added items | — | 5 (PHD2, PHD7, PHD10, PHD11, PSD18 of Additional file 1: Appendix 2-1) | 0 | 0 |
| Method used for adding items | — | Opinions of patients and clinical experts, reference to other scales | — | — |
Note: PHD, physical domain; PSD, psychological domain; SOD, social domain; THD, therapeutic domain.
Evaluation of the scale
The validity, reliability, and responsiveness of the remaining 46 items were assessed and the results are presented in the sections below.
Content validity
The content validity was achieved as outlined in the Methods and was confirmed using the values obtained for the CVIs (see Table 3 and “Item generation” in the Results).
Construct validity
We conducted confirmatory factor analysis (CFA) on the 46 Stroke-PROM items. The index of fit (GFI, RMR, NFI, NNFI, CFI, IFI) met the standard requirements (see Table 9).
Table 9.
Goodness of fit statistics of the Stroke-PROM
| Domain | GFI | RMR | NFI | NNFI | CFI | IFI |
|---|---|---|---|---|---|---|
| PHD | 0.79 | 0.086 | 0.88 | 0.88 | 0.90 | 0.90 |
| PSD | 0.89 | 0.058 | 0.95 | 0.95 | 0.96 | 0.96 |
| SOD | 0.90 | 0.092 | 0.92 | 0.88 | 0.93 | 0.93 |
| THD | 0.94 | 0.043 | 0.95 | 0.91 | 0.96 | 0.96 |
Note: PHD, physical domain; PSD, psychological domain; SOD, social domain; THD, therapeutic domain; GFI, goodness-of-fit index; NFI, normed fit index; NNFI, non-normed fit index; IFI, incremental fit index; CFI, comparative fit index; RMR, root mean square residual.
Table 10 presents the 10 subdomains, their corresponding items and standardized factor loadings produced from the CFA. The standardized factor loadings for each of the 46 Stroke-PROM items were above 0.5, except for items PHD1, PHD2, and PHD3; however, these three items were recommended for retention by the results of CTT and IRT analyses. The results indicated that the 46 items showed salient loadings on their specific subdomains, and these 10 subdomains correlated well with the 10 that were conceptualized in the design phase and indicated good construct validity.
Table 10.
Maximum likelihood estimation of CFA for the Stroke-PROM
| Subdomain | Item | Non-standardized factor loading | Standard error | t | R 2 | Non-standardized factor loading error var | Standardized factor loading | Standardized factor loading error var |
|---|---|---|---|---|---|---|---|---|
| SOS | PHD1 | 0.67 | 0.07 | 9.40 | 0.20 | 1.87 | 0.44 | 0.80 |
| PHD2 | 0.56 | 0.07 | 8.05 | 0.15 | 1.83 | 0.38 | 0.85 | |
| PHD3 | 0.67 | 0.07 | 9.25 | 0.19 | 1.93 | 0.44 | 0.81 | |
| PHD4 | 0.89 | 0.06 | 15.17 | 0.44 | 1.02 | 0.66 | 0.56 | |
| PHD5 | 1.01 | 0.05 | 20.25 | 0.67 | 0.50 | 0.82 | 0.33 | |
| PHD6 | 0.93 | 0.05 | 18.25 | 0.58 | 0.62 | 0.76 | 0.42 | |
| PHD7 | 0.84 | 0.06 | 14.91 | 0.43 | 0.96 | 0.65 | 0.57 | |
| COG | PHD8 | 0.93 | 0.06 | 16.79 | 0.53 | 0.77 | 0.73 | 0.47 |
| PHD9 | 0.94 | 0.06 | 16.50 | 0.51 | 0.84 | 0.72 | 0.49 | |
| PHD10 | 0.92 | 0.05 | 17.38 | 0.56 | 0.67 | 0.75 | 0.44 | |
| VEC | PHD11 | 1.02 | 0.07 | 15.41 | 0.47 | 1.18 | 0.68 | 0.53 |
| PHD12 | 1.02 | 0.06 | 17.35 | 0.57 | 0.79 | 0.75 | 0.43 | |
| COG | PHD13 | 0.82 | 0.06 | 12.96 | 0.35 | 1.25 | 0.59 | 0.65 |
| VEC | PHD14 | 0.65 | 0.06 | 10.49 | 0.25 | 1.28 | 0.50 | 0.75 |
| PHD15 | 0.71 | 0.06 | 11.37 | 0.28 | 1.27 | 0.53 | 0.72 | |
| SHS | PHD16 | 1.17 | 0.06 | 19.09 | 0.57 | 1.04 | 0.76 | 0.43 |
| PHD17 | 1.30 | 0.06 | 22.31 | 0.70 | 0.71 | 0.84 | 0.30 | |
| PHD18 | 1.40 | 0.06 | 22.10 | 0.69 | 0.86 | 0.83 | 0.31 | |
| PHD19 | 1.52 | 0.06 | 25.72 | 0.84 | 0.45 | 0.91 | 0.16 | |
| PHD20 | 1.50 | 0.06 | 26.74 | 0.87 | 0.33 | 0.93 | 0.13 | |
| ANX | PSD1 | 0.90 | 0.06 | 14.01 | 0.38 | 1.32 | 0.62 | 0.62 |
| PSD2 | 0.83 | 0.06 | 14.45 | 0.40 | 1.02 | 0.63 | 0.60 | |
| PSD3 | 0.92 | 0.05 | 17.14 | 0.52 | 0.77 | 0.72 | 0.48 | |
| PSD4 | 0.99 | 0.06 | 17.74 | 0.55 | 0.81 | 0.74 | 0.45 | |
| PSD5 | 1.04 | 0.05 | 19.85 | 0.64 | 0.60 | 0.80 | 0.36 | |
| DEP | PSD6 | 0.79 | 0.05 | 14.88 | 0.41 | 0.89 | 0.64 | 0.59 |
| PSD7 | 0.87 | 0.05 | 17.05 | 0.51 | 0.74 | 0.71 | 0.49 | |
| PSD8 | 1.02 | 0.05 | 20.57 | 0.66 | 0.54 | 0.81 | 0.34 | |
| PSD9 | 0.96 | 0.05 | 18.02 | 0.55 | 0.77 | 0.74 | 0.45 | |
| PSD10 | 0.95 | 0.05 | 18.88 | 0.59 | 0.63 | 0.77 | 0.41 | |
| AVO | PSD11 | 0.97 | 0.05 | 19.25 | 0.62 | 0.57 | 0.79 | 0.38 |
| PSD12 | 1.04 | 0.05 | 20.31 | 0.67 | 0.53 | 0.82 | 0.33 | |
| PSD13 | 0.81 | 0.06 | 13.53 | 0.36 | 1.17 | 0.60 | 0.64 | |
| PSD14 | 0.80 | 0.06 | 14.56 | 0.41 | 0.93 | 0.64 | 0.59 | |
| SOC | SOD1 | 1.16 | 0.06 | 19.83 | 0.61 | 0.86 | 0.78 | 0.39 |
| SOD2 | 1.40 | 0.05 | 26.97 | 0.92 | 0.17 | 0.96 | 0.08 | |
| SOD3 | 1.33 | 0.06 | 23.42 | 0.77 | 0.53 | 0.88 | 0.23 | |
| FAS | SOD4 | 1.27 | 0.06 | 19.81 | 0.66 | 0.82 | 0.81 | 0.34 |
| SOD5 | 0.88 | 0.05 | 16.63 | 0.51 | 0.75 | 0.71 | 0.49 | |
| SOD6 | 1.23 | 0.06 | 19.83 | 0.66 | 0.77 | 0.81 | 0.34 | |
| SOD7 | 0.77 | 0.05 | 14.67 | 0.42 | 0.82 | 0.65 | 0.58 | |
| SAT | THD1 | 0.83 | 0.04 | 20.28 | 0.66 | 0.36 | 0.81 | 0.34 |
| THD2 | 0.81 | 0.05 | 16.69 | 0.50 | 0.65 | 0.71 | 0.50 | |
| THD4 | 0.78 | 0.05 | 17.08 | 0.52 | 0.56 | 0.72 | 0.48 | |
| THD5 | 0.77 | 0.04 | 18.22 | 0.57 | 0.45 | 0.75 | 0.43 | |
| THD6 | 0.85 | 0.05 | 17.71 | 0.55 | 0.60 | 0.74 | 0.45 |
Note: PHD, physical domain; PSD, psychological domain; SOD, social domain; THD, therapeutic domain; SOS, somatic symptom; COG, cognition; VEC, verbal communication; SHS, self-help skills; ANX, anxiety; DEP, depression; AVO, avoidance; SOC, social contacts; FAS, family support; COM, compliance; SAT, satisfaction.
Reliability
Cronbach’s α coefficient ≥0.70 is considered acceptable for internal consistency. Cronbach’s α coefficient was 0.905 for the total score, and for the four domains, it ranged from 0.861 to 0.908. These results indicated high internal consistency (see Table 11).
Table 11.
Cronbach’s α coefficient of four domains and total scale
| Domain | Cronbach’s α coefficient |
|---|---|
| Physical | 0.888 |
| Psychological | 0.908 |
| Social | 0.879 |
| Therapeutic | 0.861 |
| Total | 0.905 |
Discriminant validity
The discriminant validity of each subdomain was examined by comparing mean scores across healthy participants and the groups of stroke patients as defined by their modified Rankin scores. Table 12 indicates that the scales for 9 of the 10 subdomains were significantly different across healthy participants and stroke patients with different degrees of disability and dependence as defined by the modified Rankin scale. Because healthy participants were not treated and therefore could not answer the items in the treatment domain, no comparison of healthy participants was made for the SAT subdomain. However, the SAT subdomain scores for the stroke patient population was not significantly different across the Rankin levels. Overall, the Stroke-PROM was able to differentiate between healthy participants and stroke patients with varying degrees of disability and dependence as defined by the modified Rankin scale.
Table 12.
Subdomain scores obtained using the Stroke-PROM instrument in healthy controls and stroke patients with varying degrees of disability and dependence as defined by the modified Rankin scale (mean ± SD)
| Sub-domain | Control | Rankin level | F | P | |||||
|---|---|---|---|---|---|---|---|---|---|
| 0 | 1 | 2 | 3 | 4 | 5 | ||||
| SOS | 32.95 ± 3.02 | 27.90 ± 6.57 | 26.31 ± 6.20 | 24.85 ± 6.30 | 24.53 ± 6.35 | 25.98 ± 4.96 | 23.46 ± 6.96 | 25.652 | <0.001 |
| COG | 19.33 ± 2.27 | 16.59 ± 3.80 | 15.69 ± 3.78 | 13.32 ± 3.32 | 13.33 ± 3.38 | 13.86 ± 3.31 | 13.42 ± 4.79 | 32.806 | <0.001 |
| VEC | 19.43 ± 1.98 | 17.96 ± 3.09 | 16.45 ± 3.26 | 14.22 ± 2.82 | 12.54 ± 3.37 | 13.81 ± 3.00 | 12.62 ± 4.51 | 59.779 | <0.001 |
| SHS | 23.61 ± 3.03 | 24.33 ± 1.59 | 19.39 ± 3.16 | 15.68 ± 2.03 | 12.19 ± 2.33 | 8.91 ± 1.94 | 5.59 ± 1.26 | 769.629 | <0.001 |
| ANX | 22.85 ± 2.90 | 17.61 ± 5.03 | 17.55 ± 5.31 | 17.34 ± 4.31 | 16.88 ± 4.51 | 16.07 ± 5.17 | 15.93 ± 5.86 | 21.911 | <0.001 |
| DEP | 24.11 ± 2.11 | 21.04 ± 4.26 | 19.09 ± 4.71 | 18.44 ± 4.30 | 17.83 ± 4.90 | 17.45 ± 5.13 | 17.87 ± 5.71 | 25.407 | <0.001 |
| AVO | 19.36 ± 1.75 | 16.79 ± 3.38 | 15.29 ± 3.89 | 14.00 ± 3.89 | 14.10 ± 3.43 | 14.26 ± 4.02 | 14.70 ± 4.97 | 24.756 | <0.001 |
| SOC | 14.49 ± 1.55 | 11.88 ± 3.87 | 9.03 ± 4.09 | 9.63 ± 2.95 | 9.95 ± 3.61 | 9.48 ± 3.70 | 8.72 ± 4.43 | 31.575 | <0.001 |
| FAS | 8.76 ± 4.72 | 14.27 ± 4.82 | 14. 90 ± 3.95 | 15.12 ± 4.95 | 14.33 ± 4.35 | 15.48 ± 4.49 | 16.25 ± 4.56 | 28.217 | <0.001 |
| SAT | -- | 24.19 ± 4.83 | 24.30 ± 4.32 | 22.90 ± 6.23 | 23.35 ± 5.61 | 21.88 ± 5.99 | 24.03 ± 5.40 | 1.929 | >0.050 |
| n | 104 | 135 | 123 | 41 | 58 | 42 | 76 | ||
Note: SOS, somatic symptom; COG, cognition; VEC, verbal communication; SHS, self-help skills; ANX, anxiety; DEP, depression; AVO, avoidance; SOC, social contacts; FAS, family support; SAT, satisfaction.
Feasibility
Both the response rate and the completion rate of the Stroke-PROM tool were more than 97%. The average completion time was 8.9 minutes.
Discussion
In this study, we developed and validated a Stroke-PROM for use in the evaluation of outcomes for patients with stroke. The US Food and Drug Administration (FDA) has highlighted the importance of the use of PRO in clinical trials and provided guidance regarding the development of PROMs [24]. The development strategy for the Stroke-PROM in this study complied with those guidelines. To the best of our knowledge, this is the first Stroke-PROM specifically developed and validated for use in clinical trials of new drugs with stroke to include physical, psychological, social and therapeutic domains [25].
The most commonly used stroke-specific measures, the National Institutes of Health Stroke Scale and the Canadian Neurological Scale are clinician-reported outcome measures that assess only the physical aspects of stroke [26-28]. Although the Stroke Impact Scale Version 2.0, the Stroke and Aphasia Quality of Life Scale-39, the Newcastle Stroke-Specific Quality of Life Measure, and the Stroke-Specific Quality of Life measures are all multidimensional PRO measures, no measures have been developed that assess the subdomains of family support and patient satisfaction with treatment [13-15,29]. In contrast to other stroke-specific instruments, our instrument includes these subdomains and therefore fills a gap in the research arena for a stroke PROM [13-15,29-31].
Stroke has considerable adverse physical and psychological impacts on patients over time. Stroke patients need help, understanding and care from their families [32]. Indeed, a growing body of research demonstrates the importance of family relationships for the recovery of functional capacity after stroke [33,34]. A stroke survivor’s family is often the most important source of long-term support during the patients’ recovery and treatment, and family support plays a significant role throughout the poststroke recovery period [35-38]. Family can supply the stroke survivor with physical and mental support, such as providing care in daily life and understanding [39]. Therefore, family support is a necessary addition to the Stroke-PROM.
Satisfaction with treatment is a main outcome measure in new drug clinical trials [24,40]. A Stroke-PROM tool can be used to measure treatment benefit or risk during clinical trials for medical products. Additionally, Stroke-PROM instruments provide optimal information from the patient’s perspective for use in drawing conclusions about the effectiveness of treatment [24]. Thus, the inclusion of a subdomain for treatment satisfaction provides an opportunity for new drug clinical trial participants to integrate into the overall evaluation the different aspects of their responses to treatment, including pain relief, function improvement, and side effects, as well as to provide feedback about the potential acceptability of a new drug and their overall trust in the drug treatment [24,41,42]. Therefore, the subdomain of satisfaction with treatment is also a prudent addition to the Stroke-PROM.
The Stroke-PROM presented here would complement existing stroke-specific measures and has particular value for extending our understanding of the impact of family support and patient satisfaction with treatment in clinical trials of new drugs for stroke. During clinical trials, the Stroke-PROM can be used to simultaneously measure the effect of a medical intervention on several concepts, that is, the measured parameter, such as a symptom or group of symptoms, the medical intervention effects on a particular function or group of functions, or a group of symptoms or functions shown to measure the severity of a health condition. The use of the Stroke-PROM as an outcome measure in clinical trials may facilitate evaluation of the effectiveness across several therapeutic modalities. From the researcher’s perspective, the scale may capture the patient’s experience and treatment benefit or risk, assist researchers in determining which patients with stroke benefit meaningfully from treatment, and facilitate between-trial comparisons [24]. From the pharmaceutical company’s perspective, such an instrument may increase the efficiency of discussions with the FDA during the medical product development process, and provide optimal information from a patient’s perspective for use in making conclusions about treatment effects at the time of medical product approval [24]. From a regulatory perspective, the Stroke-PROM tool may provide a standardized method for assessing treatment effectiveness on basic symptoms so that claims can be supported with PRO evidence in medical product clinical trials [43].
In contrast to the development of other stroke-specific instruments, our study used I-CVI, IRT and CFA as rigorous evidence for item selection, validity and reliability. First, content validity is an essential step in the development of any new scale. None of the previously developed instruments for stroke used statistical methods such as CVI to quantify content validity as was done for the Stroke-PROM tool in our study. The FDA places particular emphasis on demonstrating content validity using open-ended interviews with patients [24]. Identifying the items of the Stroke-PROM based on a review of the literature and other stroke questionnaires, face-to-face interviews with patients, discussions with stroke professionals and the CVI further strengthened the content validity of the preliminary scale in our study.
Second, in the item-selection phase, analyses based on both CTT and IRT were used to delete items. The IRT-based analysis was used more heavily than that based on CTT in the construction of scales for measuring subjective attributes. IRT-based analysis also afforded more accurate examinations of the features of each scale item than the analyses based on CTT. Existing stroke-specific instruments had focused exclusively on CTT statistics (e.g., exploratory factor analysis, Cronbach’s α coefficient) [13,29]. No other stroke-specific instruments existed that had been developed using IRT. CTT statistics are associated with certain disadvantages, whereas methods based on IRT offer several advantages to refine items and therefore to improve on CTT [44].
In our study, both CTT and IRT analyses were repeated during finalization of the item content in the second sample. The results showed that the final Stroke-PROM had a high degree of reliability and validity.
Third, the instrument’s presumed internal structure, supported by CFA, confirmed that the Stroke-PROM measure is multidimensional in nature. No other stroke-specific instruments have established construct validity with CFA.
In summary, our results showed that the scale was valid, reliable and feasible and had strong discriminative properties between healthy controls and stroke patients with varying degrees of disability and dependence as defined by the modified Rankin scale. Although the Stroke-PROM tool was developed primarily for use in clinical trials of new drugs to evaluate their clinical therapeutic effects, this study showed that the Stroke-PROM also had strong discriminative measurement properties and could be used to differentiate patients with stroke from healthy controls. We therefore believe that there is an important role for this Stroke-PROM instrument in clinical practice as well as in clinical trials.
Limitations and further development
The scale has several potential limitations that we will address in future studies.
First, in the evaluation of validity, our study did not explicitly address criterion validity. Most of the patients with stroke were elderly, and completion of two or more scales would have been a significant burden for them, according to our experts on stroke. Stroke patients often experience disturbances of consciousness and physical restlessness; thus, adding more tests could produce test fatigue in these patients, thereby reducing the validity and reliability of measurement. Therefore, instead of asking patients to complete more than one scale, we chose to delay a thorough examination of criterion validity for a future investigation.
Second, test–retest reliability was not measured as part of the validation process. This was due in part to the additional burden it would have placed on patients, but also because of the difficulties inherent in follow-up with patients in their home communities and rural areas. We therefore demonstrated reliability only with internal consistency; however, we conducted our reliability evaluation of items at two points in the process: during the phases of item selection and scale evaluation.
Third, the stroke patient sample differed slightly from the healthy participant sample in two ways: the stroke patient population had a higher proportion of males and of individuals over 65 years old. Future studies should seek to balance these groups.
Because of limited resources (both funding and personnel), the sample populations may not be representative of the entire population of patients with stroke. Our participants were from only the Shanxi province in northern China. Thus, future studies should evaluate reliability and validity of the Stroke-PROM instrument with a nationwide sample.
The Stroke-PROM was administered to native-Chinese-speaking individuals. Therefore, further work is required to test the strengths and weaknesses of this instrument across various national, cultural and language contexts.
Conclusions
Our results provided evidence for satisfactory reliability and validity of the Stroke-PROM. However, the instrument will require additional revisions and improvements through testing in different populations. The ongoing process of modifying the Stroke-PROM will also encompass further validation and reliability testing across various applications of the instrument. The Stroke-PROM is not meant to replace existing stroke-specific measures, but to provide further valuable information on patients with stroke. This innovative instrument may be helpful in both routine medical practice and clinical research.
Acknowledgements
This research was supported by the grant from the National Natural Science Foundation of China (grant no: 81273180).
Abbreviations
- PRO
Patient-reported outcomes
- PROM
Patient-reported outcomes measure
- HRQOL
Health-related quality of life
- EQ-5D
EuroQol 5 dimension
- SF-36
Short Form 36
- SF-12
The short form 12
- SIP
The sickness impact profile
- NEWSQOL
Newcastle stroke-specific quality of life measure
- NIHSS
National institutes of health stroke scale
- SAQOL-39
Stroke and aphasia quality of life scale - 39 item version
- SIS
Stroke impact scale & stroke toolbox
- SS-QOL
Stroke-specific quality of life measure
- CNS
Canadian neurological scale
- mRS-SI
Structured interview for the modified rankin scale
- CTT
Classical test theory
- SD
Standard deviation
- CAID
Cronbach’s α if item deleted
- IRT
item response theory
- CITC
Corrected item-total correlation
- CVI
Content validity index
- I-CVI
Item-level CVI
- CFA
Confirmatory factor analysis
- KMO
Kaiser-meyer-olkin
- GFI
Goodness of fit index
- NFI
Normed fit index
- NNFI
Non normed fit index
- IFI
Incremental fit index
- CFI
Comparative fit index
- RMR
Root mean square residual
- PHD
Physical domain
- PSD
Psychological domain
- SOD
Social domain
- THD
Therapeutic domain
- SOS
Somatic symptom
- COG
Cognition
- VEC
Verbal communication
- SHS
Self-help skills
- ANX
Anxiety
- DEP
Depressed
- AVO
Avoid
- SOC
Social contacts
- FAS
Family support
- COM
Compliance
- SAT
Satisfaction
- FDA
Food and drug administration
Additional file
Appendix 1–1. Bank of 62 preliminary items of the Stroke-PROM Appendix 1–2. Scale structure of the bank of 62 preliminary items of the Stroke-PROM. Appendix 2–1. Bank of 60 items of the preliminary Stroke-PROM. Appendix 2–2. Scale structure of the bank of 60 items of the preliminary Stroke-PROM. Appendix 3–1. Bank of 47 items of the initial Stroke-PROM. Appendix 3–2. Scale structure of the bank of 47 items of the initial Stroke-PROM.
Footnotes
Competing interests
The authors declare that they have no competing interests.
Authors’ contributions
All authors participated in the design of the study; YHL participated in data analysis and drafted the manuscript; JY collected and analysed data; YBZ developed the original concept for this study, supervised the data analysis and revised the manuscript. All authors read and approved the final manuscript for this study.
Contributor Information
Yanhong Luo, Email: lifearena@163.com.
Jie Yang, Email: 617802126@qq.com.
Yanbo Zhang, Email: sxmuzyb@126.com.
References
- 1.Kaste M. Every day is a world stroke day act now, be a stroke champion and a torchbearer. Stroke. 2010;41:2449–50. doi: 10.1161/STROKEAHA.110.599092. [DOI] [PubMed] [Google Scholar]
- 2.Markku K. World stroke day. Stroke. 2011;42:2715. doi: 10.1161/STROKEAHA.111.633859. [DOI] [PubMed] [Google Scholar]
- 3.Claiborne Johnston S, Shanthi M, Mathers CD. Global variation in stroke burden and mortality: estimates from monitoring, surveillance, and modeling. Lancet Neurol. 2009;8:345–54. doi: 10.1016/S1474-4422(09)70023-7. [DOI] [PubMed] [Google Scholar]
- 4.Cerebrovascular disease group of the neurology branch of Chinese medical association for writing ischemic stroke secondary prevention guidelines The secondary prevention guidelines of Chinese ischemic stroke and transient ischemic attack. Chin J Neurol. 2010;43(2):154–60. [Google Scholar]
- 5.Jones P, Harding G, Wiklund I, Berry P, Leidy N. Improving the process and outcome of care in COPD:development of a standardised assessment tool. Prim Care Respir J. 2009;18(3):208–15. doi: 10.4104/pcrj.2009.00053. [DOI] [PMC free article] [PubMed] [Google Scholar]
- 6.Rinu Susan R, Sarma PS, Pandian JD. Psychosocial problems, quality of life, and functional independence among Indian stroke survivors. Stroke. 2010;41:2932–7. doi: 10.1161/STROKEAHA.110.596817. [DOI] [PubMed] [Google Scholar]
- 7.Björn S, Mika N, Per-Olof E, Paul H, Eva Wikström J. Validation of the clinical COPD questionnaire (CCQ) in primary care. Health Qual Life Outcomes. 2009;7:26. doi: 10.1186/1477-7525-7-26. [DOI] [PMC free article] [PubMed] [Google Scholar]
- 8.U.S. Department of Health and Human Services, Food and Drug Administration, Center for Drug Evaluation and Research (CDER), Center for Biologics Evaluation and Research (CBER), Center for Devices and Radiological Health (CDRH): Guidance for Industry, Patient-Reported Outcome Measures: Use in Medical Product Development to Support Labeling Claims. Clinical/Medical 2009. [http://www.fda.gov/Drugs/GuidanceComplianceRegulatoryInformation/Guidances/default.htm]
- 9.Deshpande PR, Surulivel R, Lakshmi Sudeepthi B, Abdul Nazir CP. Patient-reported outcomes: a new era in clinical research. Perspect Clin Res. 2011;2(4):136–44. doi: 10.4103/2229-3485.86879. [DOI] [PMC free article] [PubMed] [Google Scholar]
- 10.Reda AA, Daniel K, Janwillem WH K, Geertjan W, Constant P, van Schayck N. Reliability and validity of the clinical COPD questionniare and chronic respiratory questionnaire. Respir Med. 2010;104:1675–82. doi: 10.1016/j.rmed.2010.04.023. [DOI] [PubMed] [Google Scholar]
- 11.Windisch W, Budweiser S, Heinemann F, Pfeiferb M, Rzehak P. The severe respiratory insufficiency questionnaire was valid for COPD patients with severe chronic respiratory failure. J Clin Epidemiol. 2008;61:848–53. doi: 10.1016/j.jclinepi.2007.09.009. [DOI] [PubMed] [Google Scholar]
- 12.The Patient-Reported Outcome and Quality of life Instruments Database.[http://www.proqolid.org/] [DOI] [PMC free article] [PubMed]
- 13.Buck D, Jacoby A, Massey A, Steen N, Sharma A, Ford GA. Development and validation of NEWSQOL, the Newcastle stroke-specific quality of life measure. Cerebrovasc Dis. 2004;17:143–52. doi: 10.1159/000075783. [DOI] [PubMed] [Google Scholar]
- 14.Hilari K, Byng S, Lamping DL, Smith SC. Stroke and aphasia quality of life scale-39 (SAQOL-39) evaluation of acceptability, reliability, and validity. Stroke. 2003;34:1944–50. doi: 10.1161/01.STR.0000081987.46660.ED. [DOI] [PubMed] [Google Scholar]
- 15.Duncan PW, Dennis W, Sue Min L, Dallas J, Susan E, Louise Jacobs L. The stroke impact scale version 2.0: evaluation of reliability, validity, and sensitivity to change. Stroke. 1999;30:2131–40. doi: 10.1161/01.STR.30.10.2131. [DOI] [PubMed] [Google Scholar]
- 16.Xiaoxv Y, Xiaochen T, Yeqing T, Rui Y, Yunxia W, Shiyi C, et al. Development and validation of a tuberculosis medication adherence scale. Plos One. 2012;7(12):e50328. doi: 10.1371/journal.pone.0050328. [DOI] [PMC free article] [PubMed] [Google Scholar]
- 17.Richieri R, Boyer L, Reine G, Loundou A, Auquier P, Lançon C, et al. The schizophrenia caregiver quality of life questionnaire (S-CGQoL): development and validation of an instrument to measure quality of life of caregivers of individuals with schizophrenia. Schizophr Res. 2011;126:192–201. doi: 10.1016/j.schres.2010.08.037. [DOI] [PubMed] [Google Scholar]
- 18.Polit DF, Cheryl Tatano B, Owen SV. Is the CVI an acceptable indicator of content validity? appraisal and recommendations. Res Nurs Health. 2007;30:459–67. doi: 10.1002/nur.20199. [DOI] [PubMed] [Google Scholar]
- 19.Wynd CA, Bruce S, Michelle Atkins S. Two quantitative approaches for estimating content validity. West J Nurs Res. 2003;25(5):508–18. doi: 10.1177/0193945903252998. [DOI] [PubMed] [Google Scholar]
- 20.Yusoff MSB. The Dundee ready educational environment measure: a confirmatory factor analysis in a sample of Malaysian medical students. Int J Humanities Social Sci. 2012;2(16):313–21. [Google Scholar]
- 21.Steven DM. Reliability: on the reproducibility of assessment data. Metric Med Educ. 2004;38:1006–12. doi: 10.1111/j.1365-2929.2004.01932.x. [DOI] [PubMed] [Google Scholar]
- 22.Muhamad Saiful Bahri Yusoff, Ahmad Fuad Abdul Rahim, Mohd Jamil Yaacob: The development and validity of the medical student stressor questionnaire(MSSQ). ASEAN Journal of Psychiatry 2010, 11 (1): Jan – June 2010: XX XX.
- 23.tot van Nispen Pannerden SC, Candel MJJM, Zwakhalen SMG, Hamers JPH, Curfs LMG, Berger MPF. An item response theory-based assessment of the pain assessment checklist for seniors with limited ability to communicate (PACSLAC) J Pain. 2009;10(8):844–53. doi: 10.1016/j.jpain.2009.02.007. [DOI] [PubMed] [Google Scholar]
- 24.U.S. Department of Health and Human Services, Food and Drug Administration Center for Drug Evaluation and Research, Center for Biologics Evaluation and Research, Center for Devices and Radiological Health Guidance for industry patient-reported outcome measures: Use in medical product development to support labeling claims. Clin/Med. 2009;12:1–39. [Google Scholar]
- 25.van der Molen T, Brigitte WM W, Siebrig S, ten Hacken NHT, Postma DS, Juniper EF. Development, validity and responsiveness of the Clinical COPD Questionnaire. Health Qual Life Outcomes. 2003;1:13. doi: 10.1186/1477-7525-1-13. [DOI] [PMC free article] [PubMed] [Google Scholar]
- 26.van Swieten JC, Koudstaal PJ, Visser MC, Schouten HJ, van Gijn J. Interobserver agreement for the assessment of handicap in stroke patients. Stroke. 1988;19:604–7. doi: 10.1161/01.STR.19.5.604. [DOI] [PubMed] [Google Scholar]
- 27.Lyden PD, Mei L, Levine SR, Brott TG, Broderick J. A modified national institutes of health stroke scale for use in stroke clinical trials. Stroke. 2001;32:1310–7. doi: 10.1161/01.STR.32.6.1310. [DOI] [PubMed] [Google Scholar]
- 28.Cote R, Hachinski VC, Shurvell BL, Norris JW, Wolfson C. The Canadian neurological scale: a preliminary study in acute stroke. Stroke. 1986;17:731–7. doi: 10.1161/01.STR.17.4.731. [DOI] [PubMed] [Google Scholar]
- 29.Williams LS, Weinberger M, Harris LE, Clark DO, Biller J´. Development of a stroke-specific quality of life scale. Stroke. 1999;30:1362–9. doi: 10.1161/01.STR.30.7.1362. [DOI] [PubMed] [Google Scholar]
- 30.Wang Y, Zhao H, Liu Z, Liu B. Reliability, validity and response of patient reported outcome scale in stroke patients with spastic paralysis. Chinese General Practice. 2009;12:1168–70. [Google Scholar]
- 31.Buck D, Jacoby A, Massey A, Ford G. Evaluation of measures used to assess quality of life after stroke. Stroke. 2000;31:2004–10. doi: 10.1161/01.STR.31.8.2004. [DOI] [PubMed] [Google Scholar]
- 32.Watanabe Y, Araki S, Kurihara M. Health-related quality of life of stroke patients’ families during the patients’ hospitalization: a pilot study in Japan. Int J Rehabil Res. 2003;26(1):43–5. doi: 10.1097/00004356-200303000-00005. [DOI] [PubMed] [Google Scholar]
- 33.Palmer S, Glass TA. Family function and stroke recovery: a review. Rehabil Psychol. 2003;48(4):255–65. doi: 10.1037/0090-5550.48.4.255. [DOI] [Google Scholar]
- 34.Cameron JI, Gary N, Gignac MAM, Mark B, Grace W, Theresa G, et al. Randomized clinical trial of the timing it right stroke family support program: research protocol. Health Serv Res. 2014;14:18. doi: 10.1186/1472-6963-14-18. [DOI] [PMC free article] [PubMed] [Google Scholar]
- 35.Clark MS, Sally R, Adrian W. A randomized controlled trial of an education and counselling intervention for families after stroke. Clin Rehabil. 2003;17:703–12. doi: 10.1191/0269215503cr681oa. [DOI] [PubMed] [Google Scholar]
- 36.Clark PC, Dunbar SB, Shields CG, Viswanathan B, Aycock DM, Wolf SL. Influence of stroke survivor characteristics and family conflict surrounding recovery on Caregivers’ mental and physical health. Nurs Res. 2004;53(6):406–13. doi: 10.1097/00006199-200411000-00009. [DOI] [PubMed] [Google Scholar]
- 37.Lawrence M, Kinn S. Needs, priorities, and desired rehabilitation outcomes of family members of young adults who have had a stroke: findings from a phenomenological study. Disabil Rehabil. 2013;35(7):586–95. doi: 10.3109/09638288.2012.711895. [DOI] [PubMed] [Google Scholar]
- 38.Anne V-M, Marcel P, Jan Willem G, Berlekom SBV, Trudi Van Den B, Eline L. Rehabilitation of stroke patients needs a family-centred approach. Disabil Rehabil. 2006;28(24):1557–61. doi: 10.1080/09638280600648215. [DOI] [PubMed] [Google Scholar]
- 39.Han B, Haley WE. Family caregiving for patients with stroke review and analysis. Stroke. 1999;30:1478–85. doi: 10.1161/01.STR.30.7.1478. [DOI] [PubMed] [Google Scholar]
- 40.Francesco M, Harin Padma N, Andrew M, Brock GB, Gregory B, Sanjeev A, et al. Tadalafil in the treatment of erectile dysfunction following bilateral nerve sparing radical retropubic prostatectomy: a randomized, double-blind, placebo controlled trial. J Urol. 2004;172:1036–41. doi: 10.1097/01.ju.0000136448.71773.2b. [DOI] [PubMed] [Google Scholar]
- 41.Dworkin RH, Turk DC, Wyrwich KW, Beaton D, Cleeland CS, Farrar JT, et al. Interpreting the clinical importance of treatment outcomes in chronic pain clinical trials: IMMPACT recommendations. J Pain. 2008;9(2):105–21. doi: 10.1016/j.jpain.2007.09.005. [DOI] [PubMed] [Google Scholar]
- 42.Burgio KL, Locher JL, Goode PS, Michael Hardin J, Joan McDowell B, Marianne D, et al. Behavioral vs drug treatment for urge urinary incontinence in older women a randomized controlled trial. JAMA. 1998;280(23):1995. doi: 10.1001/jama.280.23.1995. [DOI] [PubMed] [Google Scholar]
- 43.Linda A, Krithika R, Polyxane M, Carolyn B, Rod B, Robin C. Development and validation of the Impact of Dry Eye on Everyday Life (IDEEL) questionnaire, a patient-reported outcomes (PRO) measure for the assessment of the burden of dry eye on patients. Health Qual Life Outcomes. 2011;9:111. doi: 10.1186/1477-7525-9-111. [DOI] [PMC free article] [PubMed] [Google Scholar]
- 44.Hagman BT, Kuerbis AN, Morgenstern J, Bux DA, Parsons JT, Heidinger BE. An item response theory (IRT) analysis of the short inventory of problems-alcohol and drugs (SIP-AD) among non-treatment seeking men-who-have-sex-with-men: evidence for a shortened 10-item SIP-AD. Addict Behav. 2009;34:948–54. doi: 10.1016/j.addbeh.2009.06.004. [DOI] [PMC free article] [PubMed] [Google Scholar]