


Abstract
Protein aggregation underlies an increasing number of disorders and constitutes a major bottleneck in the development of therapeutic proteins. Our present understanding on the molecular determinants of protein aggregation has crystalized in a series of predictive algorithms to identify aggregation-prone sites. A majority of these methods rely only on sequence. Therefore, they find difficulties to predict the aggregation properties of folded globular proteins, where aggregation-prone sites are often not contiguous in sequence or buried inside the native structure. The AGGRESCAN3D (A3D) server overcomes these limitations by taking into account the protein structure and the experimental aggregation propensity scale from the well-established AGGRESCAN method. Using the A3D server, the identified aggregation-prone residues can be virtually mutated to design variants with increased solubility, or to test the impact of pathogenic mutations. Additionally, A3D server enables to take into account the dynamic fluctuations of protein structure in solution, which may influence aggregation propensity. This is possible in A3D Dynamic Mode that exploits the CABS-flex approach for the fast simulations of flexibility of globular proteins. The A3D server can be accessed at http://biocomp.chem.uw.edu.pl/A3D/.
INTRODUCTION
Protein aggregation has moved beyond being a mostly ignored area of protein chemistry to become a key topic in biomedicine and biotechnology. Two main reasons account for this interest. First, protein misfolding and subsequent aggregation is the hallmark of an increasing number of human disorders, including, but not limited to, neurodegenerative diseases such as Alzheimer's or Parkinson's (1,2). A second reason is the large interest that protein-based therapeutics—like monoclonal antibodies, growth factors or replacement enzymes—are receiving in the market, due to their high specificity toward their targets (3). There are, however, many barriers that difficult the development and manufacture of these protein-based drugs. Among them, perhaps the most common and one of the most difficult to prevent is protein aggregation.
Protein aggregation seems to be a generic property of polypeptide chains, likely because the non-covalent contacts that stabilize native structures resemble those leading to the formation of aggregates (4). Because the formation of compact globular proteins comes at the expense of an inherent aggregation propensity, there is a strong need of in-silico methods that can both anticipate the aggregative properties of disease-linked proteins and guide the design of soluble protein-based drugs. In this context, a number of predictive bioinformatic tools have been developed in the past ten years (5,6). Among them, AGGRESCAN, developed in our group, was the first to rely on experimental aggregation propensities in a cellular context (7). The algorithm is based on the results obtained from the study of the aggregation in the E. coli cytoplasm of a complete set of mutants of the amyloid β-peptide (Aβ) (7). The differential impact of the mutations on the aggregation of the peptide permitted to derive a scale of intrinsic aggregation propensity for the natural amino acids (8). AGGRESCAN exploits this scale to evaluate the aggregation propensity of each single protein residue according to its relative position in the sequence (9). Since its publication, the algorithm has become widely used, displaying very good accuracy to predict in vivo aggregation (6).
A large majority of protein aggregation predictive methods, including AGGRESCAN, rely on the analysis of linear sequences and therefore on the assumption that the protein of interest is at least partially unstructured. Hence, they should be used with caution in the case of natively folded globular proteins, where many predicted aggregation-prone regions are blocked, either because they are buried inside the hydrophobic core or engaged in the series of cooperative non-covalent interactions that sustain the secondary and tertiary protein structure. Shielded in this way, they will have a negligible impact on aggregation.
Here we introduce the AGGRESCAN3D (A3D) server, an evolution of AGGRESCAN method, which overcomes the limitations of sequence-based algorithms. Using a structure-based approach, A3D allows the specific detection of those spatially-adjacent aggregation-prone amino acids that are relevant to protein aggregation from folded states. The algorithm exhibits significantly higher accuracy than first generation sequence-based programs when forecasting the aggregation properties of globular proteins. Importantly, A3D incorporates a mutation module that allows the easy modeling of pathogenic mutations or the design of proteins with increased solubility by mutating the detected aggregation-prone residues or their surroundings. In addition, A3D features an optional ‘Dynamic Mode’ taking into account the flexibility of the input structure in aggregation predictions. This permits to model aggregation features attributable to structure fluctuations of wild type structures, or caused by the occurrence of destabilizing pathogenic mutations. We illustrate the approach through its application to a range of proteins whose aggregation properties have been experimentally characterized.
MATERIALS AND METHODS
A3D server can be run in Static Mode (default) or Dynamic Mode (see in Supplementary Figure S1 the A3D server pipeline).
Static mode calculations
A3D uses as input protein 3D-structures (derived from X-ray diffraction, solution NMR or modeling approaches) in PDB format. As a default, A3D runs on ‘Static Mode’ meaning that subsequent calculations are performed directly using a single input structure. Prior to A3D analysis, the input structure is energetically minimized using the FoldX force-field (10).
The A3D aggregation analysis exploits an experimentally derived intrinsic aggregation propensity scale for natural amino acids (8) and projects this scale in the protein 3D structure. In the A3D method the intrinsic aggregation propensity of each particular amino acid in the protein is modulated by its specific structural context. Aggregation propensity is calculated for spherical regions centered on every residue Cα carbon. This provides a unique structurally corrected aggregation value (A3D score) for each amino acid in the structure, which is formulated as
 |
where Aggi is the instrinsic aggregation propensity of the residue in the center of the sphere as calculated in (8) and RSAi its relative surface area exposed to solvent. Agge is the instrinsic aggregation propensity of each additional residue included in the sphere, RSAe its relative surface area exposed to solvent and dist its distance to the central residue i.
A3D uses as default sphere radius 10 Å for identifying the residues involved in the formation of aggregation-prone patches. A radius of 5 Å can be selected to dissect the contribution of individual residues to these patches. The residues exposition to the solvent is calculated using the Lee and Richards method (11) as implemented in Naccess (http://www.bioinf.manchester.ac.uk/naccess/nac_intro.html) with a default probe size of 1.40 Å and a z-slice parameter of 0.05 Å. Heteroatoms are ignored. The higher contribution of exposed residues to the aggregation of folded proteins than those buried in the structure was modeled as an exponential function of RSA with α = 0.0599 and β = 0.512. Only residues displaying an RSA ≥ 10% for all of their atoms are taken into account. According to this function, residues with RSA = 10% have a weight of 0.1 and residues with an RSA = 55%, which are considered already fully exposed, a weight of 1, as any residue with RSA > 55%. In a similar manner, the exponential function that corrects the distance parameter, with γ = 1.291 and δ = −0.256, makes that residues close to the center of the considered sphere contribute more to the local structural aggregation propensity than distant ones, with residues at ≤ 1 Å of the center having a weight of 1 and those at the sphere limit a weight of 0.1. Individual residues displaying positive and negative A3D scores correspond to aggregation and solubility promoting residues, respectively.
Protein structures can be mutated previously to A3D predictions or after running the analysis over the wild type (WT) protein. The selected mutations are modeled on top of the structure using FoldX (10) and a new A3D prediction is subsequently generated on top of this energetically minimized structural model.
Dynamic mode calculations
A3D can be run in ‘Dynamic Mode’ to analyze the impact of structural fluctuations on the aggregation propensity of folded proteins. An input (WT or mutated) structure is minimized with FoldX (10) and used as a starting point for the CABS-flex simulations of protein structure flexibility (12) (the CABS-flex protocol has been shown to be an efficient alternative to classical all-atom Molecular Dynamics (13,14)). The resulting trajectory is automatically processed to provide a set of protein models (in an all-atom resolution) reflecting the most dominant structural fluctuations in the near-native ensemble (the procedure details are provided in ref. (12)). Next, for each CABS-flex-predicted model, A3D aggregation analysis is performed in the same way as described in the ‘Static Mode calculations’ paragraph. Finally, the model with the highest A3D score is selected, and presented in the output, as a proxy of the most aggregation-prone structure variant available in solution.
PERFORMANCE
Discarding the impact of buried aggregation-prone residues on aggregation propensity
Most well-established protein aggregation predictors, including AGGRESCAN (9), PASTA (15), WALTZ (16), FoldAmyloid (17), TANGO (18) and Zyggregator (19) use the linear sequence as an input. Therefore, these methods assume that the detected aggregation-prone regions are exposed to solvent. However, in native globular proteins these regions may be buried, and as a result, the algorithms display a large set of false positive predictions when analyzing folded states. To circumvent this limitation, Zyggregator was previously adapted to predict aggregation-prone regions in structured proteins by including prediction of protection factors from hydrogen exchange (20). A3D overcomes this problem by correcting the intrinsic aggregation of each single residue in a globular protein according to its specific structural context. In Figure 1A we compare the predictions of sequence-based algorithms and A3D for myoglobin, a highly soluble protein (PDB: 4MBN). It can be seen that sequence-based algorithms coincide to indicate that myoglobin contains a significant number of aggregating residues; however an inspection of the structure indicates that most of them are not exposed to solvent in the folded state. A3D catches correctly this feature reducing the number of predicted aggregation-prone residues by at least one order of magnitude relative to sequence-based algorithms. An inspection of the A3D structural prediction for myoglobin (Figure 1B) indicates that indeed it exhibits a highly soluble surface, in good agreement with its high solubility in physiological conditions. The structurally corrected Zyggregator approach provides similar predictions for myoglobin (20), highlighting the importance of considering structural properties when predicting aggregation in folded proteins. Similar results are obtained for other archetypical soluble proteins like maltose binding protein and ubiquitin (Supplementary Figure S2).
Figure 1.
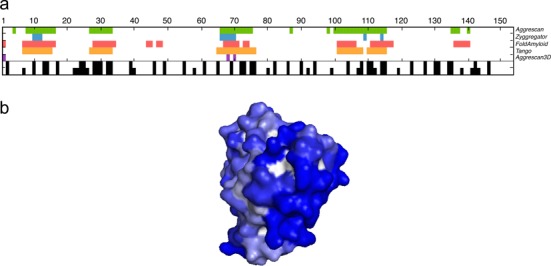
(a) The aggregation propensity of myoglobin (PDB: 4MBN) is analyzed using both sequence-based predictors and A3D. Amino acids with positive scores are indicated in different colors for each predictor: AGGRESCAN (green), Zyggregator (blue), FoldAmyloid (red), Tango (orange) and A3D (purple). Black bars indicate buried residues exposing < 15 Å2 (upper row) and < 30 Å2 (lower row) to solvent. (b) A3D analysis of myoglobin structure. The protein surface is colored according to A3D score in gradient from red (high-predicted aggregation propensity) to white (negligible impact on protein aggregation) to blue (high-predicted solubility).
Identifying aggregation-prone regions in folded structures
A point mutation in position 6 from Glu in hemoglobin A to Val in hemoglobin S promotes its aggregation and leads to sickle cell disease (21). The A3D analysis of the crystal structure of hemoglobin S (PDB: 2HBS) spots Val6 as the residue with the highest aggregating propensity in the protein folded structure, creating a strong and unique aggregating-prone region on its surrounding, which is absent in hemoglobin A (Figure 2). This cluster consists of four residues that are not consecutive in sequence (residues 5, 6, 9 and 10). In this context, it appears that Glu6 may play a role as a structural gatekeeper thanks to its charge, providing this region with a significant solubility in hemoglobin A (Figure 2). Despite most sequence-based algorithms predict an increase in aggregation propensity upon Glu6 to Val6 mutation, the sequence stretch flanking Val6 still displays very low aggregation potency when compared with other detected aggregation prone regions in hemoglobin S sequence, being in all cases below their detection limit (Supplementary Figure S3).
Figure 2.
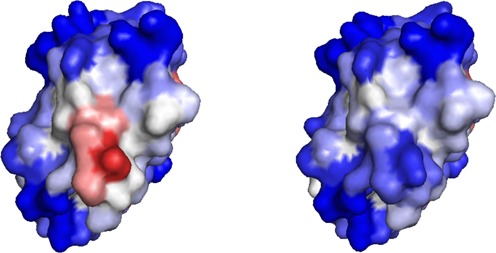
A3D analysis of the β-chains of deoxyhemoglobin S (PDB: 2HBS:D) (left) and deoxyhemoglobin A (right). Color code is as in Figure 1b. The detected aggregation-prone area in deoxyhemoglobin S includes Val6.
Prediction of the impact of mutations on protein aggregation
One of the limitations in the development of protein-based therapeutics is their aggregation during recombinant production. The use of structural corrections on top of sequence-based approaches has been shown to provide accurate predictions on protein solubility upon overexpression (22). We tested whether A3D can also undertake this task, and compared its performance with that of two gold standard methods: SOLpro and PROSO II (23,24). We collected from the literature a set of 29 different WT proteins for which 3D-structures are available and changes in solubility upon mutation and expression have been characterized, accounting a total of 129 variants (Supplementary Table S1). We classified the mutants in the different studies as positives (87 variants) or negatives (42 variants) according if they increased or decreased solubility relative to their respective WT proteins. As shown in Table 1, A3D displays a high sensitivity, specificity and precision being thus highly accurate in predicting the effects of mutations on protein solubility upon overexpression, clearly outperforming these two sequence-based approaches.
Table 1. Performance of SOLpro, PROSO II and A3D in the prediction of the effects of mutations on protein solubility upon overexpression (protein data set in Supplementary Table S1).
| SOLpro | PROSO II | A3D | |
|---|---|---|---|
| True positives | 61 | 59 | 81 |
| False positives | 25 | 15 | 2 |
| True negatives | 17 | 27 | 40 |
| False negatives | 26 | 28 | 6 |
| Sensitivity | 0.701 | 0.678 | 0.931 |
| Specificity | 0.405 | 0.643 | 0.952 |
| Precision | 0.709 | 0.797 | 0.975 |
Prediction of the aggregation propensity of protein oligomers and their subunits in disease-linked proteins
A number of amyloidogenic globular proteins display quaternary structure. This is the case of transthyretin (TTR) a tetrameric protein whose aggregation results in polyneuropathy and/or cardiomyopathy (25) and copper-zinc superoxide dismutase (SOD1), a dimer that forms aggregates in the spinal cord of patients suffering familial amyotrophic lateral sclerosis (26). In these proteins, familial mutations affecting the complex stability favor dissociation into their constituent monomers, which afterward aggregate. It has been suggested that the interfaces sustaining the quaternary structure of these proteins are aggregation-prone due, at least in part, to their inherent hydrophobicity, in such a way that they are protected in the oligomer but drive fast aggregation once it dissociates (27). A3D can analyze the aggregation propensity of both the native oligomer and their individual subunits, when they are loaded as single chains. We used A3D to analyze the aggregation propensity of TTR (PDB: 1TTA) and SOD1 (PDB: 2C9V) quaternary native states and their monomeric constituents. As shown in Supplementary Figure S4, the data confirm that in both cases the interfaces possess a high aggregation propensity, which are protected in the native state.
Prediction of the impact of protein dynamics on aggregation propensity
The dynamic structural fluctuations of proteins in solution are known to influence their aggregation propensity and might be linked to disease (28). In fact, pathogenic mutations occurring in globular proteins can increase aggregation propensity in two different ways. They can increase the intrinsic aggregation propensity of an exposed region or can destabilize the native state, increasing structural fluctuations and the exposition of previously protected aggregation-prone residues. These effects are not exclusive and a mutation can induce both situations. As shown above, the first effect can be accurately modeled using A3D in static mode, but modeling the second effect requires consideration of the destabilizing impact of the mutation; for example, the predicted impact of mutations on TTR β-sheet stability has been shown to correlate with the variants amyloidogenicity (29). Toward this aim A3D can be run in Dynamic Mode (see Methods), where it exploits the CABS-flex approach to model protein dynamic structural fluctuations. As a proof of principle, we selected β2-microglobulin (β2m), an amyloid forming protein which aggregation causes serious complication in patients on long-term hemodialysis (30), and analyzed different variants previously shown to differ in their aggregation potential: namely I7A, V37A, P32G and ΔN6 (31). WT and V37A variants cannot nucleate amyloid formation in vitro at pH 7.0, despite the mutant is substantially destabilized. The P32G mutation enhances the ability of β2m to elongate fibril seeds, but this protein cannot nucleate fibril assembly at neutral pH. In contrast, I7A and specially ΔN6 are able to nucleate fibril formation at pH 7.0. When WT β2m (PDB: 2D4F) and its mutants were analyzed with A3D in Dynamic Mode, the algorithm was able to rank the different variants according to their observed experimental amyloid propensity, yielding total scores values of −52.32, −59.95, −65.64, −67.29 and −73.54 for ΔN6, I7A, P32G, V37A and WT variants, respectively. Thus, variants able to nucleate amyloid fibril formation at neutral pH displayed significantly higher scores than non-amyloidogenic variants. An inspection of the A3D generated structures allows identifying the underlying reason for this increased aggregation propensity (Figure 3). ΔN6 and I7A conformers display much higher aggregation surface than WT β2m as a result of the exposition of aggregation-prone residues, previously hidden in the native structure. The predictions for the I7A mutant illustrate the potency of the A3D Dynamic Mode. The mutation I7A truncates an aliphatic side chain, thus reducing hydrophobicity, accordingly all sequence-based algorithms predict wrongly this mutant to be more soluble. The same applies for A3D in static mode.
Figure 3.
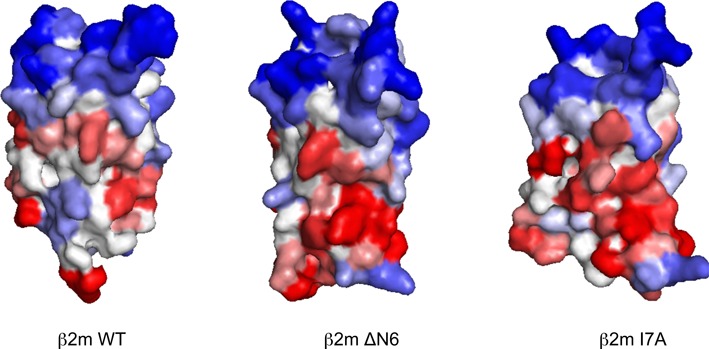
WT β2-m (PDB: 2D4F) and variants ΔN6, I7A were modeled and analyzed A3D in Dynamic Mode. Color codes as in Figure 1.In agreement with experimental data, the mutations result in conformers exposing aggregation-prone regions that are protected from solvent in the WT form.
Despite, the native state free energy landscape limits the exposure of aggregation-prone residues, wild type proteins can aggregate from native-like states (N* states) without a need for extensive unfolding (28). This is the case of acylphosphatase from Drosophila melanogaster (AcPDro2). For this protein, combining NMR measurements with restrained molecular dynamics simulations it has been shown that there are two aggregation-prone regions comprising strand S2 and specially S5 and the preceding loop which are less protected in the N* state, populated in the presence of 5% of 2,2,2-trifluoroethanol, that in the native state (32). We compared the A3D predictions for AcPDro2 in static and dynamic modes. Interestingly enough, the analysis indicates that these two regions, especially S5 and the loop, are significantly more exposed and therefore more susceptible to aggregation in the most aggregation-prone conformer in the dynamics than in the static structure (Supplementary Figure S5). These data suggest that A3D might be useful to identify aggregation susceptible regions in N* states for their subsequent experimental characterization.
SERVER DESCRIPTION
The A3D web interface is suited for easy to handle processing and analysis of protein structures. The main features of the web interface include possibility of introducing any mutations in the input structures and convenient analysis and visualization of the computed predictions. In addition, a web user can modify operational modes of the method.
Input interface and requirements
The only data required as an input are a protein structure file (given as a PDB code or uploaded by user). The input structure file must be provided in PDB format (http://www.wwpdb.org/docs.html). Different requirements apply to the input structure depending whether the A3D is operated in static or dynamic mode.
In the ‘Static mode’, single and multimeric protein chains are accepted (PDB files can have up to 20.000 atoms). For users convenience, proteins with missing atoms, or missing residues, are accepted. However, careful attention should be paid if missing protein elements can be important for analysis of aggregation tendencies. If yes, missing structure fragments should be reconstructed before providing it as an input.
In the ‘Dynamic mode’, only single and continuous (without breaks) protein chains (up to 400 standard amino acids in length) are accepted. Non-standard amino acids are not accepted. Each residue must have a complete set of backbone atoms (N, Cα, C and O); side chain atoms may be missing.
Note that in the both modes, heteroatoms (e.g. water or ligands) are not considered in the analysis. It is possible to upload PDB files containing alternative protein structures (such as determined by nuclear magnetic resonance methods), but then only the first model in the PDB file is used as an input.
Optional inputs include: project name (recommended for better organization of users work: project names appears in the queue page and may be inherited, when mutations are done from the ‘A3D score’ output tab) and email address (the server uses the address only for email notification about the job status). Additionally, user has the following options to decide: (i) whether the server will operate in static (default) or dynamic mode; (ii) whether the mutational analysis is about to be performed. Default is ‘No’. If changed to ‘Yes’ mutational options will be provided after clicking ‘Submit’ button; (iii) whether distance of aggregation analysis (radius of the sphere—R, see Methods section) will be 10 Å (default) or 5 Å (useful to dissect the contributions of specific side chains to a given aggregation patch).
Output interface
The output interface is organized under the following tabs: ‘Project details’, ‘A3D plot’, ‘A3D score’, ‘Structure’ and ‘Dynamic mode details’ (this tab is present only if the job was submitted in the ‘Dynamic mode’). The content of these tabs is presented in Figure 4 and briefly described in the following paragraphs.
Figure 4.

Example output interfaces for WT β2m (PDB: 2D4F). The output is organized under the following tabs: (a) ‘A3D plot’, (b) ‘A3D score’, (c) ‘Structure’ and (d) ‘Dynamic mode details’. For the description of the tabs content see ‘Output interface’ subparagraph.
Under ‘A3D plot’ the results are accessible as an interactive online plot: vertical axis corresponds to A3D score values, while horizontal axis correspond to residue numbers (drag cursor over the plot to display residue labels). The plot can be downloaded in SVG and PNG file format.
Under ‘A3D score’ tab the following data are provided:
Minimal score—value of the A3D score for the most soluble residue.
Maximal score—value of the A3D score for the most aggregation-prone residue.
Average score—normalized indicator of the aggregation propensity/solubility of the protein structure. Allows comparing the solubility of different protein structures. It also allows assessing changes in solubility promoted by amino acid substitutions in a particular protein structure. The more negative the value, the highest the normalized solubility.
Total score—a global indicator of the aggregation propensity/solubility of the protein structure. It depends on the protein size. It allows assessing changes in solubility promoted by amino acid substitutions in a particular protein structure. The more negative the value, the highest the global solubility.
Moreover, the ‘A3D score’ tab includes a scrolling list table with the following columns: residue index, residue name, chain and A3D score for all exposed residues in the structure. Residues with exposure to solvent < 10% are considered buried and not influencing aggregation in the folded state and accordingly they are not shown in the list. Residues with positive scores, i.e. aggregation-prone, are highlighted in the table. The list can be downloaded (Download table button) as CSV or TXT tabular data. Importantly, each row of the online table contains ‘Mutate’ button. Once selected, it enables to run new prediction job with the mutated (according to user choice) residue.
Under the ‘Structure’ tab a movie is presented. The movie shows rotating input protein structure with residues colored according to their A3D score. Additionally, website interface allows to visualize protein solvent accessible area using JSmol online plugin (33). In the movie, as well as in JSmol plugin, proteins are colored according the similar coloring scheme. Aggregation-prone residues are colored in gradients of red: the higher the score—the higher aggregation propensity—the darker the red. Soluble residues are colored in gradients of blue: the lower the score—the higher solubility—the darker the blue. Residues predicted to not influence aggregation (A3D score equal or close to zero) are colored in white. A user can also simply create own visualization of the A3D score onto the protein structure by downloading the PDB file (that have A3D score values in the temperature factor column) and using molecular graphics software of user's choice.
Under the ‘Dynamic mode’ tab (available only if A3D server was run in ‘Dynamic mode’) the following graphics are provided: molecular picture showing structural alignment of the input structure and the most aggregation-prone model (generated in simulations of protein dynamics) and a plot displaying RMSD profile (distances between residues of the two superimposed structures). The most aggregation-prone model and RMSD values per residue can be also downloaded as a PDB file and visualized with graphics software of user's choice.
Online documentation
The documentation of the A3D is available online, and it can be accessed using the links in the menu at the top of every server page. the description of the method and the tutorial explaining how to access and interpret the results data. Additionally, the web interface provides short help notes—available for input options, as well as on the output pages. The online documentation is updated on a regular basis according to users’ needs or the method improvements.
Server and output data availability
The A3D server is free and open to all users, and there is no login requirement. After clicking submit button, a web link to the results is provided, which should be bookmarked and accessed at a later time. Web links to the submitted jobs are also displayed on a queue page (available from the main page), unless the option ‘Do not show my job on the results page’ (available from the options panel in the main page) is marked. Note that the results will be available for a limited period of time (currently, the storage period is 360 days). The A3D server interface has been optimized for several web browsers (mostly in their latest versions: Mozilla Firefox v35, Google Chrome v41, Internet Explorer v11, Safari v6.0), however, for optimal performance we recommend Mozilla Firefox.
Command-line availability
Apart from the web interface, the A3D server may be also operated from the command line using RESTful web services. The instructions for using the RESTful service are available from the online tutorial (available from the main menu). Utilizing A3D RESTful interface may be very convenient way of implementing the A3D server in other automatical pipelines.
Server architecture and run-time
A3D website interface and parsers were developed in the Python scripting language, using WSGI, Flask framework and Jinja2 template engine. The online interactive plots are generated using D3.js library. Molecular visualization presented in the movies is done using Open Source PyMOL. A3D website runs on Apache2 and MySQL database for user queue storage. A3D queue is checked every 5 min by computational servers and any new jobs are added to the SGE queue. As soon as job is started on the computational server, job status changes on the A3D website (from ‘pending’ to ‘running’, or from ‘pending’ to ‘in queue’).
Typical A3D run in ‘static mode’ takes about 20 min, while ‘dynamic mode’ predictions (utilizing CABS-flex simulation method (12) take up to 3 h. After computing, job results are sent back to the website and job status changes from ‘running’ to ‘done’ (or ‘error’). Currently, A3D server computations are performed on the linux cluster having about 100 CPU threads.
CONCLUSION
We have described A3D, a novel web server for the prediction of the aggregation propensity of globular proteins. The algorithm should find application in the prediction of the pathogenic effect of familial mutations in conformational disorders and may become a useful tool for the design of soluble protein-based therapeutics. Overall, we find out that properties not taken in account by sequence-based algorithms, like protein dynamic fluctuations and spatial clustering of residues distant in the protein sequence, are important for accurate prediction of protein aggregation from initially folded states. A3D can be applied to any protein for which a structure is known, or can be generated by homology modeling.
SUPPLEMENTARY DATA
Supplementary Data are available at NAR Online.
Acknowledgments
We thank Ricard Illa for computational help in the preliminary version of A3D.
FUNDING
Ministerio de Economia y Competividad, Spain [BFU2013–44763 to S.V.]; SUDOE, INTERREG IV B, FEDER [SOE4/P1/E831to S.V.]; ICREA [ICREA Academia 2009 to S.V.]; Foundation for Polish Science TEAM project [TEAM/2011–7/6] co-financed by the EU European Regional Development Fund operated within the Innovative Economy Operational Program. Funding for open access charge: Foundation for Polish Science TEAM project [TEAM/2011-7/6] co-financed by the EU European Regional Development Fund operated within the Innovative Economy Operational Program.
Conflict of interest statement. None declared.
REFERENCES
- 1.Invernizzi G., Papaleo E., Sabate R., Ventura S. Protein aggregation: mechanisms and functional consequences. Int. J. Biochem. Cell Biol. 2012;44:1541–1554. doi: 10.1016/j.biocel.2012.05.023. [DOI] [PubMed] [Google Scholar]
- 2.Selkoe D.J. Cell biology of protein misfolding: the examples of Alzheimer's and Parkinson's diseases. Nat. Cell Biol. 2004;6:1054–1061. doi: 10.1038/ncb1104-1054. [DOI] [PubMed] [Google Scholar]
- 3.Walsh G. Biopharmaceutical benchmarks 2010. Nat. Biotechnol. 2010;28:917–924. doi: 10.1038/nbt0910-917. [DOI] [PubMed] [Google Scholar]
- 4.Jahn T.R., Radford S.E. Folding versus aggregation: polypeptide conformations on competing pathways. Arch. Biochem. Biophys. 2008;469:100–117. doi: 10.1016/j.abb.2007.05.015. [DOI] [PMC free article] [PubMed] [Google Scholar]
- 5.Castillo V., Grana-Montes R., Sabate R., Ventura S. Prediction of the aggregation propensity of proteins from the primary sequence: aggregation properties of proteomes. Biotechnol. J. 2011;6:674–685. doi: 10.1002/biot.201000331. [DOI] [PubMed] [Google Scholar]
- 6.Belli M., Ramazzotti M., Chiti F. Prediction of amyloid aggregation in vivo. EMBO Rep. 2011;12:657–663. doi: 10.1038/embor.2011.116. [DOI] [PMC free article] [PubMed] [Google Scholar]
- 7.de Groot N.S., Aviles F.X., Vendrell J., Ventura S. Mutagenesis of the central hydrophobic cluster in Abeta42 Alzheimer's peptide. Side-chain properties correlate with aggregation propensities. FEBS J. 2006;273:658–668. doi: 10.1111/j.1742-4658.2005.05102.x. [DOI] [PubMed] [Google Scholar]
- 8.de Groot N., Pallares I., Aviles F., Vendrell J., Ventura S. Prediction of ‘hot spots’ of aggregation in disease-linked polypeptides. BMC Struct. Biol. 2005;5:18. doi: 10.1186/1472-6807-5-18. [DOI] [PMC free article] [PubMed] [Google Scholar]
- 9.Conchillo-Sole O., de Groot N.S., Aviles F.X., Vendrell J., Daura X., Ventura S. AGGRESCAN: a server for the prediction and evaluation of ‘hot spots’ of aggregation in polypeptides. BMC Bioinformatics. 2007;8:65. doi: 10.1186/1471-2105-8-65. [DOI] [PMC free article] [PubMed] [Google Scholar]
- 10.Schymkowitz J., Borg J., Stricher F., Nys R., Rousseau F., Serrano L. The FoldX web server: an online force field. Nucleic Acids Res. 2005;33:W382–W388. doi: 10.1093/nar/gki387. [DOI] [PMC free article] [PubMed] [Google Scholar]
- 11.Lee B., Richards F.M. The interpretation of protein structures: estimation of static accessibility. J. Mol. Biol. 1971;55:379–400. doi: 10.1016/0022-2836(71)90324-x. [DOI] [PubMed] [Google Scholar]
- 12.Jamroz M., Kolinski A., Kmiecik S. CABS-flex: server for fast simulation of protein structure fluctuations. Nucleic Acids Res. 2013;41:W427–W431. doi: 10.1093/nar/gkt332. [DOI] [PMC free article] [PubMed] [Google Scholar]
- 13.Jamroz M., Orozco M., Kolinski A., Kmiecik S. Consistent view of protein fluctuations from all-atom molecular dynamics and coarse-grained dynamics with knowledge-based force-field. J. Chem. Theory Comput. 2013;9:119–125. doi: 10.1021/ct300854w. [DOI] [PubMed] [Google Scholar]
- 14.Jamroz M., Kolinski A., Kmiecik S. CABS-flex predictions of protein flexibility compared with NMR ensembles. Bioinformatics. 2014;30:2150–2154. doi: 10.1093/bioinformatics/btu184. [DOI] [PMC free article] [PubMed] [Google Scholar]
- 15.Trovato A., Seno F., Tosatto S.C. The PASTA server for protein aggregation prediction. Protein Eng. Des. Sel. 2007;20:521–523. doi: 10.1093/protein/gzm042. [DOI] [PubMed] [Google Scholar]
- 16.Maurer-Stroh S., Debulpaep M., Kuemmerer N., Lopez de la Paz M., Martins I.C., Reumers J., Morris K.L., Copland A., Serpell L., Serrano L., et al. Exploring the sequence determinants of amyloid structure using position-specific scoring matrices. Nat. Meth. 2010;7:237–242. doi: 10.1038/nmeth.1432. [DOI] [PubMed] [Google Scholar]
- 17.Garbuzynskiy S.O., Lobanov M.Y., Galzitskaya O.V. FoldAmyloid: a method of prediction of amyloidogenic regions from protein sequence. Bioinformatics. 2010;26:326–332. doi: 10.1093/bioinformatics/btp691. [DOI] [PubMed] [Google Scholar]
- 18.Fernandez-Escamilla A.M., Rousseau F., Schymkowitz J., Serrano L. Prediction of sequence-dependent and mutational effects on the aggregation of peptides and proteins. Nat. Biotechnol. 2004;22:1302–1306. doi: 10.1038/nbt1012. [DOI] [PubMed] [Google Scholar]
- 19.Tartaglia G.G., Vendruscolo M. The Zyggregator method for predicting protein aggregation propensities. Chem. Soc. Rev. 2008;37:1395–1401. doi: 10.1039/b706784b. [DOI] [PubMed] [Google Scholar]
- 20.Tartaglia G.G., Pawar A.P., Campioni S., Dobson C.M., Chiti F., Vendruscolo M. Prediction of aggregation-prone regions in structured proteins. J. Mol. Biol. 2008;380:425–436. doi: 10.1016/j.jmb.2008.05.013. [DOI] [PubMed] [Google Scholar]
- 21.Ingram V.M. Gene mutations in human haemoglobin: the chemical difference between normal and sickle cell haemoglobin. Nature. 1957;180:326–328. doi: 10.1038/180326a0. [DOI] [PubMed] [Google Scholar]
- 22.Sormanni P., Aprile F.A., Vendruscolo M. The CamSol method of rational design of protein mutants with enhanced solubility. J. Mol. Biol. 2015;427:478–490. doi: 10.1016/j.jmb.2014.09.026. [DOI] [PubMed] [Google Scholar]
- 23.Smialowski P., Martin-Galiano A.J., Mikolajka A., Girschick T., Holak T.A., Frishman D. Protein solubility: sequence based prediction and experimental verification. Bioinformatics. 2007;23:2536–2542. doi: 10.1093/bioinformatics/btl623. [DOI] [PubMed] [Google Scholar]
- 24.Magnan C.N., Randall A., Baldi P. SOLpro: accurate sequence-based prediction of protein solubility. Bioinformatics. 2009;25:2200–2207. doi: 10.1093/bioinformatics/btp386. [DOI] [PubMed] [Google Scholar]
- 25.Connors L.H., Lim A., Prokaeva T., Roskens V.A., Costello C.E. Tabulation of human transthyretin (TTR) variants, 2003. Amyloid. 2003;10:160–184. doi: 10.3109/13506120308998998. [DOI] [PubMed] [Google Scholar]
- 26.Deng H.X., Hentati A., Tainer J.A., Iqbal Z., Cayabyab A., Hung W.Y., Getzoff E.D., Hu P., Herzfeldt B., Roos R.P., et al. Amyotrophic lateral sclerosis and structural defects in Cu,Zn superoxide dismutase. Science. 1993;261:1047–1051. doi: 10.1126/science.8351519. [DOI] [PubMed] [Google Scholar]
- 27.Castillo V., Ventura S. Amyloidogenic regions and interaction surfaces overlap in globular proteins related to conformational diseases. PLoS Comput. Biol. 2009;5:e1000476. doi: 10.1371/journal.pcbi.1000476. [DOI] [PMC free article] [PubMed] [Google Scholar]
- 28.Chiti F., Dobson C.M. Amyloid formation by globular proteins under native conditions. Nat. Chem. Biol. 2009;5:15–22. doi: 10.1038/nchembio.131. [DOI] [PubMed] [Google Scholar]
- 29.Cendron L., Trovato A., Seno F., Folli C., Alfieri B., Zanotti G., Berni R. Amyloidogenic potential of transthyretin variants: insights from structural and computational analyses. J. Biol. Chem. 2009;284:25832–25841. doi: 10.1074/jbc.M109.017657. [DOI] [PMC free article] [PubMed] [Google Scholar]
- 30.Floege J., Ketteler M. beta2-microglobulin-derived amyloidosis: an update. Kidney Int. Suppl. 2001;78:S164–S171. doi: 10.1046/j.1523-1755.2001.59780164.x. [DOI] [PubMed] [Google Scholar]
- 31.Hodkinson J.P., Radford S.E., Ashcroft A.E. The role of conformational flexibility in beta2-microglobulin amyloid fibril formation at neutral pH. Rapid Commun. Mass Spectrom. 2012;26:1783–1792. doi: 10.1002/rcm.6282. [DOI] [PMC free article] [PubMed] [Google Scholar]
- 32.De Simone A., Dhulesia A., Soldi G., Vendruscolo M., Hsu S.T., Chiti F., Dobson C.M. Experimental free energy surfaces reveal the mechanisms of maintenance of protein solubility. Proc. Natl. Acad. Sci. U.S.A. 2011;108:21057–21062. doi: 10.1073/pnas.1112197108. [DOI] [PMC free article] [PubMed] [Google Scholar]
- 33.Hanson R.M., Prilusky J., Renjian Z., Nakane T., Sussman J.L. JSmol and the next-generation web-based representation of 3D molecular structure as applied to proteopedia. Isr. J. Chem. 2013;53:207–216. [Google Scholar]
Associated Data
This section collects any data citations, data availability statements, or supplementary materials included in this article.