


Abstract
Massively parallel sequencing of microbial genetic markers (MGMs) is used to uncover the species composition in a multitude of ecological niches. These sequencing runs often contain a sample with known composition that can be used to evaluate the sequencing quality or to detect novel sequence variants. With NGS-eval, the reads from such (mock) samples can be used to (i) explore the differences between the reads and their references and to (ii) estimate the sequencing error rate. This tool maps these reads to references and calculates as well as visualizes the different types of sequencing errors. Clearly, sequencing errors can only be accurately calculated if the reference sequences are correct. However, even with known strains, it is not straightforward to select the correct references from databases. We previously analysed a pyrosequencing dataset from a mock sample to estimate sequencing error rates and detected sequence variants in our mock community, allowing us to obtain an accurate error estimation. Here, we demonstrate the variant detection and error analysis capability of NGS-eval with Illumina MiSeq reads from the same mock community. While tailored towards the field of metagenomics, this server can be used for any type of MGM-based reads. NGS-eval is available at http://www.ibi.vu.nl/programs/ngsevalwww/.
INTRODUCTION
Microbial genetic markers (MGMs) are genes or other DNA sequences that are widely used in phylogenetic and taxonomic analyses, for instance, in species classification and profiling of community structures in environmental sequencing (metagenomic) samples (1). The properties of MGMs that make them suitable for such analyses are their universal presence across species as well as their highly informative and relatively conserved sequence composition (2). The most commonly used MGMs for eukaryotes include the internal transcribed spacer region (3) and the 18S ribosomal RNA (rRNA) gene (4), and for prokaryotes, the spacer region between the 16S and 23S rRNA genes (5), as well as these genes themselves (6).
Although limited by laborious and costly molecular techniques, earlier studies relying on the cloning and (partial) sequencing of MGMs have uncovered the previously unknown biological diversity in various ecosystems (7,8). Recently, next-generation sequencing (NGS) has become a standard method for determining the community structure in environmental samples and other samples of microbial communities, for example, in seawater (9) and soil (10). Moreover, the same technique initiated the characterization of the human microbiome in health (11) and in disease (12), making it possible to establish relations between microbiome and host health status.
Environmental sequencing studies often include a ‘mock’ community sample, which is a low-diversity community with known composition. The sequencing data acquired from the mock samples has been used to (i) determine the influence of experimental noise on diversity estimates (13,14), (ii) standardize and improve experimental protocols to ensure consistency between sequencing runs (15) and (iii) evaluate the accuracy of data cleaning and taxonomic analysis pipelines (16–20). Furthermore, the mock samples can be used to determine the overall quality of a sequencing run, as well as error rates, such as the insertion, deletion and substitution rate (21,22). The accurate estimations of these errors predominantly depend on the use of correct reference sequences. This makes it essential to detect sequence variants that are missing in the reference dataset, which may otherwise lead to inflated errors (23). The identification of variants in metagenomic samples by the use of genetic markers is also key to detect clinically relevant novel bacterial strains (24) and taxonomic reconstruction (25).
Numerous tools exist for the correction of errors in high-throughput sequencing data (26), including those specifically developed for MGMs (19,20,27). However, there are only a limited number of methods for error rate calculation. DRISEE is an error estimation tool designed specifically for whole-genome shotgun metagenomics sequences and depends on the presence of artificially duplicated reads, making it unsuitable for reads from MGMs (28). To our knowledge, the only computational tool currently available for estimating sequencing error in reads from MGMs is the seq.error command in mothur (29). Here, the reads are aligned to a reference alignment of marker genes (e.g. 16S rDNAs). Next, the leading and trailing bases in reads that do not fall into an overlapping alignment region are considered artefacts and are trimmed before error rate estimation. This may lead to undesired effects. Since no visualization is provided, it is difficult to get insight into the error rates due to the likely presence of novel variants.
There are existing methods for variant calling and single nucleotide polymorphism discovery (30–32). However, these tools mainly focus on determining the significance of rare variants in single-organism studies using whole-genome shotgun data. Here, our purpose is different; we are looking for common variants in MGMs in microbial community samples that may affect error rates. Note that rare variants typically do not influence the accuracy of error rates. NGS-eval, presented here, facilitates the identification of common variants by visualizing the frequency of errors on each reference sequence; this allows the user to compare such frequencies to expected error rates and to determine whether they result from the presence of a variant sequence.
We have developed NGS-eval, a user-friendly web server, for estimating different types of sequencing errors in (mock) samples from MGM-based sequencing runs. The interactive plots in our tool can be used to explore the differences between the reads and their reference sequences to detect novel sequence variants. Using a mock community sample sequenced on an Illumina MiSeq platform, we show that accurate error rate estimations can only be achieved by the detection of such variants. While most suitable in the field of environmental sequencing, the NGS-eval server can be used for any type of marker-based sequencing output.
MATERIALS AND METHODS
Data preparation
The reads should be processed to ensure that contaminants, that is, reads from species not included in the sample, are removed. In addition, to estimate only the sequencing error, experimental bias other than that of sequencing, such as chimeric sequences formed during PCR amplification (17), should be removed from the reads. A number of data processing methods exist for this purpose (29,33,34). A description is also available in the NGS-eval online documentation. Please note that remaining contaminants can still inflate the estimated error.
Web server
Input
The required inputs consist of two sets of nucleotide sequences; the NGS reads (e.g. from Roche 454 or Illumina platforms, from a single sample) and the reference sequences corresponding to the reads. The references should be in FASTA format, whereas the reads can be uploaded in FASTA or FASTQ format, without or with compression (gzip or zip).
Optional inputs include the (gene-specific part of the) primer sequences used in the amplification of the marker gene or sequence. To prevent non-specific priming in reads from leading to inflated error estimates (cf. 23), the degenerate primer bases in the reference sequences can optionally be expanded to the corresponding IUPAC ambiguity characters. We also recommend using the processing option to trim (PCR) full-length reference sequences to the region of interest, for instance, full-length 16S rDNA sequences to the V4 hypervariable region. Likewise, in the case of paired-end sequencing, where the forward or the reverse reads may not fully cover the region of interest, these trimmed reference sequences can be further truncated to a length specified by the user (sequences shorter than this length are not filtered out).
Processing
First, the reads are dereplicated: one read becomes the representative read for each unique sequence and the IDs of all reads identical to it are stored. Next, the best-matching reference for each representative read is determined using the usearch_global command in USEARCH v.8.0 (35). Subsequently, optimal alignments are calculated by globally aligning each representative read to its reference sequence using the Needleman–Wunsch alignment algorithm implemented in EMBOSS needleall v6.6.0 (36). These alignments are parsed and sequencing errors, such as mismatches, insertions and deletions, are calculated for each reference sequence and for the overall sample. Finally, javascript objects are produced, which are used to plot the interactive graphs for each reference sequence in the user's web browser (using jqPlot, an open source project by Chris Leonello; http://www.jqplot.com/).
RESULTS AND DISCUSSION
Overview
NGS studies of microbial genetic markers (MGMs), for instance, the 16S rRNA gene, often include a ‘mock’ sample with a known species profile. Such a sample can be used for a variety of tasks, ranging from the evaluation of sequencing quality to the optimization of computational pipelines that handle NGS datasets. The NGS-eval server enables the analysis of the reads obtained from such microbial community samples for two main purposes:
Calculating the rates of different sequencing error types, such as insertions, deletions and substitutions. The results can be used to evaluate the overall quality of a sequencing run as well as to assess the influence of corrective tools, such as error correction algorithms, on the resulting data.
Detection of common sequence variants in the sample and correction of reference sequences, which is essential for accurate error rate estimates. This functionality can also be helpful for the identification of novel variants. The user can add such variants to the set of reference sequences and the server can be rerun to obtain an error rate that is more representative of sequencing error only.
Error analysis and variant detection
Previously, we analysed a pyrosequencing dataset, where the V5–V7 hypervariable region of the 16S rRNA gene was sequenced for a mock community (23). Using an initial reference dataset, the error rate calculated for substitutions was 10-fold higher than the values reported in literature. Further analysis with an earlier NGS-eval version led to the identification of seven novel sequence variants. The error rates were reduced to expected values after including these variants as additional reference sequences.
Here, we analysed 251-bp long forward and reverse reads from a paired-end Illumina MiSeq dataset, where the V4 hypervariable region was sequenced for the same mock community, following a MiSeq 16S rDNA protocol (37). Before mapping, chimeras in the forward or reverse reads were removed using USEARCH v.8.0 (35) by following the chimera removal procedure described in the NGS-eval online documentation. NGS-eval was separately run for the forward and reverse reads. The high substitution peak in Figure 1A shows an example of a common variant from this dataset, which was later confirmed with BLAST (NCBI BLAST against nr) to be present in sequences of the same strain, illustrating how error rates can be estimated more correctly using our server (Figure 1B and C). The overall error rate was calculated by summing the number of mismatches in all alignments and dividing the result by the total length of the alignments. A detailed description of this calculation is given in the online server documentation. The overall estimates for the error rates in the forward and reverse reads were 0.62% and 1.7%, respectively. This difference is expected since the reverse reads are generally of lower quality than the forward reads. Table 1 shows an overview of the error statistics reported by NGS-eval. The overall combined error rate, 1.2%, was similar to the values obtained previously (0.8%) for the MiSeq platform (38). The error rate reported for the same platform can be as low as 0.1% in the case of shotgun reads and trimming low-quality tails (39,40).
Figure 1.
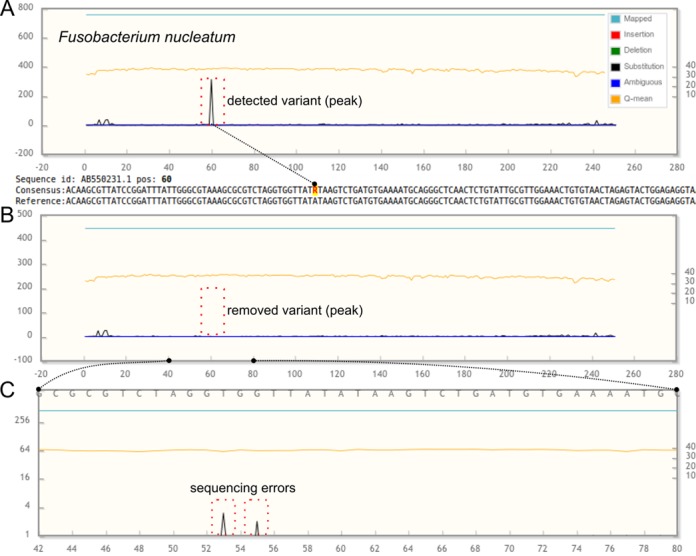
An example of interactive error plots for the (forward) reads obtained from the V4 region of the 16S rRNA gene of Fusobacterium nucleatum. (A) The reads were mapped to a single F. nucleatum reference sequence. At position 60 in the read above, a variant can be observed as a high substitution peak. Here, the server suggests a consensus base with IUPAC code R (A or G). (B) The reference sequence for the variant was added to the set of reference sequences and the reads were re-mapped to the new set, which led to the removal of the substitution peak and a reduced error rate. (C) When zooming into the region between positions 42 and 80, the complete absence of the substitution peak at position 60 can be observed, as well as two sequencing errors. Note the change in the number of mapped sequences (blue line) between (A) and (B), resulting from the mapping of variant sequence reads to the new reference (not shown) sequence during the re-mapping.
Table 1. Sequencing error statistics, such as the percentage of insertions, deletions and mismatches, are reported for each reference sequence and for the sample as a whole.
| Reference | InF | InR | DelF | DelR | SubF | SubR | MisF | MisR |
|---|---|---|---|---|---|---|---|---|
| S. oralis | 0.03 | 0.02 | 0.03 | 0.02 | 1.2 | 1.6 | 1.3 | 1.7 |
| S. mutans | 0.004 | 0.05 | 0.005 | 0.02 | 0.45 | 1.9 | 0.46 | 2.0 |
| P. gingivalis | 0.009 | 0.08 | 0.01 | 0.05 | 0.56 | 2.6 | 0.58 | 2.7 |
| P. nigrescens | 0.007 | 0.04 | 0.02 | 0.03 | 0.21 | 1.8 | 0.23 | 1.9 |
| All references | 0.01 | 0.04 | 0.01 | 0.03 | 0.60 | 1.6 | 0.62 | 1.7 |
The table shows the values for the chimera-free forward and reverse reads after separate calculations by NGS-eval. In: insertions, Del: deletions, Sub: substitutions, Mis: mismatches ( = In+Del+Sub), F: forward and R: reverse reads. All values are percentages.
Interactive visualization and server output files
The interactive analysis and visualization of the frequencies and positions of the errors in each reference resulted in the discovery of a sequence variant for one of the species (Figure 1). This functionality is provided by plotting the error data (e.g. insertions, deletions and substitutions) along the sequence coordinate of a selected reference. The data series to be plotted can be selected as well as the error axis scale(s) (unscaled, relative or logarithmic). In addition, the reference sequence itself can be added to the plot, which provides detailed insight into the bases at different positions on the zoomable sequence axis. Furthermore, the data points in the plots are clickable: upon a click, the corresponding position in the consensus sequence below the plot is highlighted. To support off-line usage and more in-depth analysis by the user, the error reports, as well as the calculated consensus sequences, can be downloaded. These reports include separate files for each reference sequence separately and a report for the total error rates.
CONCLUSION
The NGS-eval server provides a user-friendly way to inspect NGS datasets obtained from the sequencing of genetic markers in microbial communities. The error calculation functionality enables the evaluation of the overall sequencing quality and can further be used to assess the outcome of NGS data processing pipelines. The interactive plots in NGS-eval quickly illustrate the read coordinates where the errors occur. High frequency of errors at specific positions can be useful for detecting novel (common) sequence variants and identifying the differences between the strains that are present in the sample and that are used as reference sequences.
Acknowledgments
We thank Robert Edgar for providing support for USEARCH.
FUNDING
University of Amsterdam under the research priority area ‘Oral Infections and Inflammation’ (to W.C.). Funding for open access charge: None.
Conflict of interest statement. None declared.
REFERENCES
- 1.Ludwig W., Strunk O., Klugbauer S., Klugbauer N., Weizenegger M., Neumaier J., Bachleitner M., Schleifer K.H. Bacterial phylogeny based on comparative sequence analysis. Electrophoresis. 1998;19:554–568. doi: 10.1002/elps.1150190416. [DOI] [PubMed] [Google Scholar]
- 2.Case R.J., Boucher Y., Dahllöf I., Holmström C., Doolittle W.F., Kjelleberg S. Use of 16S rRNA and rpoB genes as molecular markers for microbial ecology studies. Appl. Environ. Microbiol. 2007;73:278–288. doi: 10.1128/AEM.01177-06. [DOI] [PMC free article] [PubMed] [Google Scholar]
- 3.Schoch C.L., Seifert K.A., Huhndorf S., Robert V., Spouge J.L., Levesque C.A., Chen W., Fungal Barcoding Consortium Nuclear ribosomal internal transcribed spacer (ITS) region as a universal DNA barcode marker for Fungi. Proc. Natl. Acad. Sci. U. S. A. 2012;109:6241–6246. doi: 10.1073/pnas.1117018109. [DOI] [PMC free article] [PubMed] [Google Scholar]
- 4.Moon-van der Staay S.Y., De Wachter R., Vaulot D. Oceanic 18S rDNA sequences from picoplankton reveal unsuspected eukaryotic diversity. Nature. 2001;409:607–610. doi: 10.1038/35054541. [DOI] [PubMed] [Google Scholar]
- 5.Jensen M.A., Webster J.A., Straus N. Rapid identification of bacteria on the basis of polymerase chain reaction-amplified ribosomal DNA spacer polymorphisms. Appl. Environ. Microbiol. 1993;59:945–952. doi: 10.1128/aem.59.4.945-952.1993. [DOI] [PMC free article] [PubMed] [Google Scholar]
- 6.Lane D.J., Pace B., Olsen G.J., Stahl D.A., Sogin M.L., Pace N.R. Rapid determination of 16S ribosomal RNA sequences for phylogenetic analyses. Proc. Natl. Acad. Sci. U. S. A. 1985;82:6955–6959. doi: 10.1073/pnas.82.20.6955. [DOI] [PMC free article] [PubMed] [Google Scholar]
- 7.Schmidt T.M., DeLong E.F., Pace N.R. Analysis of a marine picoplankton community by 16S rRNA gene cloning and sequencing. J. Bacteriol. 1991;173:4371–4378. doi: 10.1128/jb.173.14.4371-4378.1991. [DOI] [PMC free article] [PubMed] [Google Scholar]
- 8.Wilson K.H., Blitchington R.B. Human colonic biota studied by ribosomal DNA sequence analysis. Appl. Environ. Microbiol. 1996;62:2273–2278. doi: 10.1128/aem.62.7.2273-2278.1996. [DOI] [PMC free article] [PubMed] [Google Scholar]
- 9.Sogin M.L., Morrison H.G., Huber J.A., Mark Welch D., Huse S.M., Neal P.R., Arrieta J.M., Herndl G.J. Microbial diversity in the deep sea and the underexplored ‘rare biosphere’. Proc. Natl. Acad. Sci. U. S. A. 2006;103:12115–12120. doi: 10.1073/pnas.0605127103. [DOI] [PMC free article] [PubMed] [Google Scholar]
- 10.Fierer N., Breitbart M., Nulton J., Salamon P., Lozupone C., Jones R., Robeson M., Edwards R.A., Felts B., Rayhawk S., et al. Metagenomic and small-subunit rRNA analyses reveal the genetic diversity of bacteria, archaea, fungi, and viruses in soil. Appl. Environ. Microbiol. 2007;73:7059–7066. doi: 10.1128/AEM.00358-07. [DOI] [PMC free article] [PubMed] [Google Scholar]
- 11.Human Microbiome Project Consortium. Structure, function and diversity of the healthy human microbiome. Nature. 2012;486:207–214. doi: 10.1038/nature11234. [DOI] [PMC free article] [PubMed] [Google Scholar]
- 12.Turnbaugh P.J., Hamady M., Yatsunenko T., Cantarel B.L., Duncan A., Ley R.E., Sogin M.L., Jones W.J., Roe B.A., Affourtit J.P., et al. A core gut microbiome in obese and lean twins. Nature. 2009;457:480–484. doi: 10.1038/nature07540. [DOI] [PMC free article] [PubMed] [Google Scholar]
- 13.Caporaso J.G., Lauber C.L., Walters W.A., Berg-Lyons D., Lozupone C.A., Turnbaugh P.J., Fierer N., Knight R. Global patterns of 16S rRNA diversity at a depth of millions of sequences per sample. Proc. Natl. Acad. Sci. U.S.A. 2011;108(Suppl. 1):4516–4522. doi: 10.1073/pnas.1000080107. [DOI] [PMC free article] [PubMed] [Google Scholar]
- 14.Wu G.D., Lewis J.D., Hoffmann C., Chen Y.Y., Knight R., Bittinger K., Hwang J., Chen J., Berkowsky R., Nessel L., et al. Sampling and pyrosequencing methods for characterizing bacterial communities in the human gut using 16S sequence tags. BMC Microbiol. 2010;10:206. doi: 10.1186/1471-2180-10-206. [DOI] [PMC free article] [PubMed] [Google Scholar]
- 15.The NIH HMP Working Group. Peterson J., Garges S., Giovanni M., McInnes P., Wang L., Schloss J.A., Bonazzi V., McEwen J.E., Wetterstrand K.A., et al. The NIH Human Microbiome Project. Genome Res. 2009;19:2317–2323. doi: 10.1101/gr.096651.109. [DOI] [PMC free article] [PubMed] [Google Scholar]
- 16.Bonder M.J., Abeln S., Zaura E., Brandt B.W. Comparing clustering and pre-processing in taxonomy analysis. Bioinformatics. 2012;28:2891–2897. doi: 10.1093/bioinformatics/bts552. [DOI] [PubMed] [Google Scholar]
- 17.Schloss P.D., Gevers D., Westcott S.L. Reducing the effects of PCR amplification and sequencing artifacts on 16S rRNA-based studies. PLoS ONE. 2011;6:e27310. doi: 10.1371/journal.pone.0027310. [DOI] [PMC free article] [PubMed] [Google Scholar]
- 18.Haas B.J., Gevers D., Earl A.M., Feldgarden M., Ward D.V., Giannoukos G., Ciulla D., Tabbaa D., Highlander S.K., Sodergren E., et al. Chimeric 16S rRNA sequence formation and detection in Sanger and 454-pyrosequenced PCR amplicons. Genome Res. 2011;21:494–504. doi: 10.1101/gr.112730.110. [DOI] [PMC free article] [PubMed] [Google Scholar]
- 19.Quince C., Lanzen A., Davenport R.J., Turnbaugh P.J. Removing noise from pyrosequenced amplicons. BMC Bioinform. 2011;12:38. doi: 10.1186/1471-2105-12-38. [DOI] [PMC free article] [PubMed] [Google Scholar]
- 20.Reeder J., Knight R. Rapidly denoising pyrosequencing amplicon reads by exploiting rank-abundance distributions. Nat. Methods. 2010;7:668–669. doi: 10.1038/nmeth0910-668b. [DOI] [PMC free article] [PubMed] [Google Scholar]
- 21.Huse S.M., Huber J.A., Morrison H.G., Sogin M.L., Mark Welch D. Accuracy and quality of massively parallel DNA pyrosequencing. Genome Biol. 2007;8:R143. doi: 10.1186/gb-2007-8-7-r143. [DOI] [PMC free article] [PubMed] [Google Scholar]
- 22.Gilles A., Meglécz E., Pech N., Ferreira S., Malausa T., Martin J.F. Accuracy and quality assessment of 454 GS-FLX Titanium pyrosequencing. BMC Genomics. 2011;12:245. doi: 10.1186/1471-2164-12-245. [DOI] [PMC free article] [PubMed] [Google Scholar]
- 23.May A., Abeln S., Crielaard W., Heringa J., Brandt B.W. Unraveling the outcome of 16S rDNA-based taxonomy analysis through mock data and simulations. Bioinformatics. 2014;30:1530–1538. doi: 10.1093/bioinformatics/btu085. [DOI] [PubMed] [Google Scholar]
- 24.Clarridge J.E. III. Impact of 16S rRNA gene sequence analysis for identification of bacteria on clinical microbiology and infectious diseases. Clin. Microbiol. Rev. 2004;17:840–862. doi: 10.1128/CMR.17.4.840-862.2004. [DOI] [PMC free article] [PubMed] [Google Scholar]
- 25.Honda D., Yokota A., Sugiyama J. Detection of seven major evolutionary lineages in cyanobacteria based on the 16S rRNA gene sequence analysis with new sequences of five marine Synechococcus strains. J. Mol. Evol. 1999;48:723–739. doi: 10.1007/pl00006517. [DOI] [PubMed] [Google Scholar]
- 26.Yang X., Chockalingam S.P., Aluru S. A survey of error-correction methods for next-generation sequencing. Brief. Bioinform. 2013;14:56–66. doi: 10.1093/bib/bbs015. [DOI] [PubMed] [Google Scholar]
- 27.Huse S.M., Mark Welch D., Morrison H.G., Sogin M.L. Ironing out the wrinkles in the rare biosphere through improved OTU clustering. Environ. Microbiol. 2010;12:1889–1898. doi: 10.1111/j.1462-2920.2010.02193.x. [DOI] [PMC free article] [PubMed] [Google Scholar]
- 28.Keegan K.P., Trimble W.L., Wilkening J., Wilke A., Harrison T., D'Souza M., Meyer F. A platform-independent method for detecting errors in metagenomic sequencing data: DRISEE. PLoS Comput. Biol. 2012;8:e1002541. doi: 10.1371/journal.pcbi.1002541. [DOI] [PMC free article] [PubMed] [Google Scholar]
- 29.Schloss P.D., Westcott S.L., Ryabin T., Hall J.R., Hartmann M., Hollister E.B., Lesniewski R.A., Oakley B.B., Parks D.H., Robinson C.J., et al. Introducing mothur: open-source, platform-independent, community-supported software for describing and comparing microbial communities. Appl. Environ. Microbiol. 2009;75:7537–7541. doi: 10.1128/AEM.01541-09. [DOI] [PMC free article] [PubMed] [Google Scholar]
- 30.Wei Z., Wang W., Hu P., Lyon G.J., Hakonarson H. SNVer: a statistical tool for variant calling in analysis of pooled or individual next-generation sequencing data. Nucleic Acids Res. 2011;39:e132. doi: 10.1093/nar/gkr599. [DOI] [PMC free article] [PubMed] [Google Scholar]
- 31.Savage D., Batley J., Erwin T., Logan E., Love C.G., Lim G.A.C., Mongin E., Barker G., Spangenberg G.C., Edwards D. SNPServer: a real-time SNP discovery tool. Nucleic Acids Res. 2005;33:W493–W495. doi: 10.1093/nar/gki462. [DOI] [PMC free article] [PubMed] [Google Scholar]
- 32.Nijveen H., van Kaauwen M., Esselink D.G., Hoegen B., Vosman B. QualitySNPng: a user-friendly SNP detection and visualization tool. Nucleic Acids Res. 2013;41:W587–W590. doi: 10.1093/nar/gkt333. [DOI] [PMC free article] [PubMed] [Google Scholar]
- 33.Caporaso J.G., Kuczynski J., Stombaugh J., Bittinger K., Bushman F.D., Costello E.K., Fierer N., Peña A.G., Goodrich J.K., Gordon J.I., et al. QIIME allows analysis of high-throughput community sequencing data. Nat. Methods. 2010;7:335–336. doi: 10.1038/nmeth.f.303. [DOI] [PMC free article] [PubMed] [Google Scholar]
- 34.Edgar R.C., Haas B.J., Clemente J.C., Quince C., Knight R. UCHIME improves sensitivity and speed of chimera detection. Bioinformatics. 2011;27:2194–2200. doi: 10.1093/bioinformatics/btr381. [DOI] [PMC free article] [PubMed] [Google Scholar]
- 35.Edgar R.C. Search and clustering orders of magnitude faster than BLAST. Bioinformatics. 2010;26:2460–2461. doi: 10.1093/bioinformatics/btq461. [DOI] [PubMed] [Google Scholar]
- 36.Rice P., Longden I., Bleasby A. EMBOSS: the European Molecular Biology Open Software Suite. Trends Genet. 2000;16:276–277. doi: 10.1016/s0168-9525(00)02024-2. [DOI] [PubMed] [Google Scholar]
- 37.Kozich J.J., Westcott S.L., Baxter N.T., Highlander S.K., Schloss P.D. Development of a dual-index sequencing strategy and curation pipeline for analyzing amplicon sequence data on the MiSeq Illumina sequencing platform. Appl. Environ. Microbiol. 2013;79:5112–5120. doi: 10.1128/AEM.01043-13. [DOI] [PMC free article] [PubMed] [Google Scholar]
- 38.Quail M.A., Smith M., Coupland P., Otto T.D., Harris S.R., Connor T.R., Bertoni A., Swerdlow H.P., Gu Y. A tale of three next generation sequencing platforms: comparison of Ion Torrent, Pacific Biosciences and Illumina MiSeq sequencers. BMC Genomics. 2012;13:341. doi: 10.1186/1471-2164-13-341. [DOI] [PMC free article] [PubMed] [Google Scholar]
- 39.Loman N.J., Misra R.V., Dallman T.J., Constantinidou C., Gharbia S.E., Wain J., Pallen M.J. Performance comparison of benchtop high-throughput sequencing platforms. Nat. Biotechnol. 2012;30:434–439. doi: 10.1038/nbt.2198. [DOI] [PubMed] [Google Scholar]
- 40.Jünemann S., Sedlazeck F.J., Prior K., Albersmeier A., John U., Kalinowski J., Mellmann A., Goesmann A., von Haeseler A., Stoye J., et al. Updating benchtop sequencing performance comparison. Nat. Biotechnol. 2013;31:294–296. doi: 10.1038/nbt.2522. [DOI] [PubMed] [Google Scholar]