

Abstract
The hippocampus is a very important structure in memory formation and retrieval, as well as in various neurological disorders such as Alzheimer’s disease, epilepsy and depression. It is composed of many intricate subregions making it difficult to study the anatomical changes that take place during disease. The hippocampal hilus may have unique neuroanatomy in humans compared to monkeys and rodents, with field CA3h greatly enlarged in humans compared to rodents, and a white-matter pathway, called the endfolial pathway, possibly only present in humans. In this study we have used newly developed 7.0T whole brain imaging, balanced steady-state free precession (bSSFP) that can achieve 0.4 mm isotropic images to study, in vivo, the anatomy of the hippocampal hilus. A detailed hippocampal subregional segmentation was performed according to anatomic atlases segmenting the following regions: CA4, CA3, CA2, CA1, SRLM (stratum radiatum lacunosum moleculare), alveus, fornix, and subiculum along with its molecular layer. We also segmented a hypointense structure centrally within the hilus that resembled the endfolial pathway. To validate that this hypointense signal represented the endfolial pathway, we acquired 0.1 mm isotropic 8-phase cycle bSSFP on an excised specimen, and then sectioned and stained the specimen for myelin using an anti-myelin basic protein antibody (SMI 94). A structure tensor analysis was calculated on the myelin-stained section to show directionality of the underlying fibers. The endfolial pathway was consistently visualized within the hippocampal body in vivo in all subjects. It is a central pathway in the hippocampus, with unknown relevance in neurodegenerative disorders, but now that it can be visualized noninvasively, we can study its function and alterations in neurodegeneration.
Introduction
The medial temporal lobe (MTL) plays an important role in memory formation and retrieval and as well as in various neurological disorders such as Alzheimer’s disease, epilepsy, depression and traumatic brain injury. Studying the structural changes that occur in the hippocampus, the centerpiece of the MTL, may aid in understanding of these disorders. The hippocampus is composed of several tightly packed, intricate subregions making it difficult to identify the anatomical changes that take place during disease. Subfields include the cornu ammonis regions (CA1, CA2, CA3 and CA4), the dentate gyrus (DG), and the subiculum, and these serve different functions and are variably affected by neurodegenerative diseases (Burggren et al., 2008; Mueller and Weiner, 2009). The CA fields consist of a pyramidal cell layer as well as the stratum radiatum (contains commissural fibers and schaffer collaterals, and apical dendrites of CA1/2/3 neurons), stratum lacunosum moleculare (contains schaffer collaterals and perforant pathway fibers and apical dendrites of CA1/2/3 neurons) and the stratum oriens (contains basal dendrites of pyramidal neurons, septal fibers and commissural fibers)(Insausti and Amaral, 2008). The medial and lateral entorhinal cortex sends projections to the dentate gyrus that perforate through the subiculum (Scher et al., 2007; Witter and Amaral, 1991) The dentate gyrus in turn sends unmyelinated projections called the mossy fibers that innervate the CA4 and CA3 pyramidal cells (Kondo et al., 2009). These cells then send out the Schaffer collaterals that synapse onto the CA1 pyramidal cells (Rosene and Van Hoesen, 1977). However, in addition to the above trisynaptic pathway, the hippocampus has various efferent and afferent connections: fornix (fibers from the CA3 and subiculum), commissural fibers (from CA3 to contralateral CA3) and fibers from the locus coeruleus.
The hippocampal hilus may have neuroanatomy that is unique to humans, with field CA4 greatly enlarged compared to rodents (Lim et al., 1997), though its independent existence is controversial (Amaral, 1978; de No, 1934). Moreover, a white-matter pathway called the endfolial (EF) pathway may only be present in humans (Lim et al., 1997). Anatomically, the EF pathway consists of myelinated axons of field CA4 that originate in the pyramidal neurons of the hippocampal hilus and travel superomedially within the stratum oriens, just inferior to the alveus, possibly an extended part of the Schaffer system (Lim et al., 1997)(Fig. 1A). While seemingly an important part of mnemonic circuitry consisting of output from hilar pyramidal neurons, this pathway has yet to be further explored.
Figure 1.
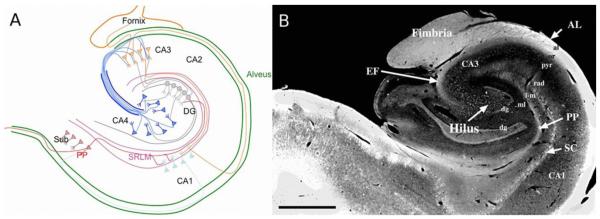
A) Illustration of intra-hippocampal connectivity. SRLM – stratum radiatum lacunosum moleculare; DG – dentate gyrus; PP – perforant pathway; Sub = subiculum; SO – stratum oriens. B) Figure 1B from the 1997 Lim paper (citation) demonstrates human hippocampal architecture. The four myelinated layers, perforant pathway (PP), myelinated portion of the Schaffer collateral system (SC), the endfolial fiber pathway (EF), and the alveus (AL) are hyperintense. Scale bar 2.5 mm. “Reprinted from Journal of Comparative Neurology, Vol. 385, Lim C, Mufson EJ, Kordower JH, Blume HW, Madsen JR, Saper CB., Connections of the hippocampal formation in humans: II. The endfolial fiber pathway, pp. 352-371. Copyright 1997, with permission from John Wiley and Sons.”(Lim et al., 1997)
The hippocampus is frequently targeted in magnetic resonance imaging (MRI) studies due to its important roles in memory formation and retrieval, and its implication in many diseases and disorders. Studying the hippocampus at high-resolution in-vivo may lead to better imaging biomarkers and improve diagnostic accuracy (Kerchner, 2011; Kerchner et al., 2010; Yushkevich et al., 2009). We have recently shown that at 7.0 T, balanced steady state free precession (bSSFP) demonstrates high signal-to-noise ratio and produces a superior depiction of the MTL (Zeineh et al., 2014). In this study we have used the bSSFP sequence at 7.0 T to further investigate the ultra-structure of the hippocampus, and have found that we can reliably identify the EF pathway in vivo. We verified this in vivo finding by performing specimen MRI using an identical sequence, and subsequent histologic analysis to prove the distinct orientation within this structure. This demonstrates the remarkable resolution achievable at high field to investigate pathways possibly unique to humans.
Methods
Acquisition & Image Processing
In accordance with Stanford’s Institutional Review Board and Health Insurance Portability and Accountability Act compliance, eight healthy, normal subjects were imaged on a GE 7.0 T Discovery MR950 whole-body scanner (GE Healthcare, Waukesha, WI) using a 32-channel receive head coil contained within a quadrature transmit coil (Nova Medical, Inc., Wilmington, MA). A 2nd order shim sequence was run, and uniformity measured over a 3D cubic volume encompassing the whole brain including the temporal lobes, approximately 20 cm in size. We achieved a uniformity of approximately 20 Hz r.m.s. across the prescription with one to two iterations of shimming, verified by running the shim sequence a final time without any adjustments thereafter. According to our prior work (Zeineh et al., 2014), we acquired 8 even increments of phase-cycled bSSFP (3D Fast Imaging Employing Steady-state Acquisition (FIESTA)), coronal, frequency S/I, TR 8.2 ms, TE 4.1 ms, FA 25°, BW 62 kHz, FOV 17×17×19.2 cm, 420×420×480 (0.4 mm isotropic acquisition). Images were reconstructed to 512×512×480 using the standard GE reconstruction that utilizes zero-filling and Fermi filtering resulting in an anisotropic pixel size of 0.33×0.33×0.4 mm. Partial Fourier encoding was performed acquiring approximately 58% of the phase encoding steps (half k-space with 32 overscans) and two-dimensional parallel imaging using acceleration factor of 1.75×1.75 (Griswold et al., 2002). The scan time was 5 min 11 s per phase cycle, making the total acquisition time approximately 40 minutes. One volunteer moved on two of the bSSFP phase-cycles, so these were repeated. Another volunteer underwent 6 rather than 8 phase-cycles due to scan timing constraints. Six of these subjects were scanned as part of our prior work, and two were unique to this study. Due to motion between phase cycles, using methods previously published by our group (Zeineh et al., 2014), individual phase cycle images were combined into an initial sum-of-squares (SOS-1) image followed by a rigid body alignment of each phase cycle to the SOS-1. These were then recombined into a second SOS image to produce a final reconstructed volume, which was used for segmentation and analysis.
On one additional subject (not one of the eight subjects above), we performed the same sequence at a lower acquisition resolution of 0.6 mm isotropic by using the following parameters: 4 phase cycles, 3D FIESTA (a sequence employing steady-state free precession), coronal, frequency S/I, TR 8.1 ms, TE 4.05 ms, FA 25°, BW 35 kHz, FOV 18×18×23.4 cm, 300×300×390, reconstructed to 512×512×390, acceleration factor 2×2, complete Fourier encoding of all phase encoding steps, Turbo acceleration factor 2, 2 min 53 s per phase cycle. The image processing pipeline was otherwise identical for this subject.
Subfield Analysis
The final reconstructed and aligned bSSFP volumes were visualized using ITK-SNAP (www.itksnap.org). Segmentation of hippocampal subregions was performed manually according to anatomic atlases and our prior work (Duvernoy, 2005; Insausti and Amaral, 2008; Yushkevich et al., 2009; Zeineh et al., 2012). Detailed hippocampal subfield segmentation was performed of the hippocampal body only, not the tail or head. The anterior aspect of the hippocampal body is defined as the first slice posterior to the uncal apex. The hippocampal tail’s anterior boundary was defined as the first slice where the hippocampus begins to elongate in the superiomedial-inferiolateral direction, and the slice immediately anterior was defined as the posterior-most hippocampal body.
1. Endfolial pathway
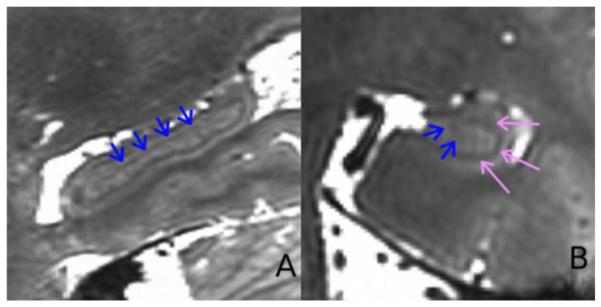
On the coronal plane, the EF pathway was observed as a hypointense diagonal band extending inferiolaterally from the fornix to the center of the hilus (Fig. 2C). In the sagittal plane, the endfolial pathway was the hypointense band between the superior and inferior SRLM (stratum radiatum and lacunosum moleculare) (Fig. 2A), just below the fornix and located between CA3 and CA4/DG.
Figure 2.

In vivo segmentation of hippocampal subfields. A) Sagittal plane showing the hippocampus where the hypointense band is the endfolial pathway (blue arrows) and the teeth-like undulations can be observed. B) Overlay of the segmentations. C and D show the hippocampal body in the coronal plane, without and with segmentation, respectively. Pink arrows show the SRLM in C.
The segmentation was performed in the coronal plane using the following rules: the superior boundary was the fornix and the inferior boundary was the inferior-most extent of the hypointensity within the hilus. In sections where it was difficult to see the hypointense band of the EF, we marked only one voxel below the fornix as the EF; this occurred in approximately 5% of slices. If the inferior-most portion of the hypointense band of the EF seemed to curve upwards laterally, such that it was contiguous with the SRLM, we only segmented one voxel of curvature upwards such that the SRLM and EF segmentations were not contiguous with each other. We bridged discontinuities within the EF on the sagittal plan. We were able to observe the endfolial extend into the head for about 4-5 slices (1.2 – 1.6 mm), however we did not include those slices in our segmentations.
2. SRLM (stratum radiatum and stratum lacunosum moleculare)
The SRLM was observed as a thin hypointense C-shaped strip centrally within the hippocampal body. The structure was always segmented as at least 1 pixel wide. Wherever it was difficult to see a hypointense signal, we filled in the structure based on adjacent slices and a multi-planar analysis. The medial extent of the inferior SRLM was marked at the medial extent of the CA4DG sublayer. The medial extent of the superior SRLM was marked up to where the hypointense band terminates. When the hippocampal sulcus was present, we always segmented external to it, so as not to include the dentate molecular layer.
3. Alveus
The alveus was observed as the hypointense band surrounding the hippocampus proper. The inferior-lateral boundary was extended to the inferior boundary of the adjacent temporal horn of the lateral ventricle. The alveus was observed as a relatively darker band of 1-2 pixels just inferior to the thickened hypointense band of the fornix.
4. Fornix
The fornix was segmented as the thickened hypointense band just superior to the alveus. The lateral boundary was where this hypointensity transitioned from greater than or equal to 2 voxels in thickness to one voxel in thickness. The medial boundary of the fornix was CSF in the ambient cistern. Sometimes the fornix was situated more medially within the ambient cistern for different subjects, and in such cases it was identified as the hypointense signal above the molecular layer of subiculum and below the adjacent lateral geniculate nucleus.
5. CA4DG
It was segmented as the hyperintense region located centrally within the body of the hippocampus encapsulated by the SRLM. The medial boundary was the fimbriodentate sulcus. The superior boundary was the superior curvature of the SRLM. An imaginary line was drawn from the medial aspect of the superior SRLM down to the inferior-most EF, this formed the border between CA3 and CA4DG.
6. CA3
The superior-lateral boundary of CA3 was marked at the most medial extent of the superior SRLM layer. The inferior lateral boundary of the CA3 extended around the superior tip of the SRLM and was marked at the inferior extent of the EF. The medial extent of the CA3 was marked at the EF. For slices where the EF was segmented as just one pixel, the CA3 was segmented contiguous with the adjacent slices.
7. CA2
The medial boundary of the CA2 was marked as immediately superior to the medial extent of SRLM. The lateral boundary was marked as immediately superior to the lateral-most edge of CA4DG.
8. CA1
CA1 was segmented as the gray matter strip just external inferiorly and laterally to the SRLM. The superior-medial border was marked at the lateral extent of the CA2. The inferior-medial border was marked as a straight vertical line from the medial extent of CA4DG.
9. Subicular Complex
The lateral border was at the medial extent of the CA1.The medial border is at the medial upper corner of the parahippocampal gyrus.
10. Subicular molecular layer
The molecular layer was observed as a hypointense strip just superior to the subiculum, contiguous with the SRLM. The lateral edge was marked at the medial extent of the SRLM and the medial border was marked at the upper medial corner just as the subiculum begins to bend inferiorly.
Specimen Scanning and Staining
To validate that this hypointense signal represented the EF pathway, we acquired 0.1 mm isotropic data on an excised specimen using a transmit-receive solenoidal coil (coronal, 8-phase cycle 3D FIESTA using a bSSFP acquisition, frequency S/I, TR 21 ms, TE 10.5 ms, FA 20°, BW 8 kHz, 0.1 mm isotropic voxels, FOV 3×3×2.56 cm, 300×300×256, reconstructed to 512×512×256, complete Fourier encoding acquiring all phase encoding lines, total scan time 3 h 37 min) (Fig. 5B). The specimen was then sectioned at 10 μm thickness and embedded on slides, then incubated in a 1:1000 dilution of SMI94 antibody for 24 hours at 4° C, and rinsed with 3 changes of TBS for 5 minutes each. Slides were then incubated in 1:300 dilution of horse anti-mouse biotinylated secondary antibody for 30 minutes (product code BA2000, Vector Laboratories, Burlington, ON) and rinsed in TBS for 3×5 minutes. Tissue sections were processed using the ABC solution for 45 minutes (product code PK 4000), rinsed in TBS for 3 × 5 minutes, and incubated in 0.5 mg/ml of 3,3′-diaminobenzidine working solution (product code SK4100) for 30-60 seconds for coloration. Slides were then dehydrated through 70%, 95% and 100% alcohol for 3 minutes each, cleared using 2 changes of xylene for 5 minutes each, and cover slipped for microscopic examination. An Olympus Fv10i microscope was used to take images of the slides at 10X resolution with an image size of approximately 15,000 × 15,000 pixels covering a 2 cm field of view, resulting in a pixel size of approximately 0.75 μm.
Figure 5.

A) in vivo bSSFP scan, B) Excised bSSFP scan, C) Myelin stain in a hippocampal slice (from the same specimen scanned for C. D) Structure tensor analysis of the myelin stain in C. The bottom row is zoomed in to show the junction of endfolial pathway, alveus, stratum oriens and fornix.
A structure tensor analysis was calculated on the myelin stain (Fig. 5D) to show directionality of the underlying fibers using the OrientationJ analysis tool (http://bigwww.epfl.ch/demo/orientation/) in Fiji (http://fiji.sc/Fiji) using a cubic spline gradient of 30 pixels (Budde and Frank, 2012; Rezakhaniha et al., 2012).
Results
In all 8 subjects, we identified a hypointense region medial to the SRLM layer and centrally within the hilus (blue arrows in Fig. 2A & C), which was consistent in location with the EF pathway (Lim et al., 1997). It was brighter in signal intensity than the adjacent fornix. It begins centrally within the hilar region and then curves upwards as it travels medially forming the medial wall of CA3. The pathway can be observed in vivo to begin about 4-5 slices anterior to the hippocampal body.
When viewed sagittally, the anterior end of the EF pathway lies centrally within the CA4/DG in lateral sections and begins to move superior-medially (Fig. 2B). The EF demonstrates a slow undulation up and down as it extends posteriorly (blue arrows, Fig. 2A). All datasets showed this undulation, each having about 2 dips (Fig. 4). The posterior end of the EF is once again located centrally within the CA4/DG segmentation. In a separate, shorter acquisition at lower resolution on a single subject, we demonstrate that the EF pathway can be visualized (Fig. 3).
Figure 4.

3D rendering of hippocampal subfields. A-D shows renderings of the left hippocampus in 4 different subjects. The bottom show the same 4 subjects, with the view rotated to visualize from above and the fornix and alveus removed.
Figure 3.
Example of a 0.6 mm isotropic bSSFP, 4-phased directions dataset collected in 12 minutes. A) Sagittal and B) Coronal view of the hippocampus. Blue arrows point to the endfolial pathway and the pink to the SRLM.
The volume of the EF pathway for the left and right hemispheres is 21 mm3 and 19 mm3 respectively, which is about 1/20th that of SRLM, with no left-right differences present (Table 1). 3D rendering of the EF shows it occupying the expected location within the hilus, and having some digitations along its course, possibly related to digitations inherent in the hilus and/or a segmentation artifact from slices where it is difficult to visualize (Fig. 4). As seen on coronal images, the endfolial is encapsulated by the hilus, and dense digitations are present, somewhat reflected in the adjacent CA4DG (bottom row Fig. 4). The EF extends superiorly and curves in contiguity towards the alveus/fornix (top row Fig. 4).
Table 1.
Volumes in mm3, just within the hippocampal body.
| L | R | |
|---|---|---|
| Fornix | 55 ± 12 | 62 ± 5 |
| Alveus | 46 ± 7 | 50 ± 3 |
| CA2 | 29 ± 3 | 24 ± 7 |
| CA3 | 51 ±14 | 63 ± 9 |
| EF | 21 ± 1 | 19 ± 1 |
| CA4/DG | 188 ± 22 | 167 ± 24 |
| SRLM | 481± 63 | 492 ± 90 |
| CA1 | 276 ± 11 | 264 ± 31 |
| Sub Mol | 49 ± 4 | 53 ± 6 |
| Sub | 238 ± 23 | 230 ± 17 |
Excised imaging demonstrated that the endfolial pathway was similarly hyperintense compared with the fornix and contiguous with the stratum oriens. The myelin stain and its structural orientation map (Fig. 5C & D) confirms that the endfolial pathway does not join the alveus but traverses along its undersurface (Lim et al., 1997), similar to silver stains of the hippocampus ((Duvernoy, 2005), Chapter 3, Fig. 9). As seen in Figure 5D, the EF pathway fibers within the hilar region begin deep within the hilus and point superomedially, then travel superiorly, then curve as they reach just inferior to the alveus and fornix, after which they travel in a left-right direction. In contrast, the fibers of the fornix and alveus, just superior to the EF, travel diagonally and have a distinct and separable color orientation (Fig. 5D, lower panel). A portion of the perforant pathway likely at the subicular/CA 1 junction can be seen to progress in a similar diagonal orientation as the inferior-most EF.
Discussion
In vivo imaging, ex vivo imaging and histology confirm that a hypointense structure within the central hippocampus corresponds to the morphology of the human-unique endfolial pathway, a structure only once ever reported in literature. The high isotropic resolution of the bSSFP scans enabled us to characterize the endfolial, an extremely small but possibly important pathway, in every subject we scanned. We provide validation by correlating our in vivo segmentation with higher resolution ex vivo imaging and histology.
A major strength of our work is the ultra-high isotropic resolution of the scans. Based on the scale bar in figure 1B from Lim’s article (Lim et al., 1997), the EF pathway is at most 0.3 mm in width in the left-right direction, which would make its observation difficult with resolutions much lower than our data. In fact, even with this high resolution, the hypointense structure was not easily observed in all slices. The relative mild hyperintensity of the structure may relate to partial voluming, the degree of myelination, and/or the orientation of the myelin (Liu, 2010) given it is oriented differently when compared to the fornix.
The EF pathway undulates about 2-3 times in each subject as shown in Figure 4. This maybe a result of the digitations observed within the granular cell layer of the dentate gyrus, the CA1 and the subiculum as reported in dissection studies of the hippocampus (Kominami et al., 2013; Yasutaka et al., 2013)
With the advent of better technology and higher field-strength scanners, more groups are attempting to segment the hippocampus more accurately using higher resolution scans (Winterburn et al., 2013; Wisse et al., 2012; Yushkevich et al., 2010; Zeineh et al., 2012). This also allows for segmenting white matter of the hippocampus such as the stratum radiatum/lacunosum moleculare (Winterburn et al., 2013; Zeineh et al., 2012), which may aide in understanding different neurodegenerative diseases (Brickman et al, 2012). For all subfields of the hippocampal body, except the EF pathway, our work adheres to histologically outlined boundaries (Duvernoy, 2005; Insausti and Amaral, 2008) and thus we believe we can accurately segment out the hippocampus with our acquisition methodology. Our work adds to existing hippocampal subfield segmentation protocols by precisely defining the endfolial pathway, which should facilitate more detailed investigations of microstructure in the MTL. Additionally, further exploration of the EF pathway should impact mnemonic models of hippocampal circuitry. Other groups have performed high resolution ex vivo scanning on hippocampi specimen (Augustinack et al., 2005; Shepherd et al., 2006), however, characterization of the EF pathway is yet to be done.
Excised imaging and histology show that the EF pathway is in fact separate from the alveus and the fornix. However, Lim et al., studied the trajectory of this pathway in detail and suggest that the EF pathway runs within the stratum oriens as they originate in the hilus, but the density of these fibers diminish substantially on reaching the CA2 (Lim et al., 1997). They speculate the fibers cross the pyramidal cell layer and move orthogonally out of the plane to continue further to be in contiguity with the Schaffer system. Given the limited information about this pathway, there is not currently a gold standard with regard to its topography. While the pathway is of unknown clinical relevance, the role may be significant given the importance of the hilus to hippocampal function.
Application may be limited by the long acquisition time, but the structure is apparent (Fig. 3, blue arrows) at slightly lower imaging resolutions that can be more easily achieved (0.6 mm isotropic, under 12 minutes acquisition) and exploring this will be the subject of our future work. Moreover, data acquisition at 7.0 T is of such high resolution that we can translate freely between in vivo, ex vivo and histology. Our future work will also involve segmenting the EF pathway in disease states such as epilepsy and Alzheimer’s disease. For studies where obtaining higher resolution imaging data may not be possible, thus limiting quantitative volumetric analysis, qualitative assessment of the presence, absence or abnormality of the pathway may still be performed. Additionally, studies of neurodegenerative diseases that involve the usage of excised specimen and histological analysis may perhaps benefit from examining this pathway due to its prominence in the hippocampus.
Despite the complicated structure of the hippocampus, our work demonstrates that ultra-high resolution in vivo scanning can be used for reliable segmentation of its subfields; even subfields that have scarcely been characterized in the past. Our work extends subfield segmentation by further segmenting the intricate white matter layers of the hippocampus. Additionally we correlated our segmentation findings with histology and reported an uncharacterized unique human pathway that was observed in vivo.
Highlights.
Ultra-high resolution in-vivo bSSFP acquisition reveals the endfolial (EF) pathway
Specimen imaging and histology validate the in-vivo characterization of the EF pathway
High-resolution imaging facilitates segmentation of white and gray matter subfields of the hippocampus
Acknowledgements
We would like to acknowledge GE Healthcare and NIH (S10 RR026351) for their support, Ricardo Insausti for his discussion regarding the endfolial pathway, Markus Axer for his suggestions regarding the tensor structural analysis, and Sherveen Parivash for his comments on this manuscript.
Footnotes
Publisher's Disclaimer: This is a PDF file of an unedited manuscript that has been accepted for publication. As a service to our customers we are providing this early version of the manuscript. The manuscript will undergo copyediting, typesetting, and review of the resulting proof before it is published in its final citable form. Please note that during the production process errors may be discovered which could affect the content, and all legal disclaimers that apply to the journal pertain.
References
- Amaral DG. A Golgi study of cell types in the hilar region of the hippocampus in the rat. J Comp Neurol. 1978;182:851–914. doi: 10.1002/cne.901820508. [DOI] [PubMed] [Google Scholar]
- Augustinack JC, van der Kouwe AJ, Blackwell ML, Salat DH, Wiggins CJ, Frosch MP, Wiggins GC, Potthast A, Wald LL, Fischl BR. Detection of entorhinal layer II using 7Tesla [corrected] magnetic resonance imaging. Ann Neurol. 2005;57:489–494. doi: 10.1002/ana.20426. [DOI] [PMC free article] [PubMed] [Google Scholar]
- Budde MD, Frank JA. Examining brain microstructure using structure tensor analysis of histological sections. Neuroimage. 2012;63:1–10. doi: 10.1016/j.neuroimage.2012.06.042. [DOI] [PubMed] [Google Scholar]
- Burggren AC, Zeineh MM, Ekstrom AD, Braskie MN, Thompson PM, Small GW, Bookheimer SY. Reduced cortical thickness in hippocampal subregions among cognitively normal apolipoprotein E e4 carriers. Neuroimage. 2008;41:1177–1183. doi: 10.1016/j.neuroimage.2008.03.039. [DOI] [PMC free article] [PubMed] [Google Scholar]
- de No RL. Studies on the structure of the cerebral cortex XI Continuation of the study of the ammonic system. Journal Fur Psychologie Und Neurologie. 1934;46:113–177. [Google Scholar]
- Duvernoy H. Brain Anatomy. Magnetic Resonance in Epilepsy: Neuroimaging Techniques. (2nd Edition) 2005:29–97. [Google Scholar]
- Griswold MA, Jakob PM, Heidemann RM, Nittka M, Jellus V, Wang J, Kiefer B, Haase A. Generalized autocalibrating partially parallel acquisitions (GRAPPA) Magn Reson Med. 2002;47:1202–1210. doi: 10.1002/mrm.10171. [DOI] [PubMed] [Google Scholar]
- Insausti R, Amaral DG. Entorhinal cortex of the monkey: IV. Topographical and laminar organization of cortical afferents. J Comp Neurol. 2008;509:608–641. doi: 10.1002/cne.21753. [DOI] [PMC free article] [PubMed] [Google Scholar]
- Kerchner GA. Ultra-high field 7T MRI: a new tool for studying Alzheimer’s disease. J Alzheimers Dis. 2011;26(Suppl 3):91–95. doi: 10.3233/JAD-2011-0023. [DOI] [PubMed] [Google Scholar]
- Kerchner GA, Hess CP, Hammond-Rosenbluth KE, Xu D, Rabinovici GD, Kelley DA, Vigneron DB, Nelson SJ, Miller BL. Hippocampal CA1 apical neuropil atrophy in mild Alzheimer disease visualized with 7-T MRI. Neurology. 2010;75:1381–1387. doi: 10.1212/WNL.0b013e3181f736a1. [DOI] [PMC free article] [PubMed] [Google Scholar]
- Kominami R, Shinohara H, Yasutaka S, Kishibe M. The human hippocampus observed by scanning electron microscopy (SEM): the dentate gyrus is made of an array of the neuronal lamellae. Okajimas Folia Anat Jpn. 2013;89:157–164. doi: 10.2535/ofaj.89.157. [DOI] [PubMed] [Google Scholar]
- Kondo H, Lavenex P, Amaral DG. Intrinsic connections of the macaque monkey hippocampal formation: II. CA3 connections. J Comp Neurol. 2009;515:349–377. doi: 10.1002/cne.22056. [DOI] [PMC free article] [PubMed] [Google Scholar]
- Lim C, Mufson EJ, Kordower JH, Blume HW, Madsen JR, Saper CB. Connections of the hippocampal formation in humans: II. The endfolial fiber pathway. J Comp Neurol. 1997;385:352–371. [PubMed] [Google Scholar]
- Liu C. Susceptibility tensor imaging. Magn Reson Med. 2010;63:1471–1477. doi: 10.1002/mrm.22482. [DOI] [PMC free article] [PubMed] [Google Scholar]
- Mueller SG, Weiner MW. Selective effect of age, Apo e4, and Alzheimer’s disease on hippocampal subfields. Hippocampus. 2009;19:558–564. doi: 10.1002/hipo.20614. [DOI] [PMC free article] [PubMed] [Google Scholar]
- Rezakhaniha R, Agianniotis A, Schrauwen JT, Griffa A, Sage D, Bouten CV, van de Vosse FN, Unser M, Stergiopulos N. Experimental investigation of collagen waviness and orientation in the arterial adventitia using confocal laser scanning microscopy. Biomech Model Mechanobiol. 2012;11:461–473. doi: 10.1007/s10237-011-0325-z. [DOI] [PubMed] [Google Scholar]
- Rosene DL, Van Hoesen GW. Hippocampal efferents reach widespread areas of cerebral cortex and amygdala in the rhesus monkey. Science. 1977;198:315–317. doi: 10.1126/science.410102. [DOI] [PubMed] [Google Scholar]
- Scher AI, Xu Y, Korf ES, White LR, Scheltens P, Toga AW, Thompson PM, Hartley SW, Witter MP, Valentino DJ, Launer LJ. Hippocampal shape analysis in Alzheimer’s disease: a population-based study. Neuroimage. 2007;36:8–18. doi: 10.1016/j.neuroimage.2006.12.036. [DOI] [PubMed] [Google Scholar]
- Shepherd TM, Ozarslan E, King MA, Mareci TH, Blackband SJ. Structural insights from high-resolution diffusion tensor imaging and tractography of the isolated rat hippocampus. Neuroimage. 2006;32:1499–1509. doi: 10.1016/j.neuroimage.2006.04.210. [DOI] [PubMed] [Google Scholar]
- Winterburn JL, Pruessner JC, Chavez S, Schira MM, Lobaugh NJ, Voineskos AN, Chakravarty MM. A novel in vivo atlas of human hippocampal subfields using high-resolution 3 T magnetic resonance imaging. Neuroimage. 2013;74:254–265. doi: 10.1016/j.neuroimage.2013.02.003. [DOI] [PubMed] [Google Scholar]
- Wisse LE, Gerritsen L, Zwanenburg JJ, Kuijf HJ, Luijten PR, Biessels GJ, Geerlings MI. Subfields of the hippocampal formation at 7 T MRI: in vivo volumetric assessment. Neuroimage. 2012;61:1043–1049. doi: 10.1016/j.neuroimage.2012.03.023. [DOI] [PubMed] [Google Scholar]
- Witter MP, Amaral DG. Entorhinal cortex of the monkey: V. Projections to the dentate gyrus, hippocampus, and subicular complex. J Comp Neurol. 1991;307:437–459. doi: 10.1002/cne.903070308. [DOI] [PubMed] [Google Scholar]
- Yasutaka S, Shinohara H, Kominami R. Gross anatomical tractography (GAT) proposed a change from the ‘Two laminae concept’ to the ‘Neuronal unit concept’ on the structure of the human hippocampus. Okajimas Folia Anat Jpn. 2013;89:147–156. doi: 10.2535/ofaj.89.147. [DOI] [PubMed] [Google Scholar]
- Yushkevich PA, Avants BB, Pluta J, Das S, Minkoff D, Mechanic-Hamilton D, Glynn S, Pickup S, Liu W, Gee JC, Grossman M, Detre JA. A high-resolution computational atlas of the human hippocampus from postmortem magnetic resonance imaging at 9.4 T. Neuroimage. 2009;44:385–398. doi: 10.1016/j.neuroimage.2008.08.04. [DOI] [PMC free article] [PubMed] [Google Scholar]
- Yushkevich PA, Wang H, Pluta J, Das SR, Craige C, Avants BB, Weiner MW, Mueller S. Nearly automatic segmentation of hippocampal subfields in in vivo focal T2-weighted MRI. Neuroimage. 2010;53:1208–1224. doi: 10.1016/j.neuroimage.2010.06.040. [DOI] [PMC free article] [PubMed] [Google Scholar]
- Zeineh MM, Holdsworth S, Skare S, Atlas SW, Bammer R. Ultra-high resolution diffusion tensor imaging of the microscopic pathways of the medial temporal lobe. Neuroimage. 2012;62:2065–2082. doi: 10.1016/j.neuroimage.2012.05.065. [DOI] [PMC free article] [PubMed] [Google Scholar]
- Zeineh MM, Parekh MB, Zaharchuk G, Su JH, Rosenberg J, Fischbein NJ, Rutt BK. Ultrahigh-resolution imaging of the human brain with phase-cycled balanced steady-state free precession at 7 T. Invest Radiol. 2014;49:278–289. doi: 10.1097/RLI.0000000000000015. [DOI] [PMC free article] [PubMed] [Google Scholar]