

Abstract
An isotropic detector-based system was compared with a flat photodiode-based system in patients undergoing pleural photodynamic therapy. Isotropic and flat detectors were placed side by side in the chest cavity, for simultaneous in vivo dosimetry at surface locations for twelve patients. The treatment used 630nm laser to a total light irradiance of 30 J/cm2 (measured with the flat photodiodes) with photofrin® IV as the photosensitizer. Since the flat detectors were calibrated at 532nm, wavelength correction factors (WCF) were used to convert the calibration to 630nm (WCF between 0.542 and 0.703). The mean ratio between isotropic and flat detectors for all sites was linear to the accumulated fluence and was 3.4±0.6 or 2.1±0.4, with or without the wavelength correction for the flat detectors, respectively. The μeff of the tissues was estimated to vary between 0.5 to 4.3 cm−1 for four sites (Apex, Posterior Sulcus, Anterior Chest Wall, and Posterior Mediastinum) assuming μs′ = 7 cm−1. Insufficient information was available to estimate μeff directly for three other sites (Anterior Sulcus, Posterior Chest Wall, and Pericardium) primarily due to limited sample size, although one may assume the optical penetration in all sites to vary in the same range (0.5 to 4.3 cm−1).
Keywords: ratio of spherical-to-flat detectors, effective attenuation coefficient, diffuse reflectance, pleural PDT
INTRODUCTION
Malignant pleural effusions are common clinically and for which there are no widely accepted curative approaches. The prognosis of most patients with malignant pleural effusions is poor. Two-thirds of the patients die within 3 months from a malignant pleural effusion and 80% die within 6 months 1. The treatment of a malignant pleural effusion usually begins with a thoracentesis which provides temporary relief of symptons. Often the malignant effusion recurs quickly 2. These poor results have led to the investigation of adjuvant photodynamic therapy (PDT) after surgical management 3–6.
Photodynamic therapy (PDT) is a cancer treatment that involves the use of a photosensitizer, oxygen, and light of a wavelength specific to the absorption characteristics of the photosensitizer 7. The use of PDT in oncology has several potential advantages compared to standard therapies. First, preclinical studies demonstrate greater retention of some photosensitizers in tumor compared to some normal tissues, potentially providing an improved therapeutic gain 8. Second, PDT is a superficial treatment and therefore, may be ideal for surface malignancies such as pleural or intraperitoneal carcinomatosis 9. Third, PDT is a local treatment that can be administered in the operating room at the time of surgery.
A phase II trial of Photofrin-mediated PDT using the 630 nm light (Pleural PDT) is on-going at University of Pennsylvania for patients with cancers metastatic to the pleural including malignant pleural effusions. Photofrin® is a purified mixture of porphyrin monomers and oligomers manufactured by QLT, Ltd. Vancouver, Canada 10. The current protocol was based on the dose-limiting toxicities determined by a phase I study 3 using a flat photodiode-based dosimetry system, with the photodiodes calibrated at wavelength 514 nm. It has been demonstrated that an isotropic detector 11 is more suitable for in vivo light dosimetry since it measures the total light fluence from not only the incident light irradiance but also back-scattered light from tissue, which can be as much as 2 times the incident light 12,13.
The primary objective of this study was to determine the conversion factor from the flat photodiode-based dosimetry system to an isotropic detector-based dosimetry system for our on-going phase II protocol. A secondary objective was to use the wavelength corrected conversion factors at various sites to determine the effective attenuation coefficient (μeff) of tissues at these sites. The μeff can be used to determine the tissue optical penetration depth (δ = 1/μeff). We performed a similar study in patients enrolled on a Phase II study of intraperitoneal photodynamic therapy 13. The difference between the current and previous studies (other than different treatment sites and the tissue types) is the use of a wavelength correction for each individual flat photodiode, which improves the accuracy of predicting μeff.
METHODS AND MATERIALS
Pleural PDT
Patients with pleural malignancies were entered on a stratified Phase II trial of pleural PDT. This protocol is based on a phase I study in patients with isolated hemithoracic pleural malignancies performed at the National Cancer Institute 3. The maximally tolerated dose (MTD) of PDT was found to be 2 mg/kg of Photofrin® administered 24 hours prior to 630 nm light at a dose of 30 J/cm2. The clinical trial and the comparison of two different dosimetry system were approved by the Institutional Review Board at the University of Pennsylvania. All patients signed an informed consent document prior to study entry.
An intercomparison of the two dosimetry systems was performed on twelve patients. Patients with malignant spread of cancer received photofrin® 2.0 mg/kg intravenously, 24 hours prior to planned thoracoscopy or thoracotomy. During the surgery, bulky pleural disease was removed to reduce the remaining disease to less than 5 mm in thickness. Seven sterile, flat photodiodes were sewn to the wall of the pleural cavity for monitoring of light dose in the following sites: Apex, anterior medial segment (also called Anterior Chest Wall, ACW), posterior lateral segment (also called Posterior Mediastinum, PM), direct posterior segment (also called Posterior Chest Wall, PCW), posterior diaphgramatic gutter (also called Posterior Sulcus, PS), anterior diaphragmatic gutter (also called Anterior Sulcus, AS), and Pericardium (PERI). For the purposes of comparing the light fluence measurements, isotropic detectors (Cardio Focus, Inc, West Yarmouth, MA) were sewn next to the flat photodiodes in four sites. The distance between each flat detector and its corresponding isotropic detector was no more than 1 cm along the tissue surface. The isotropic detectors were placed in sterile polyethylene intravenous tubing filled with saline to match the refractive index of the surrounding mediuam as described by Bass et al 6. A delute intralipid solution (0.01%) was placed in the pleural cavity as a light scattering agent. Red light, 630 nm, was delivered to the pleural surface with an optical fiber sheathed with a modified endotracheal tube. The balloon cuff was inflated and filled with a dilute intralipid solution (0.1%). Such a light delivery system was used to provide light diffusion and to protect the pleural surface from the otherwise sharp tip of the optical fiber. A total time integrated irradiance of 30 J/cm2 was delivered to the entire pleural surface as measured by the flat photodiodes.
Laser System
The laser system used for pleural PDT was a Nd:Yag KTP laser (Laser Scope, Model 820) operating at 30 W power at 532 nm, and a dye laser module (Laser Scope, 600 Series) operating at 7 W power at 630 nm. The output of the laser was verified by a Coherent power meter with calibration traceable to the National Institute of Technology and Standards.
Flat photodiode-based dosimetry system
The flat photodiode dosimetry system was borrowed from the Radiation Oncology Branch at the National Cancer Institute (NCI), Bethesda, MD and has been previously described 14. It consists of a set of eight photodiodes connected to an analog-to-digital converter, which is interfaced to a personal computer (PC). The system measures light irradiance (E, in mW/cm2) and total time integrated irradiance (in J/cm2) (also called radiant exposure 12). For a collimated light incident on the flat photodiode from different angles (θ) from the axis of the flat surface (Fig. 1), the response of the photodiode varies as cosθ.
Fig. 1.

Angular dependence for a typical isotropic detector from Cardio Focus (solid line) and a flat photodiode (dashed line). The dotted line is cosθ.
The flat photodiodes used in the original phase I study 3 were calibrated with collimated green light at 514 nm. To maintain the continuity of the treatment protocols, the photodiodes in the present clincal trial were also calibrated with collimated green light, but with a different wavelength 532 nm. The difference in calibration due to the smaller sensitivity at 514 nm vs. 532 nm is less than 5% 13. Due to the wavelength dependence, the sensitivity (photovoltage per unit irradiance) of the silicon photodiodes is 42% to 84% larger at 630 nm than at 532nm, depending on which individual photodiode was used. A wavelength correction factor, defined as the ratio between the true irradiance and the photodiode reading was determined for each photodiode at wavelength 630 nm. This wavelength correction factor (Table 1) was measured as the mean value for different irradiance levels within the linear response region of the photodiode. The standard deviation of the mean values of WCF was less than 5% for each photodiode.
Table 1.
Wavelength Correction factors, defined as the ratio of detector sensitivity between 630 nm and 532 nm, for flat detectors. Highlighted values are not used in the final analysis (due to displacement of the detectors during intercomparison or larger than 40% of calibration error for isotropic detectors).
| Pat ID\Sites | APEX | PS | AS | ACW | PCW | Peri | PM |
|---|---|---|---|---|---|---|---|
| Pat 1 | 0.620 | 0.631 | |||||
| Pat 2 | 0.703 | 0.651 | 0.620 | 0.663 | |||
| Pat 3 | 0.636 | 0.642 | 0.620 | 0.663 | |||
| Pat 4 | 0.572 | 0.594 | 0.585 | 0.553 | |||
| Pat 5 | 0.622 | 0.597 | 0.634 | 0.658 | |||
| Pat 6 | 0.585 | 0.594 | 0.553 | 0.609 | |||
| Pat 7 | 0.585 | 0.542 | 0.609 | 0.572 | |||
| Pat 8 | 0.622 | 0.634 | 0.658 | 0.597 | |||
| Pat 9 | 0.642 | 0.634 | 0.658 | 0.625 | |||
| Pat 10 | 0.622 | 0.625 | 0.658 | 0.642 | |||
| Pat 11 | 0.597 | 0.625 | 0.658 | 0.622 | |||
| Pat 12 | 0.658 | 0.622 | 0.625 | 0.634 |
Spherical (Isotropic) detector-based dosimetry system
The spherical detector-based dosimetry system was built in the laboratory of Dr. Willem Star (Rotterdam, The Netherlands) and is similar to the apparatus described by Bass et al 6. The system consists of four channels connected to four isotropic detectors via SMA connecters. Each channel consists of a photodiode, a preamplifiers, and an 8-bit A/D converter. The software was provided with the dosimetry system to record light fluence rate at one second intevals. An ideal isotropic detector has the same response to collimated (parallel) light incident from any direction and measures light fluence rate (in mW/cm2) 12. The isotropic detectors manufactured by Cardio Focus, Inc. (west Yarmouth, MA) have anisotropy of less than ±10% (Fig. 1) and measure the fluence rate accurately. Some of the isotropic detectors used were made by us due to a shortage of supply when the original isotropic detectors were broken. The homemade isotropic detectors were made of a 0.3-mm diameter spherical bulb made of scattering material (TiO2) and have anisotropy of less than 60%. This increased angular dependence introduced less than 5% deviation for light fluence rate measurement on a tissue surface, compared to the original isotropic detectors from Cardio Focus, Inc. according to our intercomparison measurements (data not shown).
The isotropic detectors were calibrated in an integrating sphere calibration module provided by the laboratory of Dr. Willem Star. The integrating sphere has a 630 nm light source, producing 3.14 mW/cm2 inside the integrating sphere. At such a low light fluence rate level, the detector reading fluctuates by 30%, due to the limitation of the 8-bit A/D converter (quantum noise). To minimize this error, we measured a detector calibration correction factor (CCF) for each isotropic detector (Table 2). The detector calibration correction factor is defined as the ratio of the true-to-measured fluence rate (at 3.14 mW/cm2) with the measured fluence rate averaged over 20 seconds to eliminate the quantum noise. If the isotropic detector is malfunctioning, its calibration correction factor deviates greatly from 1. This only happened in one case (CCF = 4.43 in Table 2) and it was excluded from the final data analysis.
Table 2.
Calibration Correction Factors (CCF), defined as the ratio of true-to-measured calibration factor, for isotropic detectors. Highlighted values are not used in the final analysis (due to displacement of the detectors during intercomparison or larger than 40% of calibration error for isotropic detectors).
| Pat ID\Sites | APEX | PS | AS | ACW | PCW | Peri | PM |
|---|---|---|---|---|---|---|---|
| Pat 1 | 0.985 | 1.071 | |||||
| Pat 2 | 0.712 | 0.976 | 1.059 | 0.836 | |||
| Pat 3 | 0.923 | 1.358 | 1.039 | 1.107 | |||
| Pat 4 | 0.982 | 1.041 | 0.698 | 1.150 | |||
| Pat 5 | 1.003 | 0.739 | 0.747 | 1.008 | |||
| Pat 6 | 1.046 | 0.917 | 0.726 | 0.927 | |||
| Pat 7 | 0.777 | 1.197 | 1.028 | 1.042 | |||
| Pat 8 | 0.750 | 0.837 | 1.096 | 0.948 | |||
| Pat 9 | 1.284 | 0.834 | 1.197 | 1.169 | |||
| Pat 10 | 0.968 | 0.843 | 0.660 | 1.320 | |||
| Pat 11 | 1.240 | 1.334 | 1.320 | 4.430 | |||
| Pat 12 | 1.115 | 0.982 | 0.915 | 1.069 |
Theory of the Ratio of isotropic-to-flat detectors
The ratio of spherical-to-flat detector readings (k), located on the surface of a semi-infinite tissue medium and illuminated from above with a homogeneous parallel light source, can be calculated as a function of the diffuse reflectance Rd, i.e., 13
| (1) |
Here we assumed that the tissue surface is a Lambertian surface for angles less than 30°, as proven by Martelli et al 15. Under this assumption, the radiant intensity emerging from the tissue surface follows cosθ for an azimeth angle θ around the axis of the surface16. Equation (1) states that for a unit light irradiance incident on the semi-infinite plane, the incident and backscattered light contributes 1 and 2Rd photon energies per unit area, respectively, to the isotropic detector according to the theory described by Marijnissen and Star 16.
Rd can be calculated if one knows the reflectance r(ρ) for a pencil beam, i.e.
| (2) |
where ρ is the lateral radius. The diffuse reflectivity r(ρ) and Rd for a pencil-beam have been calculated by Farrell et al 17 using the diffusion approximation and verified by Monte-Carlo simulation. They found that the results obtained with a diffusion theory calculation using a single scattering source at depth of 1/(μa′ + μa) in tissue agreed with the Monte Carlo method better than the result for an extended source 17. The result for a single scattering source can be expressed as
| (3) |
where a′ = μ′s/(μa + μ′s) is the ratio of transport scattering coefficient to the sum of absorption and transport scattering coefficients (also called transport albedo17). A is the internal reflection parameter, which is a function of the ratio of the index of reflection of the two media, nrel = nt/nv. A = 3.25 and 1.25 for air-tissue interface 17 and water-tissue interface (nt= 1.4, nv=1.33), respectively. Equation (3) shows that the theoretical ratio is a function of transport albedo a′ only. Equation (1) shows that the maximum ratio for a semi-infinite medium is 3 since Rd < 1.
When the pleural cavity is small enough, the assumption used for Eq. (1) becomes invalid, i.e. the tissue surface is too curved to be considered as a semi-infinite plane. In the extreme case when the pleural cavity behaves like a integrating sphere so that the light is completely isotropically diffused, the light fluence rate is four times the light irradiance 16, i.e. the ratio of isotropic-to-flat detector readings becomes 4, independent of the tissue optical properties.
RESULTS
The calculated and measured ratios of isotropic to flat detector readings (k) on a semi-infinite medium as a function of μeff are shown in Fig. 2. The data points are for μ′s = 7 and 15 cm−1 and continuously varying μa. Both flat and isotropic detectors were calibrated at 630 nm. To maintain the same conditions as the in vivo measurements, the isotropic detector was placed inside a tube filled with saline. As a result, the theoretical curve (solid lines) in Fig. 2 was calculated using A = 1.25. The data demonstrate that the maximum value of k cannot exceed 3 and the theory agrees with the phantom measurements. Notice that the k value depends on both μa and μs′, rather than μeff alone. For simplicity, we will assume μs′ = 7 cm−1 in tissue to estimate μεff from tissue measurements.
Fig. 2.

Ratio of isotropic-to-flat detector readings on a semi-infinite medium as a function of effective attenuation coefficient μeff in a liquid optical phantom. Absorption (μa) and reduced scattering (μ′s) coefficients were known. Symbols were measured data: circles, μ′s = 15 cm−1; plus, μ′s = 7 cm−1. Solid lines were theory (Eqs. (1) and (3)). Both isotropic and flat detectors were calibrated at 630 nm.
The in vivo comparison data taken with both light dosimetry systems in pleural PDT patients are displayed in Figures 3 (a)–(g). The fluences measured with the isotropic detector are plotted against the time integrated irradiance, measured with the flat photodiode for each patient at various treatment sites, including APEX, PS (posterior sulcus), PCW (posterior chest wall), AS (anterior sulcus), ACW (anterior chest wall), PERI (Pericardium), and PM (posterior mediastinum). The left and right plots show the data without and with wavelength correction for the flat photodiodes, respectively. The data for all patients are summarized in Table 3. In addition to calculating conversion factors for each patient, the data are analyzed according to treatment sites and with and without wavelength correction (Table 1) for each individual flat photodiode. The isotropic detector readings were corrected for with the detector calibration correction factors (Table 2). Those measurements (highlighted in Tables 1 and 2) that had large detector calibration correction factors for the isotropic detectors or had known displacement of the detectors in situ were excluded from the final data analysis (Table 3).
Fig. 3.
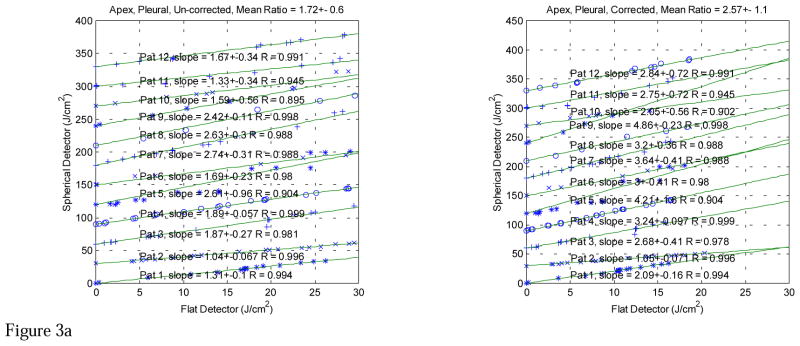


Figure 3a. In vivo comparisons between light fluence measured with spherical and flat detectors at Apex of pleural cavity (Apex) for λ 630-nm laser. The lines are a linear fit with y = k·x, R is the correlation coefficient. Each subsequent fit was shifted up by 30 J/cm2 for clarity. Notice that the flat detector was calibrated at 532 nm. The left and right plots are the comparisons before and after the flat detector calibration has been corrected to 630 nm, respectively.
Figure 3b. Comparison between light fluence measured with spherical and flat detectors at Posterior Sulcus (PS) for λ 630 nm laser. The lines are a linear fit with y = k·x, R is the correlation coefficient. Notice that the flat detector was calibrated at 532 nm. The left and right plots are the comparisons before and after the flat detector calibration has been corrected to 630 nm, respectively.
Figure 3c. Comparison between light fluence measured with spherical and flat detectors at Posterior Chest Wall (PCW) for λ 630-nm laser. The lines are a linear fit with y = k·x, R is the correlation coefficient. Notice that the flat detector was calibrated at 532 nm. The left and right plots are the comparisons before and after the flat detector calibration has been corrected to 630 nm, respectively.
Figure 3d. Comparison between light fluence measured with spherical and flat detectors at Anterior Sulcus (AS) for λ 630-nm laser. The lines are a linear fit with y = k·x, R is the correlation coefficient. Notice that the flat detector was calibrated at 532 nm. The left and right plots are the comparisons before and after the flat detector calibration has been corrected to 630 nm, respectively.
Figure 3e. Comparison between light fluence measured with spherical and flat detectors at Anterior Chest Wall (ACW) for λ 630-nm laser. The lines are a linear fit with y = k·x, R is the correlation coefficient. Notice that the flat detector was calibrated at 532 nm. The left and right plots are the comparisons before and after the flat detector calibration has been corrected to 630 nm, respectively.
Figure 3f. Comparison between light fluence measured with spherical and flat detectors at Pericardium (Peri) for λ 630-nm laser. The lines are a linear fit with y = k·x, R is the correlation coefficient. Notice that the flat detector was calibrated at 532 nm. The left and right plots are the comparisons before and after the flat detector calibration has been corrected to 630 nm, respectively.
Figure 3g. Comparison between light fluence measured with spherical and flat detectors at Posterior Mediastinum (PM) for λ 630-nm laser. The lines are a linear fit with y = k·x, R is the correlation coefficient. Notice that the flat detector was calibrated at 532 nm. The left and right plots are the comparisons before and after the flat detector calibration has been corrected to 630 nm, respectively.
Table 3.
Summary of light fluence Ratio, k, between isotropic and flat detectors for differet sites at 630 nm. Notice that the flat detectors are calibrated at 532 nm while the isotropic detectors are calibrated at 630 nm. The results for “Before wavelenth correction” and “After wavelength correction” are the ratios before and after the calibration of the flat photodiodes have been corrected from 532 nm to 630 nm, respectively.
| After wavelength correction | Before wavelength correction | ||||||
|---|---|---|---|---|---|---|---|
| APEX | k | δk | R2 | k | δk | R2 | |
| Pat 1 | 2.09 | 0.16 | 0.99 | 1.31 | 0.10 | 0.99 | |
| Pat 2 | 1.05 | 0.07 | 1.00 | 1.04 | 0.07 | 1.00 | |
| Pat 3 | 2.68 | 0.41 | 0.98 | 1.87 | 0.27 | 0.98 | |
| Pat 4 | 3.24 | 0.10 | 1.00 | 1.89 | 0.06 | 1.00 | |
| Pat 5 | 4.21 | 1.55 | 0.90 | 2.61 | 0.96 | 0.90 | |
| Pat 6 | 3.00 | 0.41 | 0.98 | 1.69 | 0.23 | 0.98 | |
| Pat 7 | 3.64 | 0.41 | 0.99 | 2.74 | 0.31 | 0.99 | |
| Pat 8 | 3.20 | 0.36 | 0.99 | 2.63 | 0.30 | 0.99 | |
| Pat 9 | 4.86 | 0.23 | 1.00 | 2.42 | 0.11 | 1.00 | |
| Pat 10* | 2.05 | 0.56 | 0.90 | 1.59 | 0.56 | 0.89 | |
| Pat 11 | 2.75 | 0.72 | 0.95 | 1.33 | 0.34 | 0.95 | |
| Pat 12 | 2.84 | 0.28 | 0.99 | 1.67 | 0.16 | 0.99 | |
| All data for APEX | 2.97 | 1.01 | 1.90 | 0.57 | |||
| Data (R2 > 0.95) | 2.57 | 1.06 | 1.72 | 0.60 | |||
| PS | |||||||
| Pat 1 | 2.24 | 0.16 | 1.00 | 1.32 | 0.09 | 1.00 | |
| Pat 2 | 1.55 | 0.32 | 0.95 | 1.03 | 0.21 | 0.95 | |
| Pat 4 | 4.14 | 0.55 | 0.98 | 2.36 | 0.31 | 0.98 | |
| Pat 5* | 2.02 | 0.55 | 0.92 | 1.62 | 0.44 | 0.92 | |
| Pat 7 | 3.51 | 0.48 | 0.98 | 1.58 | 0.21 | 0.99 | |
| Pat 8* | 4.34 | 1.47 | 0.85 | 3.25 | 1.10 | 0.85 | |
| Pat 11 | 4.55 | 0.43 | 0.99 | 2.11 | 0.20 | 0.99 | |
| All data for PS | 3.19 | 1.23 | 1.90 | 0.75 | |||
| Data (R2 > 0.95) | 2.74 | 1.52 | 1.57 | 0.65 | |||
| PCW | |||||||
| Pat 3* | 2.82 | 0.73 | 0.92 | 1.68 | 0.44 | 0.92 | |
| Pat 8 | 4.40 | 0.56 | 0.98 | 2.63 | 0.33 | 0.98 | |
| Pat 9 | 3.78 | 0.30 | 0.99 | 2.07 | 0.16 | 0.99 | |
| All data for PCW | 3.67 | 0.80 | 2.13 | 0.48 | |||
| Data (R2 > 0.95) | 4.00 | 0.46 | 2.25 | 0.42 | |||
| AS | |||||||
| Pat 5 | 4.40 | 0.63 | 0.98 | 3.72 | 0.53 | 0.98 | |
| Pat 9 | 4.04 | 0.06 | 1.00 | 3.06 | 0.05 | 1.00 | |
| Pat 10 | 3.49 | 0.54 | 0.98 | 2.41 | 0.47 | 0.96 | |
| Pat 12 | 3.81 | 0.73 | 0.95 | 2.42 | 0.46 | 0.95 | |
| All data for AS | 3.93 | 0.39 | 2.90 | 0.63 | |||
| Data (R2 > 0.95) | 4.00 | 0.40 | 3.00 | 0.64 | |||
| ACW | |||||||
| Pat 5 | 3.33 | 0.29 | 0.99 | 2.16 | 0.19 | 0.99 | |
| Pat 7* | 2.03 | 0.81 | 0.89 | 1.82 | 0.57 | 0.92 | |
| Pat 10 | 1.72 | 0.30 | 0.96 | 1.72 | 0.30 | 0.96 | |
| Pat 12 | 3.19 | 0.49 | 0.97 | 2.17 | 0.34 | 0.97 | |
| All data for ACW | 2.57 | 0.81 | 1.97 | 0.23 | |||
| Data (R2 > 0.95) | 2.60 | 0.81 | 2.01 | 0.24 | |||
| PERI | |||||||
| Pat 2 | 2.89 | 0.47 | 0.97 | 1.69 | 0.28 | 0.97 | |
| Pat 4 | 3.87 | 0.35 | 0.99 | 3.24 | 0.29 | 0.99 | |
| Pat 6 | 2.51 | 0.26 | 0.99 | 1.92 | 0.20 | 0.99 | |
| Pat 7* | 3.49 | 0.88 | 0.91 | 1.92 | 0.48 | 0.91 | |
| Pat 9 | 5.24 | 0.39 | 0.99 | 2.78 | 0.21 | 0.99 | |
| Pat 11 | 3.94 | 0.52 | 0.98 | 1.96 | 0.26 | 0.98 | |
| All data for PERI | 3.65 | 0.96 | 2.25 | 0.61 | |||
| Data (R2 > 0.95) | 3.60 | 1.07 | 2.31 | 0.66 | |||
| PM | |||||||
| Pat 3 | 3.48 | 0.49 | 0.98 | 2.15 | 0.33 | 0.98 | |
| Pat 4 | 3.71 | 0.26 | 1.00 | 1.78 | 0.12 | 1.00 | |
| Pat 6 | 1.84 | 0.09 | 1.00 | 1.22 | 0.06 | 1.00 | |
| Pat 8* | 3.88 | 1.01 | 0.91 | 2.45 | 0.64 | 0.91 | |
| Pat 10 | 4.36 | 0.56 | 0.99 | 2.13 | 0.27 | 0.99 | |
| Pat 12 | 3.48 | 0.57 | 0.98 | 2.07 | 0.34 | 0.98 | |
| All data for PM | 3.46 | 0.86 | 1.96 | 0.42 | |||
| Data (R2 > 0.95) | 2.73 | 1.18 | 1.54 | 0.54 | |||
| All sites (R2 > 0.95) | 3.39 | 0.55 | 2.14 | 0.41 | |||
DISCUSSION
The data points in figure 2 were fitted to a straight line y = k·x, according to a least square fit. The slope of this line, k, represents the conversion factor for the two dosimetry systems for each individual patient at the site. The standard error δk for the slope was determined by calculating the mean square difference between measured and predicted data. The coefficient of correlation R2 varies between 0 and 1 and provides an assessment of how well the data fit a linear model18. These results were included in Table 3. In some cases, a lower correlation between intermediary and the final data points were detected (R2 < 0.95). These data are indicated by an asterisk after the patient number in Table 3.
The mean conversion factor for each site was obtained by using the error weighted average of each measurement for the same site. Two mean values were obtained in Table 3 for each site: one used all data, and the other used only the data with R2 > 0.95. The data with R2 < 0.95 did not fit the straight line well and could have been caused by a light source not uniformly illuminating the tissue surface during the intercomparison of the two dosimetry systems. Those data were excluded from the valid data used to estimate μeff.
The mean conversion factors for R2 > 0.95 and with wavelength correction were similar for four sites (APEX, PS, ACW, and PM): 2.6±1.1, 2.7±1.5, 2.6±0.8, 2.7±1.2, indicating that the optical properties in these sites are similar. Since these sites were the same type of tissue, we decided to predict their μeff using the mean of the conversion factors (R2 > 0.95) for all four sites: 2.65 ± 0.9 or k varied between 1.75 to 3.55. From Fig. 2 for μs′ = 7 cm−1 and k = 2.65 we predicted the mean value of μeff was 2.05 cm−1, corresponding to an optical penetration depth of δ =1/μeff = 0.50 cm. Similarly we predicted that μeff varied between 0.5 to 4.3 cm−1. As μeff decreases with increasing k in Fig. 2, the upper limit of μeff (4.3 cm−1) was determined from the low limit of k (1.75). The upper limit of k value (3.55) exceeded the maximum value of k (3) for a semi-infinite medium and cannot be used to predict the lower limit of μeff. Instead, the lower limit of μeff (0.5 cm−1) was determined from the smallest μeff for phantom measurements (+) in Fig. 2, when pure intralipid was used. Still μeff equals 0.5 cm−1 because of the residual attenuation of water and the large μs′ in tissue (7 cm−1).
The mean conversion factors (R2 > 0.95) with wavelength correction for the other three sites (AS, PCW, and PERI) were approximately 4: 4.0 ± 0.4, 4.0 ± 0.5, 3.6 ± 1.1. This indicated that the geometry of the tissue surface for these measurements had to be very curved. When the whole pleural cavity formed a completely diffused light field, the value of k becomes 4 independent of μeff, as discussed previously in Methods and Materials. Since two of the sites (AS and PCW) had similar tissue type and geometrical location as the other sites where we were able to predict μeff. We assumed that μeff varied in the same range (0.5 to 4.3 cm−1) for these sites (AS and PCW). We concluded that the reason higher conversion factors were measured in these sites was due to the limited sample size and most of them happened to be for curved surface.
Pericardium has a different tissue type from the other four sites (APEX, PS, ACW, and PM) and thus cannot be assumed to have the same range of μeff. If one excluded all conversion factors (with wavelength correction) that were larger than 3 for PERI in Table 3, the mean conversion factor was 2.64 ± 0.28. Using Fig. 2 and a similar method described above, the mean μeff for PERI was 2.0 cm−1, almost the same as other sites. The range of μeff for PERI (1.9 to 2.1 cm−1) was smaller than that of other sites but this range could be an underestimation since only two sample points were used. We postulate the range of μeff at the pericardium were the same as all other sites, since the mean μeff was the same.
Some of the individual conversion factors in Table 3 were larger than 4. This is theoretically impossible under uniform light illumination according to our previous discussion. One possible explanation was that the light source was illuminating the semi-infinite tissue surface at an angle θ relative to the axis of the flat detector. Under this condition, the flat detector will have a response of E·cosθ (see Fig. 1), rather than measuring the irradiance E. As a result, the ratio was increased from the theoretical prediction [Eq. (1)] by a factor 1/cosθ. For the maximum measured conversion factor of 5.24 (Pat9 at PERI, Table 3), the angle θ was calculated as 60°, assuming the conversion factor for perpendicular light incidence was 2.65. This occurrence should not happen often since the point source was constantly moving during PDT treatment. It could happen when the flat detector was somehow flipped toward one side of the tissue surface and thus introduced an angle θ during the intercomparison.
Variability in tissue optical properties and the surface geometry are likely the major reason for the differences observed between the two dosimetry systems as discussed above. Several other factors may also account for the difference between the spherical and flat detector readings. Among these other factors 13: (1) angular dependence of flat and isotropic detectors and the pattern of light source movement; (2) nonlinearity of the photodiodes (the flat detectors begin to saturate at high irradiance (~ 130 – 200 mW/cm2); and (3) detection errors in the isotropic detector reading due to accidental air bubbles in the intravenous tubing. As discussed above, factor (1) may cause the conversion factor to be larger than 4 if the flat detector was not placed correctly. Factor (2) can be reduced by only including data with R2 >0.95 since the nonlinearity will cause the experimental data in Fig. 3 to deviate from straight line. Factor (3) can be reduced or eliminated by applying the detector calibration correction factors.
When the ratios for all patient were analyzed, the mean conversion factor (standard deviation) for (R2 >0.95) was 3.39 (0.55) with and 2.14 (0.41) without wavelength correction, respectively. The mean conversion factor (2.1±0.4) without wavelength correction should be the conversion factor that is used to convert in vivo light fluence from the flat photodiode-based dosimetry system to the isotropic detector based dosimetry system for the pleural PDT. This is because the current light dose for Phase II protocol is based on flat photodiodes calibrated at 532 nm. This conversion factor (2.1) is slightly larger than the conversion factor established for IP PDT (1.7±0.1) 13, probably because of the existence of more curved surfaces in pleural PDT than in IP PDT. The mean conversion factor for pleural PDT also had a larger standard deviation than that of IP PDT because of the wider range of surface geometries (from flat to curved) for pleural PDT than that for IP PDT.
Pleural PDT is an experimental treatment approach being evaluated for the treatment of patient with pleural malignancies that are incurable with present treatment techniques. The tissue geometry in the chest cavity is complex and patient dependent, which makes custom light delivery difficult. Furthermore, the light dose used in this trial represents the maximally tolerated dose, which means it is close to the dose that could lead to substantial toxicity. Based on the theoretical considerations presented earlier, considerable heterogeneity of tissue optical properties exists in the chest cavity. We postulate that the isotropic detector-based dosimetry system would permit a more accurate assessment of light fluence delivered to the superficial tissues.
Replacing the flat photodiode-based dosimetry system with the isotropic detector-based dosimetry system for future protocols has several clinical advantages. First of all, the isotropic detector measures fluence rate directly at the tissue surface, regardless of tissue optical properties and surface geometries. Thus it provides a more accurate representation of the photons available for treatment. Second, error introduced in the light fluence measurement due to the flat photodiode’s wavelength dependence (because they were calibrated at 532 nm) can be eliminated. This error varied among each individual photodiodes by 40% since the wavelength correction factors varied between 42% and 84% (Table 1). Third, isotropic detectors are smaller and thus easier to place on tissue surface than the flat photodiodes. Fourth, since the isotropic detector has a much small angular dependence than a flat photodiode (Fig. 1), potential large errors caused by the angular dependence of the flat detector can be eliminated.
CONCLUSION
The flat photodiode-based dosimetry system has been useful for maintaining the continuity of treatment protocols for pleural PDT. However, our data suggest that the flat photodiodes underestimate the actual light fluence at the tissue surface in vivo. The spherical detector-based dosimetry system provides a more accurate measure of surface light fluence and therefore should be used for future treatment protocol. The mean ratio between the isotropic and flat detectors for all sites for pleural PDT was 3.4±0.6 or 2.1±0.4, with or without the wavelength correction for the flat detectors, respectively. We propose using the ratio between isotropic to flat detector readings without the wavelength correction for the flat photodiodes as the conversion factor for converting light doses from the flat photodiode-based dosimetry system to a spherical detector-based dosimetry system since the current protocol is based on photodiodes calibrated at 532 nm.
The μeff of the tissues was estimated to vary between 0.5 to 4.3 cm−1 for four sites (Apex, Posterior Sulcus, Anterior Chest Wall, and Posterior Mediastinum) assuming μs′ = 7 cm−1. The mean μeff was 2.0 cm−1, corresponding to an optical penetration depth of 0.5 cm. Insufficient information was available to estimate μeff directly for three other sites (Anterior Sulcus, Posterior Chest Wall, and Pericardium), although one may assume the optical penetration in all sites to be in the same range (i.e. 0.5 to 4.3 cm−1).
References
- 1.Chernow B, Sahn SA. Carcinomatosis involvement of the pleura. Am Med. 1977;37:291. doi: 10.1016/0002-9343(77)90154-1. [DOI] [PubMed] [Google Scholar]
- 2.Anderson CB, Philpott GW, Ferguson TB. The treatment of malignant pleural effusions. Cancer. 1974;33:916. doi: 10.1002/1097-0142(197404)33:4<916::aid-cncr2820330405>3.0.co;2-u. [DOI] [PubMed] [Google Scholar]
- 3.Pass HI, Delaney TF, Tochner Z, et al. Intrapleural photodynamic therapy: results of a phase I trial. Ann Surg Onc. 1994;1:28–37. doi: 10.1007/BF02303538. [DOI] [PubMed] [Google Scholar]
- 4.Takita H, Dougherty TJ. Intracavitary photodynamic therapy for malignant pleural mesothelioma. Semin Surg Onc. 1995;11:368–371. doi: 10.1002/ssu.2980110507. [DOI] [PubMed] [Google Scholar]
- 5.Takita HT, Mang TS, Loewen GM, et al. Operation and intracavitary photodynamic therapy for malignant pleural mesothelioma: A phase II study. Ann Thorac Surg. 1994;58:995–998. doi: 10.1016/0003-4975(94)90443-x. [DOI] [PubMed] [Google Scholar]
- 6.Bass P, Murrer L, Zoetmulder FA, Stewart FA, Ris HB, van Zandwijk N, Peterse JL, Rutgers EJ. Photodynamic therapy as adjuvant therapy in surgically treated pleural malignancies. Br J Cancer. 1997;76:819–826. doi: 10.1038/bjc.1997.468. [DOI] [PMC free article] [PubMed] [Google Scholar]
- 7.Dougherty TJ, Gomer CJ, Henderson BW, Jori G, Kessel D, Korbelik M, Moan J, Peng Q. Photodynamic therapy. Journal of the National Cancer Institute. 1998;90:889–905. doi: 10.1093/jnci/90.12.889. [Review] [DOI] [PMC free article] [PubMed] [Google Scholar]
- 8.Gomer C, Dougherty T. Determination of [3H]- and [14C] hematoporphyrin derivative distribution in malignant and normal tissue. Cancer Res. 1979;39:146–151. [PubMed] [Google Scholar]
- 9.Hahn S, Glatstein E. The emergence of photodynamic therapy as a major modality in cancer treatment. Rev Comtemp Pharmocother. 1999;10:69–74. [Google Scholar]
- 10.Oleinick NL, Evans HH. The photobiology of photodynamic therapy: cellular targets and mechanisms. Radiat Res. 1998;150:S146–56. [PubMed] [Google Scholar]
- 11.Van Staveren HJ, Marijnissen JPA, Aalders MCG, Star WM. Construction, quality assurance and calibration of spherical isotropic fibre optic light diffusers. Lasers Med Sci. 1995;10:137–147. [Google Scholar]
- 12.Star WM. Light dosimetry in vivo. Phys Med Biol. 1997;42:763–787. doi: 10.1088/0031-9155/42/5/003. [DOI] [PubMed] [Google Scholar]
- 13.Vulcan TG, Zhu TC, Rodriguez CE, His A, Fraker DL, Bass P, Murrer LHP, Star WM, Glatstein E, Yodh AG, Hahn SM. Comparison between Isotropic and Nonisotropic Dosimetry Systems During Intraperitoneal Photodynamic Therapy. Lasers Surg Med. 2000;26:292–301. doi: 10.1002/(sici)1096-9101(2000)26:3<292::aid-lsm7>3.0.co;2-t. [DOI] [PubMed] [Google Scholar]
- 14.Friauf WS, Smith PE, Russo A, Delaney TF, Pass HI, Cole JW, Gibson CC, Sindelar WF, Thomas G. Light monitoring in photodynamic therapy. In: Nagle HR, Tomkins WJ, editors. IEEE case studies in medical instrument design. IEEE; New York: 1992. pp. 127–138. [Google Scholar]
- 15.Martelli F, Sassaroli A, Zaccanti G, Yamada Y. Properties of the light emerging from a diffusive medium: angular dependence and flux at the external boundary. Phys Med Biol. 1999;44:1257–1275. doi: 10.1088/0031-9155/44/5/013. [DOI] [PubMed] [Google Scholar]
- 16.Marijnissen JPA, Star WM. Calibration of isotropic light dosimetry probes based on scattering bulbs in clear media. Phys Med Biol. 1996;41:1191–1208. doi: 10.1088/0031-9155/41/7/008. [DOI] [PubMed] [Google Scholar]
- 17.Farrell J, Patterson MS, Wilson B. A diffusion theory model of spatially resolved, steady-state diffuse reflectance for the noninvasive determination of tissue optical properties in vivo. Med Phys. 1992;19:879–883. doi: 10.1118/1.596777. [DOI] [PubMed] [Google Scholar]
- 18.Mendenhall W. Introduction to probability and statistics. 1. PWS Publishers; Boston, MA: 1983. p. 436. [Google Scholar]