Abstract
A 1650 μm thick columnar CsI(Tl) scintillator for upgrading iQID detectors, which is a high-resolution photon-counting gamma-ray and x-ray detector recently developed at the Center for Gamma-Ray Imaging (CGRI), has been studied in terms of sensitivity, spatial resolution and depth-of-interaction effects. To facilitate these studies, a new frame-parsing algorithm for processing raw event data is also proposed that has more degrees of freedom in data processing and can discriminate against a special kind of noise present in some low-cost intensifiers. The results show that in comparison with a 450 μm-thickness columnar CsI(Tl) scintillator, the 1650 μm thick CsI(Tl) scintillator provides more than twice the sensitivity at the expense of some spatial resolution degradation. The depth-of-interaction study also shows that event size and amplitude vary with scintillator thickness, which can assist in future detector simulations and 3D-interaction-position estimation.
Keywords: Columnar CsI(Tl), thick scintillator, iQID detector, sensitivity, resolution, depth of interaction, noise discrimination, frame parsing
1. INTRODUCTION
Recently, a new generation of CCD/CMOS-based photon-counting scintillation detectors known as iQID (intensified quantum imaging detector) has been developed for gamma-ray and charged-particle imaging. It currently utilizes primarily thin gadolinium oxysulfide (Gd2O2S) or columnar CsI(Tl) scintillators to absorb high-energy gamma-ray photons and emit low-energy light photons. Then by optically coupling the scintillator to a CCD/CMOS sensor via an optical gain stage, each gamma-ray interaction inside the scintillator can be imaged and recorded. This method was developed by Miller et al. in the Center for Gamma-Ray Imaging (CGRI) at the University of Arizona.1
As shown in figure 1, an iQID detector is composed of a columnar CsI(Tl) scintillator to absorb gamma-ray photons and produce low-energy visible light photons, an image intensifier to amplify the light signal from the scintillator, a CCD camera to record the amplified light signal, and a lens for imaging the output face of the image intensifier onto the CCD. iQID detectors have many advantages, such as ~100 μm ultra-high intrinsic spatial resolution, high-count-rate capability, low cost and great upgrade capability. They are attractive as gamma-ray cameras for single-photon-emission computed tomography (SPECT) systems for small animal imaging. The stationary FastSPECT III system comprises 20 iQID detectors arranged in three rings to simultaneously acquire projection data in 20 different angles.
Figure 1.
Configuration of iQID detector. A schematic diagram of scintillator is artificially added
Despite all of the advantages of the iQID detectors inherited by the FastSPECT III system, two main issues have arisen in the application phase of FastSPECT III. First, because a low-cost Photonis XX1332 image intensifier is used, there is a tendency for the generation of random thermal noise photons (hereafter referred to as “central spot noise”) that concentrates in the center of the output phosphor. If not discriminated against, these false events mix with real signal and make artifacts in 3D reconstructed images. Second, the currently-used columnar CsI scintillator has a thickness of only 450 μm and has a low efficiency for absorbing higher-energy gamma-ray photons, such as the 140 keV gamma-rays emitted by most commonly used clinical source, Tc99m. This has limited the total sensitivity of FastSPECT III system when we use higher energy source. For future clinical applications, a scintillator with higher efficiency for absorbing higher-energy gamma-ray photons is required.
In order to further upgrade the iQID detector and solve the above two problems of FastSPECT III system, a new frame parsing algorithm based is proposed in this paper that can help eliminate the central-spot noise based on its statistics. Also a 1.65 mm-thick columnar CsI(Tl) scintillator is tested and compared with the old 450 μm columnar CsI(Tl) scintillator in terms of sensitivity and spatial resolution. Finally a depth-of-interaction (DoI) study of the 1.65 mm thick scintillator is performed to show the relationship between output amplitude, lateral spread of events and gamma-ray interaction depth inside the scintillator.2, 3
2. PHOTON-COUNTING WITH iQID DETECTOR
2.1 Columnar CsI(Tl) Scintillator
Cesium Iodide scintillators have a high stopping power for gamma rays due to their high density of 4.5 g/cm3 and high effective atomic number of 54, which makes them popular in gamma-ray imaging applications. Its emission spectrum is in the visible range with the peak situated at about 550 nm. It’s also one of the highest-conversion-efficiency scintillators with a light output of 54 photons/keV. Thallium (Tl) is often doped into the CsI scintillator to activate luminescence. CsI can be grown in a micro-columnar form as shown in figure 2, called columnar CsI scintillator, and is then composed of needle-like columns of scintillator material that will channel scintillation light to the exit surface through total internal reflection, thus limiting the light spread and preserving spatial resolution.4, 5 The thickness of the scintillator affects the probability of stopping gamma-rays emitted by the radioisotopes, thus affecting the sensitivity of the detector and any system utilizing the detector. A 1.65 mm thick columnar CsI(Tl) scintillator, also shown in figure 2, is tested and compared with a 450 μm columnar CsI(Tl) scintillator in this paper.
Figure 2.

Left: SEM micrographs of columnar CsI(Tl) scintillators. Right: the new 1.65 mm thick columnar CsI(Tl) scintillator
In summary, when a gamma-ray photon interacts with the columnar CsI(Tl) scintillator, a burst of light photons will be produced6 at the interaction position and exit the scintillator with small lateral spread after propagating through the scintillator columns.
2.2 XX1332 Image Intensifier
As a key component in the iQID detector, the image intensifier works as an amplifier for the scintillation light signal. Four generations of image intensifier have been developed7 with three common parts, a photocathode for converting incoming light photons to photoelectrons, an electron amplifier or electron accelerator to amplify the electrons’ energy, and a phosphor screen to convert the amplified electrons’ energy back to visible light photons.
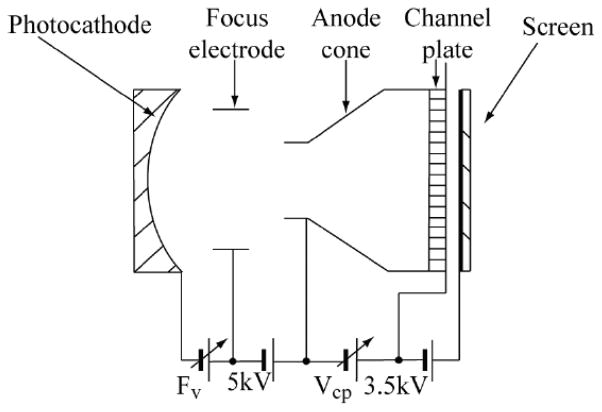
As shown in figure 3, the XX1332 image intensifier used in FASTSPECT III is a second generation image intensifier with a 50 mm-diameter input window and a 40 mm-diameter output window. It has a plano-concave, fiber-optic entrance window with an S-25 photocathode deposited on the curved surface, an electro-optical focusing mechanism to direct photoelectrons to a micro-channel plate (MCP) for electron amplification, and a P20 phosphor screen. The total optical gain is about 45,000.
Figure 3.
A schematic of XX1332 image intensifier
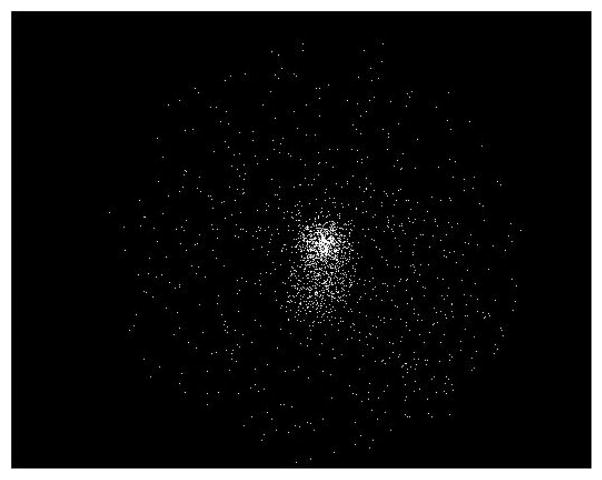
The central spot noise, as shown in figure 4, is a random signal accumulating with time at the center of output surface even when there is no input signal at the photocathode surface. The origin of this central spot noise is yet to be determined; it may be related to thermal emission in the electro-optical focusing mechanism. We present a new frame parsing algorithm in this paper that eliminates this noise frame by frame based on the statistics of central spot noise relative to real events.
Figure 4.
An image of central spot noise. It’s generated by the image intensifier in 1 minute’s acquisition with no input signal
By using the image intensifier, an amplified version of the light signal from the scintillator will be produced at the phosphor surface. Since the electro-optical focusing and MCP are both good at preserving spatial resolution, the output light signal corresponding to one gamma-ray photon interaction still has a small lateral spread.
2.3 Imaging Lens and CCD Camera
A Fujinon high quality, C-mount lens designed for machine vision applications is used to image the phosphor screen onto a CCD camera in order to record the amplified light signals from the image intensifier. The CCD camera used is a DragonFly Express CCD with 7.4×7.4 μm pixels manufactured by Point Grey Research, Inc.
The final digital signal corresponding to the gamma-ray photon will be a cluster of pixels with their values corresponding to energy that we call an event. Due to the fast decay time of the scintillator (~1 μs), the fast amplification process (<1 ns), the fast decay time of the phosphor screen (<5 ms), and the fast frame rate of CCD camera (up to 200 frames/second in 8-bit mode), the iQID detector is able to record individual gamma-ray photons detected by the scintillator with a high-count-rate capability.
3. NEW FRAME PARSING ALGORITHM AND CENTRAL SPOT NOISE ELIMINATION
3.1 New Frame Parsing Algorithm
After an event has been recorded by the CCD camera, it will be in the form of a cluster of bright pixels. A real-time image processing algorithm is required to identify the events from CCD background noise and extract their associated pixels so that we can save as much information as we can. The original GPU-based frame parsing algorithm8 was developed to extract information about the events and create a list-mode data file, which is a one-by-one collection of all of the events. A new frame parsing algorithm has been developed that is able to estimate more accurately the size of each event and use the size information to discriminate between real events and the central-spot-noise events. It’s also able to preserve weak signals.
The new frame-parsing algorithm processes raw image data with the following steps:
A frame from the CCD is acquired.
A 3×3 average filter is applied to smooth the event energy distribution and connect isolated but close pixels belonging to the same event.
The smoothed image is amplitude-thresholded above the CCD noise.
Individual clusters are identified using a connected components labeling algorithm and the pixels associated with each event are then extracted.
Important information like total energy, size and interaction position of each event is estimated.
Events with smaller size than a preset size threshold are rejected.
A visual demonstration of this algorithm is shown in figure 5.
Figure 5.

New frame parsing algorithm: (a) CCD frame with raw data, (b) average-filtered image, (c) amplitude-thresholded image, (d) individual cluster identified image using connected components labeling algorithm, (e) interaction positions estimated image after applying size threshold
In comparison, the old frame-parsing algorithm used a median filter in step (2) that can miss some loosely-connected low-intensity clusters like the one shown in the lower left corner of the magnified image block in figure 5. The other key difference is that the new frame-parsing algorithm estimates the size of each event and applies a size threshold, which yields a method to distinguish real events against background events including central-spot-noise events. To decide which size threshold to choose for a given scintillator/image intensifier combination, a calibration experiment may be required to determine the size distributions of both noise events and real events.
3.2 Central Spot Noise Elimination
As mentioned earlier, the XX1332 image intensifier creates some random thermal noise events in the center of the output screen that mix with real events and create artifacts in the reconstructed image if not removed. When a thin scintillator is used to detect gamma-ray photons, the real events have higher amplitudes than the central-spot-noise events and the original frame-parsing algorithm can discriminate the noise events by setting an amplitude threshold. However, when a thick scintillator is used, due to stronger attenuation of optical photons many real events will have equal or less amplitude than central-spot-noise events such that an amplitude threshold is ineffective.
By adding a size threshold, the new frame parsing algorithm works even when we use a thick scintillator, based on the fact that real events generally have much larger cluster sizes than the central spot noise events. An experiment was performed to assess the efficacy of this approach to eliminating central-spot noise.
The experimental setup is shown in figure 6 where a collimator is used to generate a circular projection adjacent to the central spot so that size distributions and maximum amplitude distributions (referred to as event peak distribution in figure 7 and 8) can be generated for both noise events and real events.
Figure 6.
Experimental setup for demonstrating how the new frame parsing algorithm can be superior to the old version in central spot noise elimination
Figure 7.

Central spot noise elimination demonstration for 450 μm CsI(Tl) scintillator. Left: the image showing both central spot noise and the real circular projection. Middle: the size distributions and peak distributions for both central spot events and real events. Right: the image of the real circular object after central spot noise elimination with a size threshold of 30 pixels
Figure 8.

Central spot noise elimination demonstration for 1650 μm thick CsI(Tl) scintillator. Left: the image showing both central spot noise and the real circular object. Middle: the size distributions and peak distributions for both central spot events and real events. Right: the image of the real circular object after central spot noise elimination with a size threshold of 30 pixels
The experiment was first performed with the 450 μm CsI(Tl) scintillator. Using the new frame-parsing algorithm, we can generate size and peak distributions for both kinds of events as shown in figure 7. Due to the thin thickness of the scintillator, most real events have higher amplitudes than central-spot events, and the old frame-parsing algorithm can discriminate them with an appropriate amplitude threshold. Notice that the size distributions are also well separated. The image on the right is the result of applying a size threshold of 30. The central spot is effectively eliminated.
The experiment was repeated for the 1650-μm-thickness scintillator. As shown in the two peak amplitude distributions, there is overlap due to more attenuation during optical transport through the thick crystal such that an amplitude threshold cannot discriminate without sacrificing real events. However, the size distributions are still well separated so that a size threshold eliminates the central-spot events at the expense of only a small portion of real events. The image on the right is the result of applying a size threshold of 30. We can see again the central spot is eliminated with very little residual.
From these two experiments and resulting statistics, we can conclude that:
Central spot statistics do not change as long as we don’t change image intensifier settings.
The thicker the scintillator is, the harder it is to discriminate real events from central spot noise events.
Higher-energy gamma-rays will overcome light loss due to optical photon attenuation, so for optimal central spot elimination, higher energy is preferred.
The new frame-parsing algorithm offers more flexibility in central-spot elimination.
4. EFFECTS OF SCINTILLATOR THICKNESS ON SENSITIVITY AND RESOLUTION
4.1 Detector Sensitivity vs. Scintillator Thickness
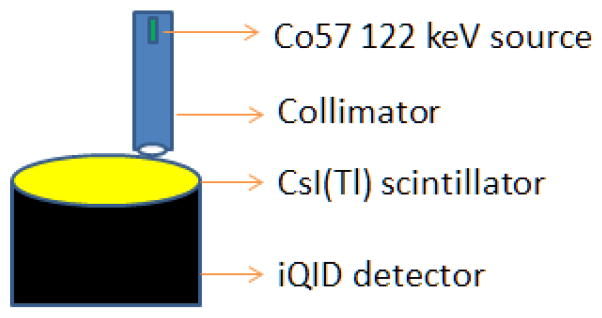
To assess how the detector sensitivity is affected by the scintillator thickness, a Co57 (122 keV) gamma-ray source was placed above the iQID detector to provide a flood image. The distance between the source and detector was adjusted so that no multiplexing occurred. The experiment was performed for both 450 μm CsI(Tl) scintillator and the thick 1650 μm CsI(Tl) scintillator. The experimental setup is shown in figure 9.
Figure 9.
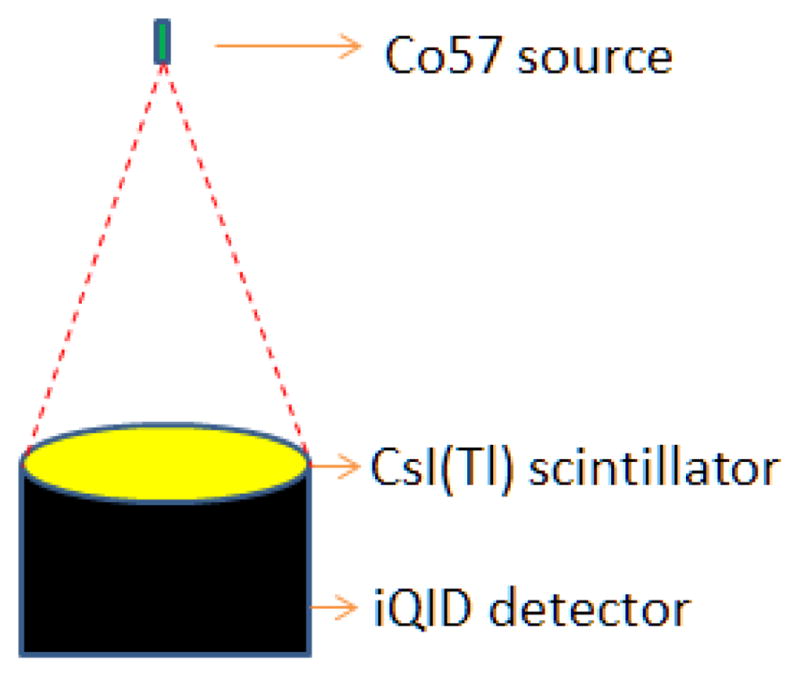
Experimental setup for sensitivity measurement
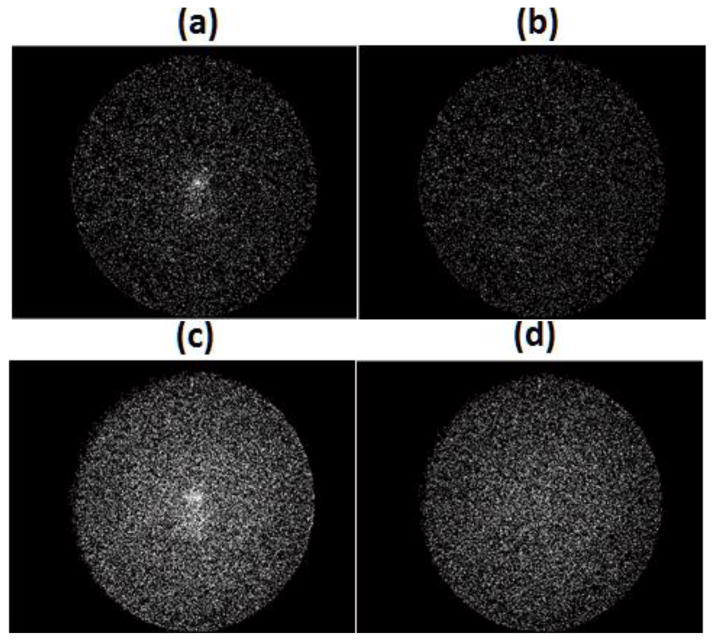
Figure 10 shows the images of events occurring during 30 seconds of acquisition for both scintillators, before and after central-spot elimination using the new frame-parsing algorithm. A null experiment with image intensifier turned on but no source present shows that approximately 2100 central spot events accumulated during 30 seconds of acquisition.
Figure 10.
Flood image of 30 seconds acquisition for: (a) 450 μm CsI(Tl) scintillator before central-spot elimination, 16447 counts; (b) 450 μm CsI(Tl) scintillator after central-spot elimination, 11546 counts; (c) 1650 μm CsI(Tl) scintillator before central spot elimmination, 48307 counts; (d) 1650 μm CsI(Tl) scintillator after central spot elimination, 31629 counts
Given the know activity of the gamma-ray source, the solid angle subtended by the image intensifier, the attenuation of both scintillators and their substrates, and the acquisition time, there should be about 39000 gamma-ray interactions for 1650 μm CsI(Tl) scintillator and 14000 gamma-ray interactions for the 450 μm CsI(Tl) scintillator. As shown in figure 10, we have captured almost all of the events for the 450 μm scintillator before we eliminate the central spot. After elimination, about 20% of the real events were also lost. For the 1650 μm-thick scintillator, we initially captured more events than the expected number before we eliminate central spot. Several reasons may apply.
First, due to the extra thickness, K x-rays have larger probability to interact with the scintillator instead of escaping. Secondly, Compton-scattered gamma rays also have larger probability to interact again with the scintillator instead of escaping. Thirdly, because the frame-parsing algorithm is not designed to recognize that a primary gamma-ray interaction and the possibly distant reabsorbed low energy K x-ray belong together, it’s possible that they are counted as two events.
After elimination of the central spot, we also eliminated most of the low-energy events mentioned above and yet maintained sensitivity about 2.7 times that of the 450 μm scintillator, close to the predicted value.
Another experiment was performed with FSIII system using a half syringe of liquid Tc99m (140 keV) source and the 1650 μm CsI(Tl) scintillator. After central-spot elimination was performed, we calculated system sensitivity.
As shown in figure 11, the images were one minute acquisitions. After central-spot elimination, the total counts in 20 iQID detectors were estimated and, based on the activity of the source, we found a system sensitivity of 106 counts/(second×MBq) for the FSIII system equipped with 1650 μm thick scintillators. This is about twice the sensitivity (~50 counts/(second×MBq)) when the 450 μm scintillators were used.
Figure 11.

Sensitivity measurement for FSIII system using 1650 μm CsI(Tl) scintillator and Tc99m source. Left: the syringe with liquid Tc99m. Middle: image of both the syringe and central spot from one iQID detector of FSIII system. Right: image of only the syringe after central spot elimination
4.2 Detector Intrinsic Resolution vs. Scintillator Thickness
The detector intrinsic resolution is also a very important property. To measure how the detector intrinsic resolution varies with the scintillator thickness, a 50 μm wide tungsten slit aperture was used to generate a line image on the CCD camera. If every component of the iQID detector is perfect with no spatial resolution degradation, the line image will have a width of ~1 pixel. The experimental setup is shown in figure 12. Both scintillators were tested to compare their effects on detector resolution.
Figure 12.

Experimental setup for detector resolution measurement
The line images for both scintillators were taken in two minute acquisitions, and a normalized Gaussian fitted line spread function (LSF) was generated for images as shown in figure 13. The DC signal due to central spot noise and other background radiation was subtracted when generating the LSF. The full-width half maximum (FWHM) of the line spread function for the 1650 μm CsI(Tl) scintillator (300 μm) is twice that of the 450 μm CsI(Tl) scintillator (150 μm). Due to more Compton scattering and lateral spread of light signal, the thicker scintillator tends to have a lower spatial resolution. However, because the other components have high-spatial-resolution-preserving properties, this iQID detector maintains an intrinsic resolution of about 300 μm.
Figure 13.

Left: line image for 450 μm CsI(Tl) scintillator; Middle: line image for 1650 μm CsI(Tl) scintillator; Right: normalized Gaussian fitted line spread function for both scintillators, FWHM for 450 μm CsI(Tl) scintillator is 150 μm and FWHM for 1650 μm CsI(Tl) scintillator is 300 μm
5. DEPTH OF INTERACTION STUDY FOR THICK CsI(Tl) SCINTILLATOR
Parallax can be a limiting factor when increasing the FOV, especially when a thick scintillator is used. We generally only estimate a 2D position for each gamma-ray interaction instead of the 3D position inside the scintillator. Not estimating interaction depth introduces an error in the source location, thus degrading the image resolution. In a SPECT system like the FSIII system, the resolution of 3D reconstructed images will be affected. Figure 14 depicts the parallax error.
Figure 14.
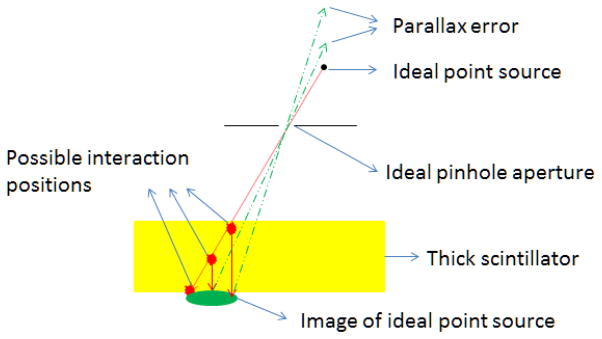
Parallax error illustration using an ideal point source, ideal pinhole aperture and a thick scintillator
To reduce parallax error, the interaction depth should also be estimated for each event. Ideally, the 3D interaction position and event energy can be estimated with maximum likelihood (ML) estimation. A depth-of-interaction (DoI) calibration is required to determine the relationship between scintillator-light output and 3D-interaction position. We performed a DoI study to show how the event size and amplitude vary with gamma-ray interaction depth, using the iQID detector with the 1650 μm thick columnar CsI(Tl) scintillator.
For the experiment, a 50 μm wide tungsten slit aperture and the 1650 μm thick scintillator were arranged as shown in figure 15. Then, using a Co57 (122 keV) source and the iQID detector, we acquired 3 minute acquisition images. For each event inside the rectangular region, an ML estimation based on a Gaussian model was performed to estimate the energy, 2D- interaction position and spatial variance of each event. Since the angle of incidence for gamma rays is fixed, the 2D- interaction position is directly related to the interaction depth. After all events inside the region were processed, correlation plots of event energy and interaction depth, and event standard deviation and interaction depth, were produced as shown in figure 16.
Figure 15.

Left: experimental setup for DoI study. Right: rectangular image of the tungsten slit aperture taken in 3 minutes acquisition, the width of which equals the thickness of scintillator due to 45 degree incidence angle
Figure 16.

(a) Extracted cluster from raw frame data. (b) ML estimation of 2D interaction position, event energy and standard deviation. (c) Event energy vs. interaction depth. (d) Event standard deviation vs. interaction depth
As expected, the event amplitude increased with increased interaction depth and reduced attenuation. The event size, represented by the standard deviation, was found to have a maximum value at certain interaction depth, about 1000 μm away from the exit surface in this experiment. As the distance between interaction position and exit surface increases, more lateral spread of light will increase the event size which is easily understood. However, when the distance keeps increasing, attenuation of visible photons propagating through the crystal starts to take effect by absorbing weak signal in the outermost region. Finally when the distance becoms so large that most energy of the initial scintillation light is absorbed by the scintillator, the event size will shrink with fewer pixels above threshold. This kind of study yields a model relating event energy, event size and interaction depth and will help with detector or system simulation.
CONCLUSIONS AND FUTURE WORK
In this paper, we have proposed a new in-line frame-parsing algorithm for discriminating against a special kind of image intensifier noise, called central-spot noise, observed in a photon-counting detector (called iQID) when low-cost image-intensifiers are used. This algorithm may also be useful in eliminating other kinds of noise. An experiment was performed to demonstrate how to apply this algorithm to eliminate central-spot noise. Experiments were also performed to compare the detector sensitivity and detector intrinsic spatial resolution between two different thickness scintillators. The results indicate that detector sensitivity can be doubled at the expense of some degradation of spatial resolution (from 150 μm to 300 μm) by replacing a 450 μm CsI(Tl) scintillator with a 1650 μm thick CsI(Tl) scintillator. Finally a depth-of-interaction (DoI) study was performed to show how event size and energy vary with gamma-ray-interaction depth using the 1650 μm thick columnar CsI(Tl) scintillator and the iQID detector. Event energy was found to decrease linearly with depth whereas event size will increase at the beginning and then decrease as the distance between interaction position and scintillator exit surface increases.
To facilitate ML estimation of 3D gamma-ray interaction position for thick scintillators on iQID detector, calibration experiments are needed to refine the relationship between scintillator light output and gamma-ray interaction depth, the image-intensifier gain statistics and the CCD camera noise statistics. These will be presented in future publications.
Acknowledgments
This work was supported by NIH/NIBIB grant P41-EB002035 “The Center for Gamma-Ray Imaging”.
References
- 1.Miller BW, Barrett HH, Barber HB, Furenlid LR. Gamma camera including a scintillator and an image intensifier. 7,928,397. 2011 Apr 19;
- 2.Miller Brian W, Bradford Barber H, Barrett Harrison H, Shestakova Irina, Singh Bipin, Nagarkar Vivek V. Single-photon spatial and energy resolution enhancement of a columnar CsI(Tl)/EMCCD gamma-camera using maximum-likelihood estimation. Proc SPIE 6142. 2006 [Google Scholar]
- 3.Miller Brian W. High-resolution gamma-ray imaging with columnar scintillators and CCD/CMOS sensors, and FASTSPECT III: A third-generation stationary. SPECT imager [Google Scholar]
- 4.Nagarkar VV, Gupta TK, Miller SR, Klugerman Y, Squillante MR, Entine G. Structured CsI(Tl) Scintillators for X-ray Imaging Applications. Nuclear Science, IEEE. 1998;45(3) [Google Scholar]
- 5.Miller Stuart R, Gaysinskiy Valeriy, Shestakova Irina, Nagarkar Vivek V. Recent advances in columnar CsI(Tl) scintillator screens. Proc SPIE 5923. 2005 [Google Scholar]
- 6.Kupinski Matthew A, Barrett Harrison H. Small-Animal SPECT Imaging. Springer; 2005. p. 37. [Google Scholar]
- 7.http://www.inframet.pl/eimage_intensifier_tubes.htm
- 8.Miller Brian W, Bradford Barber H, Furenlid Lars R, Moore Stephen K, Barrett Harrison H. Progress in BazookaSPECT. Proc SPIE. 2009 doi: 10.1117/12.843742. [DOI] [PMC free article] [PubMed] [Google Scholar]


