Abstract
Chagas disease is one of the most important yet neglected parasitic diseases in Mexico and is transmitted by Triatominae. Nineteen of the 31 Mexican triatomine species have been consistently found to invade human houses and all have been found to be naturally infected with Trypanosoma cruzi. The present paper aims to produce a state-of-knowledge atlas of Mexican triatomines and analyse their geographic associations with T. cruzi, human demographics and landscape modification. Ecological niche models (ENMs) were constructed for the 19 species with more than 10 records in North America, as well as for T. cruzi. The 2010 Mexican national census and the 2007 National Forestry Inventory were used to analyse overlap patterns with ENMs. Niche breadth was greatest in species from the semiarid Nearctic Region, whereas species richness was associated with topographic heterogeneity in the Neotropical Region, particularly along the Pacific Coast. Three species, Triatoma longipennis, Triatoma mexicana and Triatoma barberi, overlapped with the greatest numbers of human communities, but these communities had the lowest rural/urban population ratios. Triatomine vectors have urbanised in most regions, demonstrating a high tolerance to human-modified habitats and broadened historical ranges, exposing more than 88% of the Mexican population and leaving few areas in Mexico without the potential for T. cruzi transmission.
Keywords: Triatominae, Mexico, ecological niche models, Trypanosoma cruzi transmission, Chagas disease
Vector-borne transmission of Chagas disease is widespread across the Americas, from Argentina and Chile north to Mexico and the southern United States of America (USA) (Coura & Dias 2009). Recent rises in Chagas case reports in Europe and Asia derive from migrants from countries with unacceptably high incidence owing to vector-transmitted and non-vector Trypanosoma cruzi transmission (congenital, transfusion, transplant and oral transmission) (Gascon et al. 2010). The latest prevalence estimates for Latin America, which reflect reductions in only the Southern Cone region of South America following Triatoma infestans control initiatives, suggest eleven million current cases, although most countries do not have active epidemiological surveillance (Remme et al. 2006 , Hotez et al. 2008 , Lee et al. 2013).
Chagas disease is the most important parasitic disease in Mexico based on prevalence and disease burden (Hotez et al. 2012, Ramsey et al. 2014). However, the country has only a passive national surveillance program on paper, which is barely applied in the field, with no budget or signs of political will to develop an evidence-based strategy by which to prevent vector-borne transmission (over 96% of incidence) or to promote timely diagnosis, treatment and care of patients (Manne et al. 2013). Only a handful of states have focal interventions (i.e., sending personnel to search houses for triatomines and spraying insecticides) without follow-up evaluation when blood donation contamination is reported, and patient clinical treatment and care is remanded to the clinical care arm of the public healthcare system (PHS) or one of five other clinical care systems (Manne-Goehler et al. 2014). Between 1.5-2 million Mexicans are infected with T. cruzi, based on the finding that 1-1.5% of blood donations are contaminated (Guzmán et al. 1998, Ramsey & Schofield 2003, Novelo-Garza et al. 2010), with 500,000-650,000 chronic cases (of a total population of 122 million) and an estimated incidence based on a 3.57% birth rate of 65,000 new cases per year (Ramsey et al. 2003). Some estimates claim the lower prevalence of 1.1 million, which, although optimistic, is not based on representative data because the health sector has never conducted a country-wide study or included Chagas disease in any national seroepidemiological health surveys, except the first (Velasco-Castrejon et al. 1992 , Hotez et al. 2012).
Independent of the exact figure, it is shocking that no systematic or formal interventions exist to reduce bug populations in human communities in Mexico. Although isolated anti-vector activities occur in a few states (Morelos, Oaxaca, Veracruz, San Luis Potosi), this disease remains largely unattended, with minimal access to diagnosis and treatment for those infected (Manne et al. 2013). No clinical guide exists for Chagas disease in Mexico; little or no access to medication or treatment is available to diagnosed patients and most healthcare professionals (physicians and nurses) have no knowledge of the diagnosis, treatment or follow-up required for the disease.
In all, 31 autochthonous species of Triatominae are found in Mexico (Triatoma protracta includes four subspecies and Triatoma rubida includes five subspecies) and all have been found to be naturally infected with T. cruzi, except for the four rarest species: Belminus costaricensis, Triatoma bassolsae, Triatoma bolivari and Triatoma gomeznunezi (Ryckman 1962, Zárate & Zárate 1985, Tay et al. 1992 , Vidal et al. 2000 , Magallón et al. 2001, Ibarra-Cerdeña et al. 2009). Five species do not belong to the primary genus Triatoma; one each belongs to the genera Eratyrus, Belminus, Paratriatoma, Dipetalogaster and Panstrongylus.
Mexican species of Triatoma belong to two subgroups: protracta and rubrofasciata (Lent & Wygodzinsky 1979). The former includes the protracta complex, with six species and four subspecies of T. protracta in Mexico and the lecticularia complex (principally Triatoma lecticularia, with one record for Triatoma incrassata and two for Triatoma indictiva in Mexico) (Ryckman 1962 , Galvão et al. 2003 , Kjos et al. 2009). The rubrofasciata subgroup includes the rubida complex (5 subspecies of T. rubida) of northern Mexico and the southern USA (Pfeiller et al. 2006), the phyllosoma complex, which is found only in Mexico (11 species including Triatoma recurva) and the dimidiata complex [3 haplogroups (hg) of Triatoma di- midiata and Triatoma hegneri] (Ibarra-Cerdeña et al. 2009). One species has not been assigned because only one specimen of this species has been collected (T. gomeznunezi) (Martínez et al. 1994). Recent studies have highlighted the need for a revision of triatomine systematics because phylogenetic results conflict with the current taxonomy (Ibarra-Cerdeña et al. 2014 , Justi et al. 2014).
Most Mexican bugs are generalists, living in terrestrial, arboreal and cave mammal nests or roosts and almost all readily persist in modified habitats with domesticated mammals and humans (Becerril-Flores et al. 2007, Martínez-Ibarra et al. 2010, Medina-Torres et al. 2010, Ramsey et al. 2012, Torres-Montero et al. 2012). Nineteen species have been consistently found to invade human houses and only 12 rare sylvatic species are found only occasionally in association with humans.
Disease control strategies for vector-borne pathogens focus on vector reduction or elimination in areas of human exposure. The Southern Cone Initiative and recently the Central American Initiative for Chagas Disease Control have focused on domesticated populations of two species, T. infestans and Rhodnius prolixus, respectively (Dias 2007, Hashimoto & Schofield 2012). However, all epidemiologically relevant T. cruzi vector species in Mexico have been collected year-round in anthropogenic landscapes (Ramsey et al. 2012), and human feeding and contact occur both in domestic and (sometimes more so) in nondomestic habitats (Cohen et al. 2006 , Stevens et al. 2014).
A necessary step towards understanding Chagas disease in Mexico and stratifying transmission risk is the development of a detailed understanding of the distribution of Triatominae across the country. To this end, modelling ecological niches at coarse scales, based on the Grinellian niche concept (Soberón 2007), attempts to discover the set of environmental conditions under which a species can maintain populations in the absence of immigration (Soberón & Peterson 2005) based on occurrence data from museum collections, field samples and the literature (Soberón & Peterson 2004) and data for environmental conditions such as climate and topography. Niche models can identify suitable areas where each species can maintain populations, even though only partial occurrence data are available or when major distributional areas of species remain unsampled (Soberón & Peterson 2005). Because zoonotic disease transmission depends on processes acting at multiple scales, niche modelling approaches incorporate different information for different taxa (Peterson 2006 , Ibarra-Cerdeña et al. 2009 , Costa & Peterson 2012). Niche model-based predictions of exposure areas have been developed and explored for many zoonotic diseases (Peterson et al. 2005 , Lash et al. 2012 , Moo-Llanes et al. 2013), including T. cruzi mammalian reservoirs in Mexico (Peterson et al. 2002) and T. cruzi vector species from Brazil, Mexico and the USA (Costa et al. 2002 , Beard et al. 2003 , López-Cárdenas et al. 2005 , Sandoval-Ruiz et al. 2008, 2012 , 2012, Batista & Gurgel-Gonçalves et al. 2009, Ibarra-Cerdeña et al. 2009 , Benítez-Alva et al. 2012 , Gurgel-Gonçalves et al. 2012). Spatial prediction and the stratification of vector exposure are extremely useful for epidemiological surveillance and planning, cost-efficient prevention and control activities (Tarleton et al. 2014). Given the current lack of country-wide surveillance, vector control or prevention activities for Chagas disease in Mexico and the absence of robust and geographically uniform or representative collections, such evidence-based mapping of potential vector distributions could greatly assist in identifying current and potential exposure areas.
Hence, this study aimed to produce a state-of-knowledge atlas of the geographic distributions of Mexican triatomine bugs and their associations with T. cruzi and human demographics, based on ecological niche models (ENMs). Transmission areas for T. cruzi were overlaid on the latest Mexican population census (2010) to improve our understanding of at-risk areas and identify gaps in knowledge. The maps produced are made in Geographic Information System-readable raster formats to create, in effect, a national atlas of the distributions of these vector species.
MATERIALS AND METHODS
Input data - Occurrence data were accumulated from diverse sources, including all known triatomine collection records from the literature for all of North America (PubMed using the search words “Triatominae” and “Mexico” and the scientific names of each species known from Mexico prior to 2014), publication references from reviews or publications not in PubMed prior to 2002, grey literature and government reports in Mexico, entomological collections [Biology Institute/National Autonomous University of Mexico, National Museum of American History/Smithsonian Institution, Global Biodiversity Information Facility (gbif.org)] and personal collections (JMR). ENMs were developed for Mexican species for which ≥ 10 unique collection data points were available in North America. Twenty species met this criterion, but Triatoma neotomae had 10 occurrence points divided between two distant regions, producing unsatisfactory models, so this species was not included.
ENMs were calibrated using all occurrence points in North America because major portions of the species distributions for the lecticularia and protracta complexes fall outside Mexican national boundaries (Peterson et al. 2011). A total of 2,580 occurrence points were available for 38 species and subspecies: Belminus (1 species), Dipetalogaster (1 species), Eratyrus (1 species), Panstrongylus (1 species), Paratriatoma (1 species) and Triatoma (26 species and 7 additional subspecies). Based on the range of known occurrences, species were classified according to biogeographic region as Neotropical (16 species), Nearctic (12 species + 7 subspecies) or both (3 species), using regionalisation layers defined by Olson et al. (2001). A total of 2,519 occurrence points corresponded to the 19 species for which ENMs were developed. ENMs for T. protracta and T. rubida included occurrences of the type subspecies (T. p. protracta and T. r. rubida); the three hg of T. dimidiata (hg1, hg2 and hg3) were modelled separately (Table I).
TABLE I. Mexican Triatominae, their biogeographic region, occurrence points and accuracy for ecological niche models (ENMs) of 19 species.
| Id | Species complex | Species | Subspecies | Region | Points | Background | p |
|---|---|---|---|---|---|---|---|
| 1 | Lecticularia | Triatoma incrassata | - | Nearctic | 5 | - | - |
| 2 | Triatoma indictiva | - | Nearctic | 5 | - | - | |
| 3 | Triatoma lecticularia | - | Nearctic | 30 | 9,230,464 | 6.01E-02 | |
| 4 | Protracta | Triatoma barberi | - | Nearctic/Neotropical | 369 | 10,069,567 | 3.91E-21 |
| 5 | Triatoma neotomae | - | Nearctic | 10 | - | - | |
| 6 | Triatoma nitida | - | Neotropical | 7 | - | - | |
| 7 | Triatoma peninsularis | - | Nearctic | 10 | 9,230,464 | 1.45E-33 | |
| 8 | Triatoma protracta | T. p. protracta | Nearctic | 177 | 9,230,464 | 1.63E-07 | |
| 9 | T. p. nahuatlae | ||||||
| 10 | T. p. woodi | ||||||
| 11 | T. p. zacatecensis | ||||||
| 12 | Triatoma sinaloensis | - | Nearctic | 5 | - | - | |
| 13 | Rubida | Triatoma rubida | T. r. cochimiensis | Nearctic | 121 | 9,283,966 | 4.74E-24 |
| 14 | T. r. jaegeri | ||||||
| 15 | T. r. rubida | ||||||
| 16 | T. r. sonoriana | ||||||
| 17 | T. r. uhleri | ||||||
| 18 | Phyllosoma | Triatoma bassolsae | - | Neotropical | 1 | - | - |
| 19 | Triatoma brailovskyi | - | Neotropical | 11 | 652,655 | 6.68E-01 | |
| 20 | Triatoma bolivari | - | Neotropical | 4 | - | - | |
| 21 | Triatoma gerstaeckeri | - | Nearctic | 164 | 9,270,987 | 1.88E-17 | |
| 22 | Triatoma longipennis | - | Nearctic/Neotropical | 233 | 10,069,567 | 1.14E-14 | |
| 23 | Triatoma mazzottii | - | Neotropical | 80 | 696,139 | 9.36E-03 | |
| 24 | Triatoma mexicana | - | Nearctic/Neotropical | 271 | 10,069,567 | 5.96E-22 | |
| 25 | Triatoma pallidipennis | - | Neotropical | 291 | 690,750 | 1.79E-26 | |
| 26 | Triatoma phyllosoma | - | Neotropical | 40 | 650,095 | 4.11E-03 | |
| 27 | Triatoma picturata | - | Neotropical | 16 | 680,567 | 2.87E-04 | |
| 28 | Triatoma recurva | - | Nearctic | 33 | 9,275,367 | 4.29E-08 | |
| 29 | Dimidiata | Triatoma dimidiata hg 1 | - | Neotropical | 77 | 650,095 | 4.78E-11 |
| 30 | Triatoma dimidiata hg 2 | - | Neotropical | 485 | 701,541 | 6.60E-14 | |
| 31 | Triatoma dimidiata hg 3 | - | Neotropical | 42 | 650,039 | 2.71E-07 | |
| 32 | Triatoma hegneri | - | Neotropical | 6 | - | - | |
| 33 | Belminus costaricensis | - | Neotropical | 2 | - | - | |
| 34 | Dipetalogaster maximus | - | Nearctic | 6 | - | - | |
| 35 | Eratyrus cuspidatus | - | Neotropical | 13 | 650,095 | 1.44E-05 | |
| 36 | Panstrongylus rufotuberculatus | - | Neotropical | 9 | - | - | |
| 37 | Paratriatoma hirsuta | - | Nearctic | 56 | 9,230,464 | 6.69E-02 | |
| 38 | Triatoma gomeznunezi | - | Neotropical | 1 | - | - | |
| Total | - | - | - | 2,580 | - | - | |
| Trypanosoma cruzi | - | Nearctic/Neotropical | 669 | 10,069,567 | 4.48E-50 |
An additional dataset was constructed for Mexico and the USA for known T. cruzi occurrences using infections in reservoirs, triatomines and human cases georeferenced to communities across Mexico from the Institute for Epidemiologic Diagnosis and Reference, National Center for Preventive Programs and Disease Control, published reports and unpublished data of the first author, which totalled 669 records from 1936-2014. All occurrence data for Triatominae and T. cruzi are available on DRYAD for open access and use by the broader community (doi: 10.5061/dryad.rq120).
ENMs - Ecological niches were calibrated using DesktopGarp (Genetic Algorithm for Rule Set Prediction) (nhm.ku.edu/desktopgarp/), an evolutionary computing software package available for public download (Stockwell & Peters 1999). Specifically, GARP relates the ecological characteristics of known occurrence points to those of points randomly sampled from the remaining calibration area, seeking to develop a set of decision rules that best summarise factors associated with the species’ presence (Peterson et al. 2002). In GARP, input occurrence data are divided into calibration (70%) and evaluation (30%) subsets (Anderson et al. 2003). GARP works in an iterative process of rule selection, evaluation, testing and incorporation or rejection. A method is chosen from a set of possibilities (i.e., logistic regression, bioclimatic rules), it is then applied to the calibration data and a rule is developed or evolved. Rules may evolve by a number of means that mimic DNA evolution: point mutations, deletions, crossing over etc. The change in predictive accuracy from one iteration to the next is used to evaluate whether a particular rule should be incorporated into the model and the algorithm runs either 1,000 iterations or until convergence. We used 13 data layers to characterise ecological landscapes: four layers summarising aspects of topography (elevation, slope, aspect and topographic index) from the US Geological Survey’s Hydro-1K data set (usgs.gov/) and nine climate variables from WorldClim (Bio 1, 4, 5, 6, 7, 12, 13, 14, 15) (worldclim.org/) selected based on low inter-correlations (r < 0.75) in an analysis of multicollinearity (Moo-Llanes et al. 2013). All variables had a spatial resolution of 0.0083° (~1 km2).
We assigned species to biogeographic regions for calibration areas if more than 80% of the data points fell inside one region (Neotropical or Nearctic); three species (Triatoma longipennis, Triatoma mexicana, Triatoma barberi) were classified as Nearctic/Neotropical because occurrences fell in both regions. Additionally, species were assigned to biogeographic subgroups based on overall range areas, such that Triatoma peninsularis was assigned to subgroup 1 of the Nearctic Region (Nearctic 1) due to its exclusive presence in the Baja California Peninsula. All other Nearctic species were assigned to subgroup 2 (Nearctic 2). Neotropical species were also divided into two subgroups based on overall ENM areas: smaller than 70,000 km2 (Neotropical 1) or greater than 100,000 km2 (Neotropical 2). To avoid potential modelling bias related to an important component of model calibration, the accessible region “M” (Barve et al. 2012) was taken as the biogeographic region of known occurrence. The occurrences of each species were assessed to determine whether data points were within 100 km of the biogeographic region border: such species were Triatoma brailovskyi, T. dimidiata hg2, Triatoma gerstaeckeri, Triatoma mazzottii, Triatoma pallidipennis, Triatoma picturata, T. recurva and T. rubida. A 100-km radius buffer was created around each occurrence point of these species to extend the limits of the calibration region (Owens et al. 2013).
Model accuracy was assessed by examining the omission rates associated with the evaluation points (Anderson et al. 2003). ENMs were thresholded such that at least 95% of the occurrence points were within the predicted area and these thresholds were used to convert model outputs into binary maps (presence/absence). To test model significance, we compared the predictive success of the models against null expectations using a cumulative binomial test (Peterson et al. 2011).
The range size of each species modelled was calculated as the number of pixels covered by its suitable area within M (Moo-Llanes et al. 2013). To calculate the elevational ranges for each species, we combined the elevation layer for each vector with model predictions and the elevation layer for T. cruzi. We excluded the lower and upper 5% of the distribution to remove outliers. The average elevation was calculated as the geometric mean elevation of pixels classified as suitable (Moo-Llanes et al. 2013). Land use data from the National Forestry Inventory (SEMARNAT-NFI 2007) were reclassified into “conserved” and “modified” categories (Table II). All ENMs were combined and the binary presence/absence raster was overlaid on the forestry classification data to map and calculate the proportion of pixels in each category.
TABLE II. Reclassification of the National Forestry Inventory for conserved and modified land use.
| Land use | Conserved | Modified |
|---|---|---|
| Agriculture (seasonal) | - | x |
| Agriculture (irrigation and humidity) | - | x |
| No apparent vegetation | - | x |
| Human settlement | - | x |
| Deciduous and semi-deciduous | x | - |
| Conifers | x | - |
| Conifers-broadleaf evergreen forest | x | - |
| Broadleaf evergreen forest | x | - |
| Xerophilous scrubland | x | - |
| Mesophilous mountain | x | - |
| Mezquite | x | - |
| Other vegetation | x | - |
| Grasslands | x | - |
| Perennial and sub-perennial | x | - |
| Planted forest | - | x |
| Hydrophilic vegetation | x | - |
ENMs for the 19 Mexican triatomine species were combined with that for T. cruzi to develop a map summarising coincidence and the potential for transmission by each species. Each map was combined with the Mexican census database (inegi.gob.mx) to link to all registered communities in Mexico (192,246 total) (doi: 10.5061/dryad.rq120) and calculate the resident population at risk for T. cruzi vector transmission for rural (< 10,000 inhabitants) and urban (> 10,000 inhabitants) categories, as reported in Moo-Llanes et al. (2013).
Triatomine species richness and T. cruzi vector-transmission - To estimate current triatomine species richness across Mexico, the 19 triatomine ENMs were adjusted to include only the portion of the ENM covered by 100-km buffers surrounding known occurrences (estimate of M) for each species, thereby eliminating areas that were likely unoccupied by species (Olson et al. 2001). Occurrence point buffers (100-km, based on appropriate environmental space models) were created for the remaining 12 species and seven additional subspecies of T. protracta and T. rubida and these buffers were overlain with the 19 adjusted ENMs. A T. cruzi vector transmission map was developed using the triatomine species richness model and the T. cruzi ENM. The two binary models were combined (arithmetic sum of binary classification) using the Map Algebra function of the Spatial Analyst of ArcGIS v.10.0 to project the current exposure for T. cruzi vector transmission.
Data analyses - Differences for ENM mean breadth, mean elevation, modified and conserved land coverage, conserved/modified land cover index, rural/urban population index, rural population, land cover and conserved/modified land cover index among the biogeographic regions were evaluated using one-way ANOVA (Tukey’s F for comparison of means) using R software v.2.15.1 (r-project.org/).
RESULTS
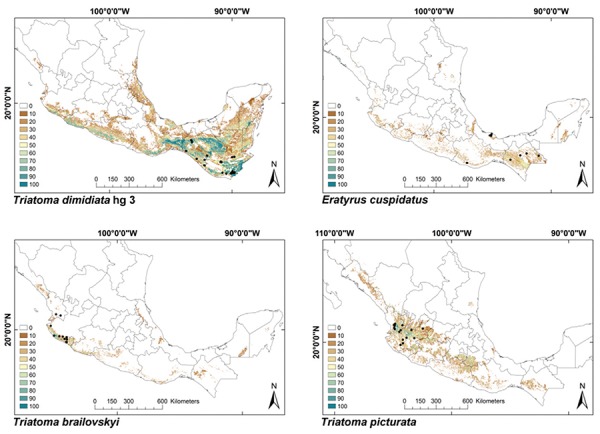
ENMs - The binomial tests of the ability to predict known distributions were significant (p < 0.05) for all but three species: Paratriatoma hirsuta, T. lecticularia and T. brailovskyi (Table I). ENMs for the 19 triatomine species analysed are presented according to biogeographic region, with occurrence data points shown in Figs 1-5. The species with the broadest geographic distributions in Mexico were those from the Nearctic Region (Nearctic 2) (Fig. 4), with T. protracta’s distribution being the largest (55.1% of the country) and T. peninsularis’s (Nearctic 1) (Fig. 5) being the smallest (1.2%) (Table III). Species occurring in both regions had the second broadest ENMs (Fig. 1), followed by the principal Neotropical group (Neotropical 2) (Fig. 3); the Nearctic 2 region had a mean range size that was significantly higher than those of all other groups (Table IV) (df = 3, F = 8.8, p = 0.0016). The potential distributions of Nearctic 2 species covered the greatest proportion of the country (average 36.5%), whereas species in Nearctic/Neotropical cover an average 19% and the principal Neotropical Region 2, 12.4% of Mexico (Table IV). Generally, all Triatoma complexes had similar ranges: the protracta complex species covered between 1.2-55.1% of the country, the phyllosoma complex species covered between 1.7-43.8% and the dimidiata complex species covered between 3.2-20.1% of the country.
Fig. 4: ecological niche models for Mexican Triatominae distributed in the Nearctic Region, subgroup 2. Colour brown to blue for increasing best subset models, black dots are occurrence points.
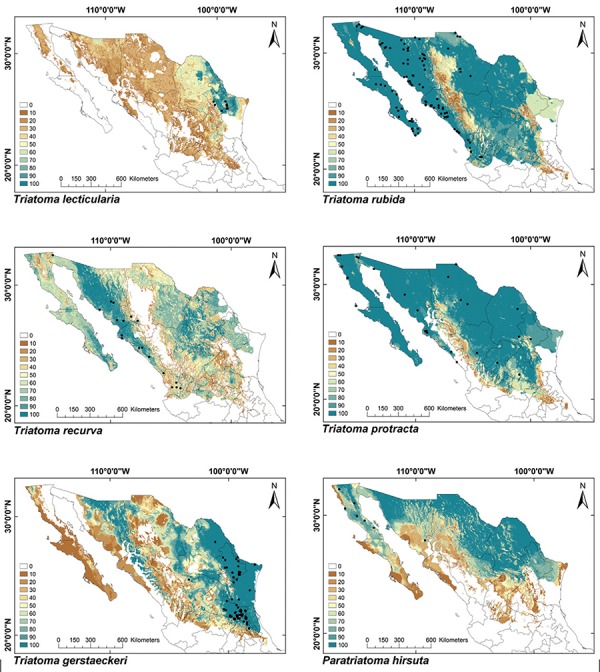
Fig. 5: ecological niche models for Mexican Triatominae distributed in the Nearctic Region, subgroup 1. Colour brown to blue for increasing best subset models, black dots are occurrence points.
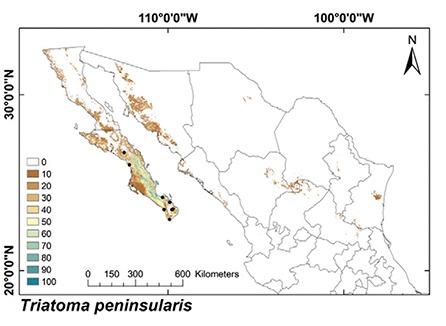
TABLE III. Niche breadth and elevation for ecological niche models of the 19 most abundant Mexican triatomine species.
| Id | Species | Biogeographic region | Background model | Niche breadth Mexico | ENM Mexico (%) | Elevation mean (m) | Elevation range (m) (min-max) |
|---|---|---|---|---|---|---|---|
| 1 | Triatoma peninsularis | Nearctic 1 | 9.230 | 20,892 | 1.2 | 102 | (0-225) |
| 2 | Triatoma brailovskyi | Neotropical 1 | 0.652 | 28,735 | 1.7 | 409 | (39-1,041) |
| 3 | Triatoma picturata | 0.680 | 39,457 | 2.3 | 1,286 | (718-1,731) | |
| 4 | Triatoma dimidiata hg 3 | 0.650 | 55,391 | 3.2 | 658 | (88-1,395) | |
| 5 | Eratyrus cuspidatus | 0.650 | 64,912 | 3.8 | 877 | (342-2,289) | |
| 6 | Triatoma dimidiata hg 1 | Neotropical 2 | 0.650 | 99,969 | 5.8 | 44 | (1-190) |
| 7 | Triatoma phyllosoma | 0.650 | 144,082 | 8.4 | 832 | (18-1,850) | |
| 8 | Triatoma pallidipennis | 0.690 | 153,414 | 8.9 | 1,210 | (622-1,781) | |
| 9 | Triatoma mazzottii | 0.696 | 321,170 | 18.7 | 838 | (22-1,785) | |
| 10 | Triatoma dimidiata hg 2 | 0.701 | 344,142 | 20.1 | 259 | (10-1,045) | |
| 11 | Triatoma mexicana | Nearctic/ Neotropical | 10.069 | 206,127 | 12 | 1,371 | (113-2,107) |
| 12 | Triatoma longipennis | 10.069 | 338,878 | 19.7 | 1,354 | (377-2,084) | |
| 13 | Triatoma barberi | 10.069 | 435,238 | 25.4 | 1,751 | (1,047-2,321) | |
| 14 | Triatoma lecticularia | Nearctic 2 | 9.230 | 166,837 | 9.7 | 433 | (92-975) |
| 15 | Triatoma recurva | 9.275 | 751,620 | 43.8 | 768 | (14-1,587) | |
| 16 | Triatoma gerstaeckeri | 9.270 | 434,242 | 25.3 | 792 | (18-1,598) | |
| 17 | Triatoma rubida | 9.283 | 832,345 | 48.5 | 607 | (1-1,325) | |
| 18 | Triatoma protracta | 9.230 | 945,643 | 55.1 | 946 | (28-1,889) | |
| 19 | Paratriatoma hirsuta | 9.230 | 625,625 | 36.5 | 896 | (48-1,642) | |
| - | Trypanosoma cruzi | Nearctic/ Neotropical | 10.069 | 1,565,392 | 91.2 | 786 | (10-1,900) |
background model expressed values in millions of pixels. ENM: ecological niche model.
Fig. 1: ecological niche models for Mexican Triatominae distributed in both Nearctic and Neotropical regions. Colour brown to blue for increasing best subset models, black dots are occurrence points.
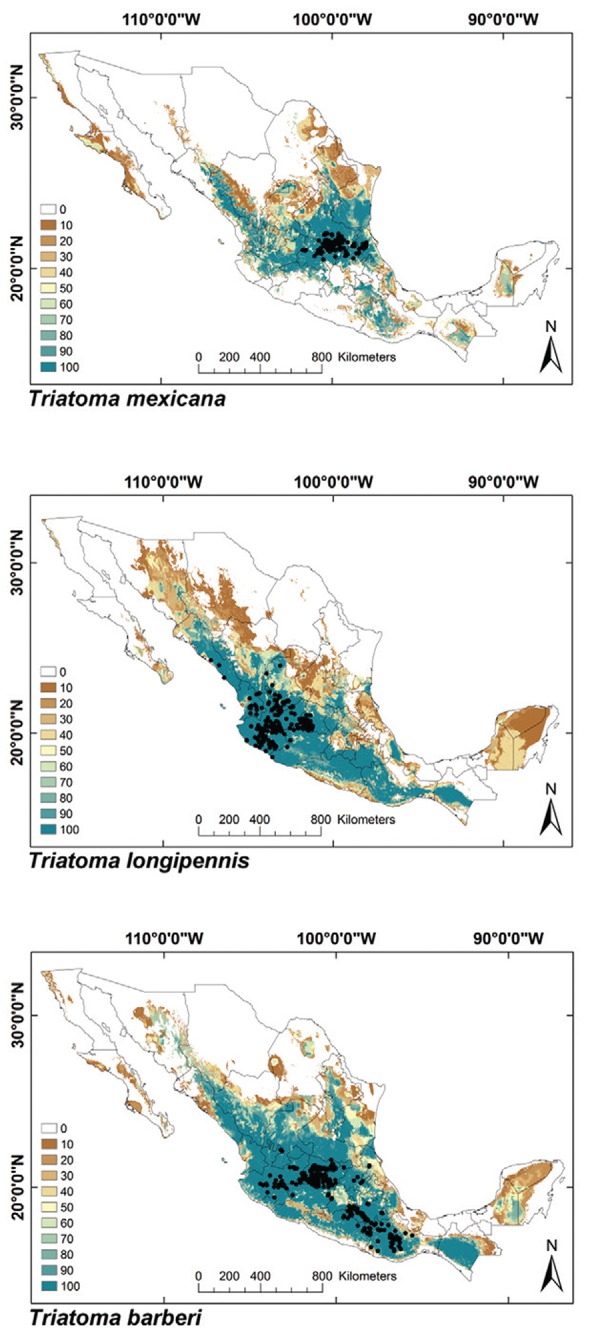
Fig. 3: ecological niche models for Mexican Triatominae distributed in the Neotropical Region, subgroup 2. Colour brown to blue for increasing best subset models, black dots are occurrence points.
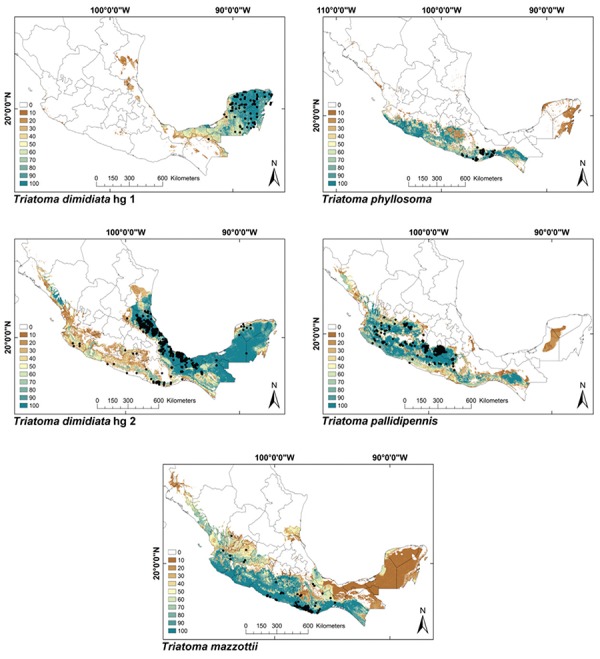
TABLE IV. Niche breadth, elevation, population coverage and land use indices for biogeographic regions.
| Biogeographic region
|
|||||||
|---|---|---|---|---|---|---|---|
| Nearctic 1 | Neotropical 1 | Neotropical 2 | Nearctic/Neotropical | Nearctic 2 | |||
|
| |||||||
| Species (n) | 1 | 4 | 5 | 3 | 6 | F | p |
|
| |||||||
| Mean breadth (km2) | 20,892 | 47,124a | 212,555a | 326,748a,b | 626,052b | 8.79 | 1.60E-03 |
| Coverage for Mexico (%) | 1.2 | 2.7a | 12.4a | 19a,b | 36.5b | 8.78 | 1.60E-03 |
| Mean elevation (m) | 102 | 807a,b | 637a | 1,492b | 740a | 4.50 | 2.06E-02 |
| Total range elevation (m) | 225 | 1,317a | 1,196a | 1,658a | 1,469a | 0.68 | 5.78E-01 |
| Rural population (n) | 330,244 | 3,980,399a | 11,348,692a,b | 25,390,610b | 8,844,201a,b | 3.63 | 3.96E-02 |
| Rural/urban population index | 0.09 | 1.31b | 0.75a,b | 0.48a | 0.37a | 5.66 | 9.40E-03 |
| Rural communities (n) | 4,320 | 21,326a | 55,614a,b | 116,848c | 64,329b | 10.97 | 6.00E-04 |
| Urban communities (n) | 16 | 83a | 251a | 640b | 236a | 20.58 | 0 |
| Modified land cover (km2) | 703 | 18,725a | 85,670a,b | 127,948b | 126,098b | 5.00 | 1.18E-02 |
| Conserved land cover (km2) | 20,078 | 28,399a | 126,671a | 193,957a | 501,454b | 10.20 | 8.00E-04 |
| Conserved/modified index | 28.56 | 1.57a | 1.63a | 1.49a | 3.91b | 19.39 | 0 |
a, b: statistically different (p < 0.05). Triatoma peninsularis (Nearctic 1) is not included in analyses.
The mean elevation for ENMs varied from 44 m (T. dimidiata hg1) to 1,751 m (T. barberi) (Table III). The highest mean elevation was observed for species located in both Nearctic/Neotropical regions, followed by the Neotropical Region which had lowest niche breadth (Neotropical 1); mean elevation of the Nearctic/Neotropical regions was significantly higher than all others (Table IV) (df = 3, F = 4.50, p = 0.021). Species of both Nearctic regions had the lowest mean elevations.
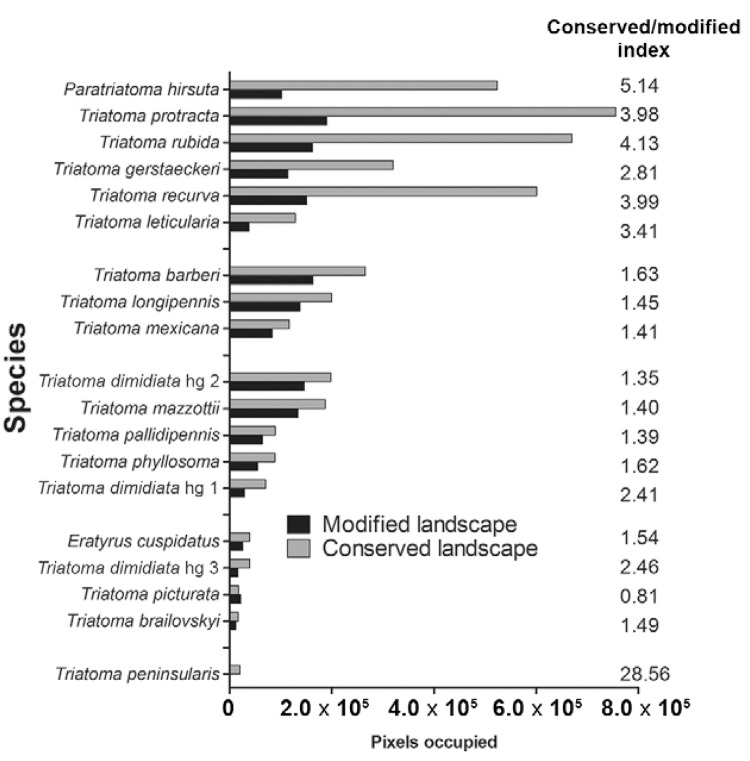
The ENMs of Nearctic 2 triatomine species had predominately conserved land cover (79.2%) (Fig. 6), whereas other regions had equivalent proportions of conserved and modified land cover: 59.9%, 61.2% and 59.1% for conserved land cover in the Nearctic/Neotropical, Neotropical 2 and 1 regions, respectively (Fig. 7, Table IV) (df = 3, F = 10.2, p = 0.0008). The conserved/modified land cover index for the Nearctic 2 region was significantly different from that of the other three regions (df = 3, F = 19.4, p < 0.0001). The modified land cover area was similar between the Nearctic 2 group and the Nearctic/Neotropical regions, both of which were slightly lower than that of the Neotropical 2 group (df = 3, F = 5.0, p = 0.001). T. picturata had the smallest area of conserved land cover (0.80), whereas T. peninsularis, which is highly sylvatic and reduced to the Baja California Peninsula, had the highest conserved/modified land cover ratio (28.6).
Fig. 6: composite binary map of all Triatominae ecological niche models (ENM) classified according to modified (red) or conserved (green) landscape cover.
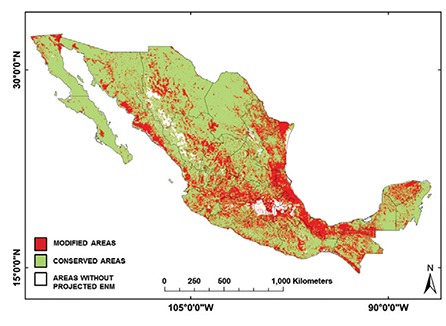
Fig. 7: landscape cover types and conserved/modified index for Mexican Triatominae ecological niche models.
Triatomine exposure of the Mexican population - T. cruzi´s ENM was found to cover 91.2% of Mexico (Fig. 8). The total Mexican population with vector exposure for at least one bug species was 99,911,867 inhabitants, which is 88.9% of the current Mexican population. This coverage was similar for rural (88.1%) and urban populations (89.4%) (Table V). More than 90.1% of the communities in the country are located in potential vector distribution areas. Vector transmission models were overlaid onto the 2010 census database to stratify exposure for all communities in the country (doi: 10.5061/dryad.rq120): the exposed population was highest where triatomines covered both biogeographic regions (T. longipennis, T. mexicana and T. barberi), followed by regions where Nearctic 2 and Neotropical 2 species occur. The mean exposed populations were significantly different among biogeographic regions (Table IV) (df = 3, F = 3.64, p = 0.04).
Fig. 8: ecological niche model for T. cruzi. Black dots are occurrence points for the species from bugs, humans and other mammals.
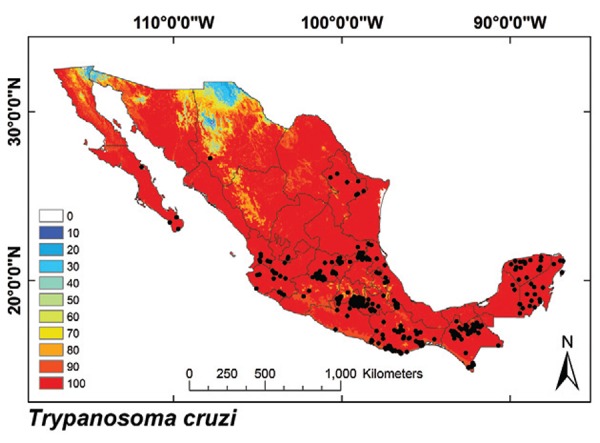
TABLE V. Urban and rural population and communities exposed to Triatominae in Mexico.
| Vector | Total population (n) | Urban population (n) | Rural population | Rural/urban population index | Urban communities (n) | Rural communities (n) |
|---|---|---|---|---|---|---|
| Triatoma peninsularis | 3,992 | 3,661 | 0.330 | 0.09 | 16 | 4,320 |
| Triatoma brailovskyi | 1,132 | 0,339 | 0.792 | 2.33 | 11 | 5,494 |
| Triatoma picturata | 13,499 | 8,511 | 4.988 | 0.59 | 152 | 23,997 |
| Triatoma dimidiata hg 3 | 12,534 | 5,018 | 7.516 | 1.50 | 114 | 41,254 |
| Eratyrus cuspidatus | 5,802 | 3,178 | 2.623 | 0.83 | 55 | 14,561 |
| Triatoma dimidiata hg 1 | 8,415 | 4,810 | 3.604 | 0.75 | 79 | 17,314 |
| Triatoma phyllosoma | 16,634 | 9,783 | 6.850 | 0.70 | 159 | 34,431 |
| Triatoma pallidipennis | 29,214 | 17,860 | 11.354 | 0.64 | 290 | 52,898 |
| Triatoma mazzottii | 42,598 | 24,639 | 17.958 | 0.73 | 412 | 87,962 |
| Triatoma dimidiata hg 2 | 34,715 | 17,740 | 16.974 | 0.96 | 313 | 85,467 |
| Triatoma mexicana | 67,005 | 47,514 | 19.491 | 0.41 | 496 | 93,638 |
| Triatoma longipennis | 80,904 | 54,292 | 26.611 | 0.49 | 702 | 121,520 |
| Triatoma barberi | 85,684 | 55,614 | 30.069 | 0.54 | 722 | 135,386 |
| Triatoma lecticularia | 22,460 | 16,275 | 6.184 | 0.38 | 168 | 43,740 |
| Triatoma recurva | 29,868 | 21,531 | 8.337 | 0.39 | 230 | 60,065 |
| Triatoma gerstaeckeri | 38,047 | 26,350 | 11.696 | 0.44 | 274 | 80,422 |
| Triatoma rubida | 42,942 | 31,601 | 11.340 | 0.36 | 301 | 79,886 |
| Triatoma protracta | 37,460 | 27,226 | 10.234 | 0.38 | 263 | 73,506 |
| Paratriatoma hirsuta | 24,896 | 19,624 | 5.271 | 0.27 | 177 | 48,355 |
urban communities are classified as ≥ 10,000 inhabitants. Population is expressed in millions of inhabitants.
Although the average exposed population in urban and rural areas as well as rural and urban communities was the highest for species occurring in both biogeographic regions, the group with the highest rural/urban index was the smaller of the Neotropical groups (Neotropical 1) (Fig. 2, Table V). In this group, more inhabitants from rural than urban communities were exposed (rural/urban index = 1.31). None of the other biogeographic groups had an index above 1, indicating that more inhabitants in urban communities were exposed to vector transmission than those in rural populations in these regions; the rural/urban index was significantly different among biogeographic groups (Table IV) (df = 3, F = 5.66, p = 0.009). The highest proportion of exposed urban population was found in the Nearctic 2 region, followed by that from species covering both regions and the Neotropical 2 group, which was similar to the trend for niche breadth.
Fig. 2: ecological niche models for Mexican Triatominae distributed in the Neotropical Region, subgroup 1. Colour brown to blue for increasing best subset models, black dots are occurrence points.
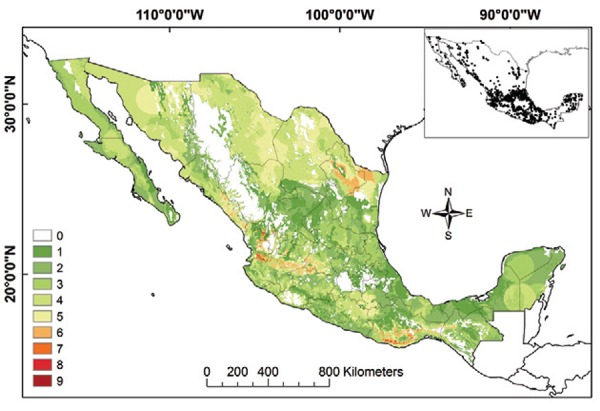
Triatomine species richness and T. cruzi transmission niche - Species richness for Mexican Triatominae based on adjusted ENMs (for current and not potential distributions) was higher in the Neotropical Region than in the Nearctic Region (Fig. 9). The areas of the greatest species richness were the Sierra Madre Oriental, the Transverse Neovolcanic Belt, northern Sonora, along the Pacific Coast and the Sierra Madre Occidental, the Balsas Basin and the Sierra Madre del Sur and Oaxaca Coast.
Fig. 9: species richness of Triatominae in Mexico. Insert map illustrates all data points used in modelling. Colours green to red represent number of species present.
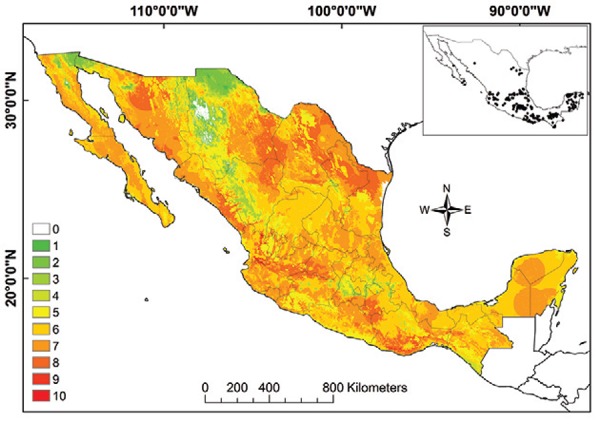
The vector transmission map suggests that the greatest exposure of human populations to infected triatomine species occurs in Nuevo Leon, Tamaulipas, Sinaloa, Durango, Nayarit, Jalisco, Guanajuato, Michoacan, Oaxaca and Chiapas (Fig. 10). All human communities in nine states (of 32), Aguascalientes, Coahuila, Guanajuato, Hidalgo, Morelos, Nayarit, Querétaro, San Luis Potosi and Tlaxcala, are at risk for the potential vector-borne transmission of T. cruzi by at least one infected bug species (doi: 10.5061/dryad.rq120).
Fig. 10: Trypanosoma cruzi vector transmission map for Mexico. Insert map represents all data points used in modelling. Colours green to red represent increasing number of ecological niche model best subsets.
DISCUSSION
Species distributions of triatomines have been modelled previously in several Mexican states: Guanajuato (López-Cárdenas et al. 2005), Puebla (Sandoval-Ruiz et al. 2008), Veracruz (Sandoval-Ruiz et al. 2012), Aguascalientes, Chiapas, Guerrero, Jalisco, Michoacan and Oaxaca (Benítez-Alva et al. 2012). However, most of these studies did not use representative occurrence datasets covering the complete range of the species modelled or they failed to specify background areas to calibrate their models, resulting in calibration bias (Owens et al. 2013). The present study separately modelled the 19 most abundant and epidemiologically relevant triatomine vector species in Mexico, providing individual species maps and exposure databases, which can be used by Mexico’s PHS vector prevention and control program to stratify T. cruzi transmission. These maps and demographic exposure predictions reflect the potential geographic distributions for all epidemiologically relevant species and their interactions with T. cruzi and can be used to stratify vector transmission interventions if the political will exists and normative guidelines are followed.
Mexico is located in both the Neotropical and Nearctic regions, which have different topography, vegetation, climates and demography as well as high heterogeneity and landscape types (Olson et al. 2001, Morrone 2005, Rzedowski 2006). We noted significant differences in distribution potential among species occurring in different biogeographic regions, with species in the semiarid and arid Nearctic Region having the broadest distributions. However, species richness was highest in the Neotropical Region, which has greater topographic complexity, particularly along the Pacific Coast. It is interesting that the broadest potential vector distributions in the Nearctic Region coincided with the higher conserved/modified land cover index values, probably owing to vast areas of arid vegetation with low population density, as evidenced by the inverse association with the rural/urban population index. Recent studies on triatomines from the Nearctic Region of Mexico report the domestication of vector species such as T. rubida and T. protracta in urban areas, which was almost unheard of two decades ago (Pfeiller et al. 2006).
It is clear that the geographic ranges of three principal triatomine species, T. longipennis, T. mexicana and T. barberi occur at higher elevation and expose more rural and urban communities to T. cruzi, even though the rural/urban population index in this region is the lowest. For these three species and for the most important species from the Neotropical 2 region, these data suggest that the vectors have tolerated landscape modification and urban development and are not limited to rural populations. More than 75% of the Mexican population now resides in urban communities. This urbanisation process, along with strong cultural ties to ancestral communities, may provide mechanisms for continuous human-assisted vector dispersal. Most Mexican vectors have tolerated landscape modification and as true opportunists, take advantage of alternative resources and refuges to maintain populations in human-modified habitats. Because the PHS vector-borne disease program in Mexico is currently almost singularly focused on dengue, which is principally urban, a Chagas disease prevention and control program, if it were to become effective in Mexico, may not need to shift current personnel or their work areas. However, this strategy may broaden the gap between urban and rural PHS coverage, thereby increasing current inequities in health services access in dispersed and marginalised rural areas where investment in prevention and control is minimal and will be far more costly to maintain.
The present analysis provides an atlas of the current knowledge regarding potential distributions and hence the potential exposure of human populations to T. cruzi-infected vectors in Mexico. This information can be used to engage communities regarding Chagas disease and to analyse social, cultural and economic vulnerability components that contribute to vector transmission risk. We have related triatomine distribution patterns to the most recent demographic census in Mexico to provide Chagas state program coordinators with a blueprint with which to stratify, study and plan future activities. Stratification should be conducted based on vector capacity, domesticity and the degree of habitat modification. Current models can be improved via a concerted effort to generate distribution and abundance information in communities and in conserved areas. Although information regarding wildlife reservoirs of T. cruzi is increasing and will assist in understanding the ecology of T. cruzi vector-borne transmission, the current information void (for the Mexican population and professionals in PHS) regarding the vectors and the parasite is the primary impediment to understanding vector transmission risk.
The Chagas disease transmission map developed herein was adjusted to reflect the current infected vector distributions and hence is immediately applicable to the unaddressed T. cruzi vector transmission problem in Mexico. Few areas in Mexico do not have the potential for vector transmission exposure and vectors have already demonstrated the capacity to persist in human-modified habitats and communities, which in most Nearctic and Neotropical regions provide the greatest year-round resources. If this exposure hazard continues and human vulnerability remains unabated, the risk for vector transmission in Mexico will continue to rise, affecting economic development and broadening the social inequities already affecting most of the population in both rural and urban areas (Ramsey et al. 2014). This study has developed immediately usable products for the PHS to study, plan and intervene against the vector-mediated transmission of T. cruzi. How many more Mexicans must become infected before health agencies abide by their legal mandate to prevent, control and turn their attention to Chagas disease in the country?
Funding Statement
Financial support: TDR (A50674), CONACYT/FONSEC (69997, 161405) (to JMR) CNI-C and OC-C were supported by PhD and MsD scholarships, respectively, from the CONACYT, ATP was supported by University of Kansas (RIC).
Footnotes
Financial support: TDR (A50674), CONACYT/FONSEC (69997, 161405) (to JMR) CNI-C and OC-C were supported by PhD and MsD scholarships, respectively, from the CONACYT, ATP was supported by University of Kansas (RIC).
REFERENCES
- Anderson RP, Lew D, Peterson AT. Evaluating predictive models of species’ distributions: criteria for selecting optimal models. Ecol Model. 2003;162:211–232. [Google Scholar]
- Barve N, Barve V, Jiménez-Valverde A, Lira-Noriega A, Maher SP, Peterson AT, Soberón J, Villalobos F. The crucial role of the accessible area in ecological niche modeling and species distribution modeling. Ecol Model. 2012;222:1810–1819. [Google Scholar]
- Batista TA, Gurgel-Gonçalves R. Ecological niche modelling and differentiation between Rhodnius neglectus Lent, 1954 and Rhodnius nasutus Stål, 1859 (Hemiptera: Reduviidae: Triatominae) in Brazil. Mem Inst Oswaldo Cruz. 2009;104:1165–1170. doi: 10.1590/s0074-02762009000800014. [DOI] [PubMed] [Google Scholar]
- Beard CB, Pye G, Steurer FJ, Rodriguez R, Campman R, Peterson AT, Ramsey J, Wirtz RA, Robinson LE. Chagas disease in a domestic transmission cycle, southern Texas, USA. Emerg Infect Dis. 2003;9:103–105. doi: 10.3201/eid0901.020217. [DOI] [PMC free article] [PubMed] [Google Scholar]
- Becerril-Flores MA, Rangel-Flores E, Imbert-Palafox JL, Gómez-Gómez JV, Figueroa-Gutiérrez AH. Human infection and risk of transmission of Chagas disease in Hidalgo state, Mexico. Am J Trop Med Hyg. 2007;76:318–323. [PubMed] [Google Scholar]
- Benítez-Alva JI, Huerta H, Téllez-Rendón JL. Distribución de triatominos (Heteroptera: Reduviidae) asociados a la vivienda humana y posibles zonas de riesgo en seis estados de la República Mexicana. BIOCYT. 2012;5:327–340. [Google Scholar]
- Cohen JM, Wilson ML, Cruz-Celis A, Ordoñez R, Ramsey JM. Infestation by Triatoma pallidipennis (Hemiptera: Reduviidae: Triatominae) is associated with housing characteristics in rural Mexico. J Med Entomol. 2006;43:1252–1260. doi: 10.1603/0022-2585(2006)43[1252:ibtphr]2.0.co;2. [DOI] [PubMed] [Google Scholar]
- Costa J, Peterson AT. Ecological niche modeling as a tool for understanding distributions and interactions of vectors, hosts and etiologic agents of Chagas disease. In: Mylonakis E, Ausubel FM, Gilmore M, Casadevall A, eds, editors. Recent advances on model hosts, advances in experimental medicine and biology. Springer New York; New York: 2012. pp. 59–70. [DOI] [PubMed] [Google Scholar]
- Costa J, Peterson AT, Beard BC. Ecologic niche modeling and differentiation of populations of Triatoma brasiliensis Neiva, 1911, the most important Chagas disease vector in northeastern Brazil (Hemiptera, Reduviidae, Triatominae) Am J Trop Med Hyg. 2002;67:516–520. doi: 10.4269/ajtmh.2002.67.516. [DOI] [PubMed] [Google Scholar]
- Coura JR, Dias JCP. Epidemiology, control and surveillance of Chagas disease - 100 years after its discovery. Mem Inst Oswaldo Cruz. 2009;104(Suppl. I):31–40. doi: 10.1590/s0074-02762009000900006. [DOI] [PubMed] [Google Scholar]
- Dias JCP. Southern Cone Initiative for the elimination of domestic populations of Triatoma infestans and the interruption of transfusional Chagas disease. Historical aspects, present situation and perspectives. Mem Inst Oswaldo Cruz. 2007;102(Suppl. I):11–18. doi: 10.1590/s0074-02762007005000092. [DOI] [PubMed] [Google Scholar]
- Galvão C, Carcavallo R, Silva D da, Jurgerg J. A checklist of the current valid species of the subfamily Triatominae Jeannel, 1919 (Hemiptera: Reduviidae) and their geographical distribution with nomenclatural and taxonomic notes. Zootaxa. 2003;202:1–36. [Google Scholar]
- Gascon J, Bern C, Pinazo MJ. Chagas disease in Spain, the United States and other non-endemic countries. Acta Trop. 2010;115:22–27. doi: 10.1016/j.actatropica.2009.07.019. [DOI] [PubMed] [Google Scholar]
- Gurgel-Gonçalves R, Galvão C, Costa J, Peterson AT. Geographic distribution of Chagas disease vectors in Brazil based on ecological niche modeling. J Trop Med. 20122012 doi: 10.1155/2012/705326. [DOI] [PMC free article] [PubMed] [Google Scholar]
- Guzmán C, García L, Verdugo J, Guerrero S, Torres M, Ramirez C, Velasco O. Riesgo de la transmissión de Trypanosoma cruzi por transfusión de sangre en México. Rev Panam Salud Publica. 1998;4:94–99. doi: 10.1590/s1020-49891998000800004. [DOI] [PubMed] [Google Scholar]
- Hashimoto K, Schofield CJ. Elimination of Rhodnius prolixus in Central America. 45Parasit Vectors. 2012;5 doi: 10.1186/1756-3305-5-45. [DOI] [PMC free article] [PubMed] [Google Scholar]
- Hotez PJ, Bottazii ME, Franco-Paredes C, Ault SK, Periago MR. The neglected tropical diseases of Latin America and the Caribbean: a review of disease burden and distribution and roadmap for control and elimination. PLoS Negl Trop Dis. 2008;2: doi: 10.1371/journal.pntd.0000300. [DOI] [PMC free article] [PubMed] [Google Scholar]
- Hotez PJ, Dumontiel E, Woc-Colburn L, Serpa JA, Bezek S, Edwards MS, Hallmark CJ, Musselwhite LW, Flink BJ, Bottazzi ME. Chagas disease: the new HIV/AIDS of the Americas. PLoS Negl Trop Dis. 2012;6: doi: 10.1371/journal.pntd.0001498. [DOI] [PMC free article] [PubMed] [Google Scholar]
- Ibarra-Cerdeña CN, Sánchez-Cordero V, Peterson AT, Ramsey JM. Ecology of North American Triatominae. Acta Trop. 2009;110:178–186. doi: 10.1016/j.actatropica.2008.11.012. [DOI] [PubMed] [Google Scholar]
- Ibarra-Cerdeña CN, Zaldívar-Riverón A, Peterson TA, Sánchez-Cordero V, Ramsey JM. Phylogeny and niche conservatism in North and Central American triatomine bugs (Hemiptera: Reduviidae: Triatominae), vectors of Chagas disease. PLoS Negl Trop Dis. 2014;8: doi: 10.1371/journal.pntd.0003266. [DOI] [PMC free article] [PubMed] [Google Scholar]
- Justi SA, Russo CAM, Santos-Mallet JR, Obara MT, Galvão C. Molecular phylogeny of Triatomini (Hemiptera: Reduviidae: Triatominae) 149Parasit Vectors. 2014;7 doi: 10.1186/1756-3305-7-149. [DOI] [PMC free article] [PubMed] [Google Scholar]
- Kjos SA, Snowden KF, Olson JK. Biogeography and Trypanosoma cruzi infection prevalence of Chagas disease vector in Texas, USA. Vector Borne Zoonotic Dis. 2009;9:41–50. doi: 10.1089/vbz.2008.0026. [DOI] [PubMed] [Google Scholar]
- Lash RR, Carroll DS, Hughes CM, Nakazawa Y, Karem K, Damon IK, Peterson AT. Effects of georeferencing effort on mapping monkeypox case distributions and transmission risk. 23Int J Health Geogr. 2012;11 doi: 10.1186/1476-072X-11-23. [DOI] [PMC free article] [PubMed] [Google Scholar]
- Lee BT, Bacon KM, Bottazzi ME, Hotez PJ. Global economic burden of Chagas disease: a computational simulation model. Lancet Infect Dis. 2013;13:342–348. doi: 10.1016/S1473-3099(13)70002-1. [DOI] [PMC free article] [PubMed] [Google Scholar]
- Lent H, Wygodzinsky P. Revision of the Triatominae (Hemiptera, Reduviidae) and their significance as vectors of Chagas disease. B Am Mus Nat Hist. 1979;163:123–520. [Google Scholar]
- López-Cárdenas J, Bravo FEG, Schettino PMS, Solorzano JCG, Barba ER, Méndez JM, Sánchez-Cordero V, Peterson AT, Ramsey JM. Fine-scale predictions of distributions of Chagas disease vector in the state of Guanajuato, Mexico. J Med Entomol. 2005;42:1068–1081. doi: 10.1093/jmedent/42.6.1068. [DOI] [PubMed] [Google Scholar]
- Magallón E, Lozano F, Flores A, Bosseno MF, Brenière SF. Sylvatic Triatominae of the phyllosoma complex (Hemiptera: Reduviidae) around the community of Carrillo Puerto, Nayarit, Mexico. J Med Entomol. 2001;38:638–640. doi: 10.1603/0022-2585-38.5.638. [DOI] [PubMed] [Google Scholar]
- Manne JM, Snively CS, Ramsey JM, Salgado MO, Barnighausen T, Reich MR. Barriers to treatment access for Chagas disease in Mexico. PLoS Negl Trop Dis. 2013;7: doi: 10.1371/journal.pntd.0002488. [DOI] [PMC free article] [PubMed] [Google Scholar]
- Manne-Goehler J, Ramsey J, Salgado MO, Wirtz VJ, Reich MR. Short report: increasing access to treatment for Chagas disease: the case of Morelos, Mexico. Am J Trop Med Hyg. 2014;91:1125–1127. doi: 10.4269/ajtmh.14-0357. [DOI] [PMC free article] [PubMed] [Google Scholar]
- Martínez A, Carcavallo RU, Jurberg J. Triatoma gomeznunezi, a new species of Triatomini from México (Hemiptera, Reduviidae, Triatominae) Entomología y Vectores. 1994;1:15–19. [Google Scholar]
- Martínez-Ibarra JA, Martínez-Grant JA, Verdugo-Cervantes MR, Bustos-Saldaña R, Nogueda-Torres B. Monitoring triatomid bug (Hemiptera: Reduviidae) presence by sentinel chicken coops in southern, Jalisco state, Mexico. Biomedica. 2010;30:140–145. [PubMed] [Google Scholar]
- Medina-Torres I, Vasquez-Chagoyan JC, Rodríguez-Vivas RI, Oca-Jímenez RM de. Risk factors associated with triatomines and its infection with Trypanosoma cruzi in rural communities from the southern region of the state of Mexico, Mexico. Am J Trop Med Hyg. 2010;82:49–54. doi: 10.4269/ajtmh.2010.08-0624. [DOI] [PMC free article] [PubMed] [Google Scholar]
- Moo-Llanes D, Ibarra-Cerdeña CN, Rebollar-Téllez EA, Ibáñez-Bernal S, González C, Ramsey JM. Current and future niche of North and Central American sand flies (Diptera: Psychodidae) in climate change scenarios. PLoS Negl Trop Dis. 2013;7: doi: 10.1371/journal.pntd.0002421. [DOI] [PMC free article] [PubMed] [Google Scholar]
- Morrone JJ. Hacia una síntesis biogeográfica de México. Rev Mex Biodiv. 2005;76:207–252. [Google Scholar]
- Novelo-Garza BA, Benitez-Arvizu G, Peña-Benitez A, Galvan-Cervantes J, Morales-Rojas A. Detección de Trypanosoma cruzi en donadores de sangre. Rev Med Inst Mex Seguro Soc. 2010;48:139–144. [PubMed] [Google Scholar]
- Olson DM, Dinerstein E, Wikramanayake ED, Burgess ND, Powell GVN, Underwood EC, D’amico JA, Itoua I, Strand HE, Morrison JC, Loucks CJ, Allnutt TF, Ricketts TH, Kura Y, Lamoreux JF, Wettengel WW, Hedao P, Kassem KR. Terrestrial ecoregions of the world: a new map of life on Earth. Bioscience. 2001;51:933–938. [Google Scholar]
- Owens HL, Campbell LP, Dornak LL, Saupe EE, Barve N, Soberón J, Ingenloff K, Lira-Noriega A, Hensz CM, Myers CE, Peterson AT. Constraints on interpretation of ecological niche models by limited environmental ranges on calibration areas. Ecol Model. 2013;263:10–18. [Google Scholar]
- Peterson AT. Ecologic niche modeling and spatial patterns of disease transmission. Emerg Infect Dis. 2006;12:1822–1826. doi: 10.3201/eid1212.060373. [DOI] [PMC free article] [PubMed] [Google Scholar]
- Peterson AT, Martínez-Campos C, Nakazawa Y, Martínez-Meyer E. Time-specific ecological niche modeling predicts spatial dynamics of vector insects and human dengue cases. Trans R Soc Trop Med Hyg. 2005;99:647–655. doi: 10.1016/j.trstmh.2005.02.004. [DOI] [PubMed] [Google Scholar]
- Peterson AT, Sánchez-Cordero V, Beard CB, Ramsey JM. Ecologic niche modeling and potential reservoirs for Chagas disease, Mexico. Emerg Infect Dis. 2002;8:662–667. doi: 10.3201/eid0807.010454. [DOI] [PMC free article] [PubMed] [Google Scholar]
- Peterson AT, Soberón J, Pearson RG, Anderson RP, Martínez-Meyer E, Nakamura M, Araújo MB. Ecological niches and geographic distributions. Princeton University Press; Princeton: 2011. 314 [Google Scholar]
- Pfeiller E, Bitler BG, Ramsey JM, Palacios-Cardiel C, Markow TA. Genetic variation, population structure and phylogenetic relationships of Triatoma rubida and T. recurva (Hemiptera: Reduvidae: Triatominae) from the Sonoran desert, insect vectors of the Chagas disease parasite Trypanosoma cruzi. Mol Phylogenet Evol. 2006;41:209–221. doi: 10.1016/j.ympev.2006.07.001. [DOI] [PubMed] [Google Scholar]
- Ramsey JM, Elizondo-Cano M, Sanchez-González G, Peña-Nieves A, Figueroa-Lara A. Opportunity cost for early treatment of Chagas disease in Mexico. PLoS Negl Trop Dis. 2014;8: doi: 10.1371/journal.pntd.0002776. [DOI] [PMC free article] [PubMed] [Google Scholar]
- Ramsey JM, Gutierrez-Cabrera AE, Salgado-Ramírez K, Peterson AT, Sánchez-Cordero V, Ibarra-Cerdeña CN. Ecological connectivity of Trypanosoma cruzi reservoirs and Triatoma pallidipennis host in an anthropogenic landscape with endemic Chagas disease. PLoS ONE. 2012;7: doi: 10.1371/journal.pone.0046013. [DOI] [PMC free article] [PubMed] [Google Scholar]
- Ramsey JM, Ordoñez R, Lopez AT, Pohls JL, Sánchez V, Peterson AT. Actualidades sobre la epidemiología de la enfermedad de Chagas en México. In: Ramsey JM, López AT, Pohls JL, eds, editors. Iniciativa para la vigilancia y control de la enfermedad de Chagas en la República Mexicana. Instituto Nacional de Salud Pública, Cuernavaca Morelos; 2003. pp. 85–103. [Google Scholar]
- Ramsey JM, Schofield CJ. Control of Chagas disease vectors. Salud Pública Méx. 2003;45:123–128. doi: 10.1590/s0036-36342003000200010. [DOI] [PubMed] [Google Scholar]
- Remme JHF, Feenstra P, Lever PR, Medici AC, Morel CM, Noma M, Ramaiah KD, Richards F, Seketeli A, Schmunis G, van Brakel WH, Vassall A. Tropical diseases targeted for elimination: Chagas disease, lymphatic filariasis, onchocerciasis and leprosy. In: Jamison DT, Breman JG, Measham AR, Alleyene G, Claeson M, Evans DB, Jha P, Mills A, Musgrove P, eds., editors. Disease control priorities in developing countries. 2nd ed. World Bank; Washington DC: 2006. pp. 433–449. [Google Scholar]
- Ryckman RE. Biosystematics and host of the Triatoma protracta complex in North America (Hemiptera: Reduviidae) (Rodentia: Cricetidae) Univ California Publ Entomol. 1962;27:93–240. [Google Scholar]
- Rzedowski J. Vegetación de México. Comisión Nacional para el Conocimiento y Uso de la Biodiversidad. 1st digital ed. México: 2006. 504 [Google Scholar]
- Sandoval-Ruiz CA, Cervantes-Peredo L, Mendoza-Palmero FS, Ibáñez-Bernal S. The Triatominae (Hemiptera: Heteroptera: Reduviidae) of Veracruz, Mexico: geographic distribution, taxonomic redescriptions and a key. Zootaxa. 2012;3487:1–23. [Google Scholar]
- Sandoval-Ruiz CA, Zumaquero-Rios JL, Rojas-Soto OR. Predicting geographic and ecological distributions of triatomine species in the southern Mexican state of Puebla using ecological niche modeling. J Med Entomol. 2008;45:540–546. doi: 10.1603/0022-2585(2008)45[540:pgaedo]2.0.co;2. [DOI] [PubMed] [Google Scholar]
- SEMARNAT-NFI - Secretaría de Medio Ambiente y Recursos Naturales - National Forestry Inventory National Forestry Inventory 2004-2009. 2007. semarnat.gob.mx.
- Soberón J, Peterson AT. Interpretation of models of fundamental ecological niches and species’ distributional areas. Biodiv Inform. 2005;2:1–10. [Google Scholar]
- Soberón J, Peterson TA. Biodiversity informatics: managing and applying primary biodiversity data. Philos Trans R Soc Lond B Biol Sci. 2004;359:689–698. doi: 10.1098/rstb.2003.1439. [DOI] [PMC free article] [PubMed] [Google Scholar]
- Soberón JM. Grinenellian and Eltonian niches and geographic distributions of species. Ecol Lett. 2007;10:1115–1123. doi: 10.1111/j.1461-0248.2007.01107.x. [DOI] [PubMed] [Google Scholar]
- Stevens L, Monroy MC, Rodas AG, Dorn PL. Hunting, swimming and worshiping: human cultural practices illuminate the blood meal sources of cave dwelling Chagas vectors (Triatoma dimidiata) in Guatemala and Belize. PLoS Negl Trop Dis. 2014;8: doi: 10.1371/journal.pntd.0003047. [DOI] [PMC free article] [PubMed] [Google Scholar]
- Stockwell D, Peters D. The GARP modelling systems: problems and solutions to automated spatial prediction. Int J Geogr Inf Sci. 1999;13:143–158. [Google Scholar]
- Tarleton RL, Gürtler RE, Urbina JA, Ramsey J, Viotti R. Chagas disease and the London declaration on neglected tropical diseases. PLoS Negl Trop Dis. 2014;8: doi: 10.1371/journal.pntd.0003219. [DOI] [PMC free article] [PubMed] [Google Scholar]
- Tay J, Schenone H, Sánchez JT, Robert L. Estado actual de los conocimientos sobre la enfermedad de Chagas en la República Mexicana. Biol Chil Parasitol. 1992;47:43–53. [PubMed] [Google Scholar]
- Torres-Montero J, López-Monteon A, Dumontiel E, Ramos-Ligonio A. House infestation dynamics and feeding sources of Triatoma dimidiata in central Veracruz, Mexico. Am J Trop Med Hyg. 2012;86:677–682. doi: 10.4269/ajtmh.2012.11-0746. [DOI] [PMC free article] [PubMed] [Google Scholar]
- Velasco-Castrejon O, Valdespino JL, Tapia R, Salvatierra B, Guzmán C, Magos C, Llausás A, Gutiérrez G, Sepúlveda J. Seroepidemiologia de la enfermedad de Chagas en México. Salud Pública Méx. 1992;34:186–196. [PubMed] [Google Scholar]
- Vidal AV, Ibañez-Bernal S, Martínez-Campos C. Infección natural de chinches Triatominae con Trypanosoma cruzi asociadas a la vivienda humana en México. Salud Pública Méx. 2000;42:496–503. [PubMed] [Google Scholar]
- Zárate LG, Zárate RJ. A checklist of the Triatominae (Hemiptera: Reduviidae) of Mexico. Int J Entomol. 1985;27:102–127. [Google Scholar]


