Abstract
Purpose
To determine a comprehensive method for the implementation of adaptive statistical iterative reconstruction (ASIR) for maximal radiation dose reduction in pediatric computed tomography (CT) without changing the magnitude of noise in the reconstructed image or the contrast-to-noise ratio (CNR) in the patient.
Materials and Methods
The institutional review board waived the need to obtain informed consent for this HIPAA-compliant quality analysis. Chest and abdominopelvic CT images obtained before ASIR implementation (183 patient examinations; mean patient age, 8.8 years ± 6.2 [standard deviation]; range, 1 month to 27 years) were analyzed for image noise and CNR. These measurements were used in conjunction with noise models derived from anthropomorphic phantoms to establish new beam current–modulated CT parameters to implement 40% ASIR at 120 and 100 kVp without changing noise texture or magnitude. Image noise was assessed in images obtained after ASIR implementation (492 patient examinations; mean patient age, 7.6 years ± 5.4; range, 2 months to 28 years) the same way it was assessed in the pre-ASIR analysis. Dose reduction was determined by comparing size-specific dose estimates in the pre- and post-ASIR patient cohorts. Data were analyzed with paired t tests.
Results
With 40% ASIR implementation, the average relative dose reduction for chest CT was 39% (2.7/4.4 mGy), with a maximum reduction of 72% (5.3/18.8 mGy). The average relative dose reduction for abdominopelvic CT was 29% (4.8/6.8 mGy), with a maximum reduction of 64% (7.6/20.9 mGy). Beam current modulation was unnecessary for patients weighing 40 kg or less. The difference between 0% and 40% ASIR noise magnitude was less than 1 HU, with statistically nonsignificant increases in patient CNR at 100 kVp of 8% (15.3/14.2; P = .41) for chest CT and 13% (7.8/6.8; P = .40) for abdominopelvic CT.
Conclusion
Radiation dose reduction at pediatric CT was achieved when 40% ASIR was implemented as a dose reduction tool only; no net change to the magnitude of noise in the reconstructed image or the patient CNR occurred.
© RSNA, 2013
Introduction
Reducing radiation dose for pediatric patients undergoing computed tomography (CT) examinations is a matter of great concern owing to the heightened sensitivity to radiation in the pediatric population and the longer life expectancy of pediatric patients, with the potential of greater cancer risk. The greatest limitation to substantial dose reduction for pediatric CT is the degradation of image quality because of lowered radiation output—that is, increased image noise. Known image quality constraints in pediatric imaging are the smaller physical size and the minimal inherent contrast in the patients. Low- and high-contrast resolution can easily be compromised in pediatric CT because of substantial noise mottle. Since the late 1990s, dose reduction in CT has principally been driven by optimizing beam current levels for radiation delivery through innovations such as beam current modulation, but beam current can only be lowered so much without negatively impacting diagnostic quality (1).
Around 2009, an adaptive statistical iterative reconstruction (ASIR) technique was made available to reduce the noise content in reconstructed images. The ASIR algorithm primarily improves noise content in a reconstructed image through modeling fluctuations in projection data due to photon statistics and electronic system noise. The modeled data are compared with the actual projection data, and the difference between these data sets allows adjustment of the image for a hybridization of filtered back projection (FBP) and ASIR (2,3).
By using the ASIR algorithm to improve image noise in a reconstructed image, ASIR can be used as a dose reduction tool by allowing more noise in an image, by decreasing radiation output, and then by cleaning up the noisy, dose-reduced image with the ASIR algorithm. Since 2009, efforts to utilize ASIR have yielded various levels of dose reduction and image quality improvement (noise reduction) for both pediatric (2,4,5) and adult (3,6–13) CT. In our previous study focusing on pediatric CT (2), we demonstrated how to maintain pre-ASIR (100% FBP) idealized image quality (noise magnitude and texture) by using ASIR for dose reduction only. This method stands in contrast to more common ASIR implementation approaches that realize some dose reduction and some improvement of noise in reconstructed CT images (3–5,8,9,11–13).
Our purpose in the present study was to determine a comprehensive method for the implementation of ASIR for maximal dose reduction in pediatric CT without changing the magnitude of noise in the reconstructed image or the contrast-to-noise ratio (CNR) in the patient.
Materials and Methods
This study was divided into the following three steps: (a) A noise and dose analysis in a patient population imaged before ASIR implementation (ie, with 100% FBP) with 120 kVp and consecutively accrued from February 2011 to May 2011; (b) implementation of the dose reduction strategy, with noise, CNR, and dose analysis, in a patient population imaged after ASIR implementation (40% ASIR blended with 60% FBP) with 120 kVp and consecutively accrued from June 2011 to May 2012; and (c) implementation of further dose reduction, along with noise, CNR, and dose analysis, in a selected population imaged by using 100 kVp and 40% ASIR and consecutively accrued from June 2012 to September 2012. Patient demographic data were recorded for each of the study’s three steps (Table 1).
Table 1.
Patient Demographic Data at Each of the Three Examinations

Note.—Unless otherwise specified, data are means ± standard deviations, with ranges in parentheses.
One hundred seventy-one examinations were performed in pediatric patients (age range, 1 month to 18 years), and 12 examinations were performed in adult patients (age range, 19–27 years).
Four hundred sixty-eight examinations were performed in pediatric patients (2 mo to 18 years), and 24 examinations were performed in adult patients (19–28 years).
All examinations were performed in pediatric patients.
Data in parentheses are percentages.
Patient Examinations
Our institutional review board deemed this study to be exempt from the need to obtain informed patient consent. All data were managed in compliance with the Health Insurance Portability and Accountability Act. All patient examinations analyzed in this study were performed with a Lightspeed VCT-XTe CT scanner (GE Healthcare, Waukesha, Wis). CT protocols were selected on the basis of each patient’s weight, which was obtained immediately prior to his or her CT examination, according to GE Healthcare’s Color Coding for Kids weight categories. Over the course of this study (February 2011 through September 2012), some patients may have undergone multiple CT examinations as part of their treatment regimen. However, because of the constant fluctuation of weight in pediatric patients, subsequent CT examinations were often performed by using different weight categories and therefore possibly different scanning parameters (eg, tube voltage, tube current–time product, bowtie filter, section thickness). Because of the intrapatient variation in scanning parameters, each chest and abdominopelvic examination per patient weight (at the time of the CT examination) was anonymized and analyzed separately. The numbers of 0% and 40% ASIR patient examinations analyzed per CT weight category are listed for chest studies (Table 2) and for abdominopelvic studies (Table 3).
Table 2.
Patient-specific Weight and Image Noise Comparisons for Chest CT with and That without 40% ASIR at 120 kVp
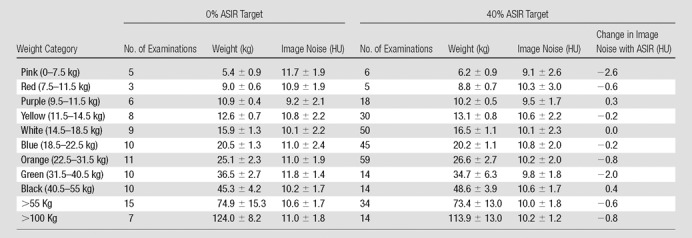
Note.—Unless otherwise specified, data are means ± standard deviations. The color descriptors refer to GE Healthcare’s Color Coding for Kids weight categories. The mean overall change in image noise with implementation of ASIR was –0.6.
Table 3.
Patient-specific Weight and Image Noise Comparisons for Abdominopelvic CT with and That without 40% ASIR at 120 kVp
Note.—Unless otherwise specified, data are means ± standard deviations. The color descriptors refer to GE Healthcare’s Color Coding for Kids weight categories. The mean overall change in image noise with implementation of ASIR was –0.7.
Although the majority of examinations were performed in patients in the pediatric age range, we also studied some patient examinations in young adults (up to age 28 years) who were being followed up for pediatric tumors (Table 1). Separate noise indexes (NIs)—NI on a GE Healthcare CT scanner is a user-selectable parameter that affects the level of image noise in reconstructed images using beam current modulation (14)—were established for chest and abdominopelvic imaging and varied depending on weight category. Prior to ASIR implementation, the NIs for chest CT and abdominopelvic CT, respectively, were 12.35 and 9.88 for patients who weighed between 0 and 11.5 kg and 11.57 and 9.83 for patients who weighed between 11.5 and more than 100 kg; at that time, all patients were imaged at 120 kVp. After ASIR implementation, the tube voltage in scanning protocols for patients weighing between 6.0 and 31.5 kg was ultimately changed to 100 kVp; all other patients weighing more than 32.5 kg were still imaged at 120 kVp. Scanning protocols for both the chest and the abdominopelvic regions were performed with 3.75-mm reconstructed images in patients between 6.0 and 9.5 kg, whereas all patients weighing more than 9.5 kg were imaged at 5 mm. In this study, there was no attempt to differentiate between studies performed with contrast material and those performed without. The majority of patients received intravenous contrast material. Contrast material was omitted in only 35 examinations: one abdominopelvic study and 11 chest studies (12 [7%] of 183) before ASIR implementation and two abdominopelvic and 21 chest studies (23 [5%] of 492) after ASIR implementation.
Establishing New Scanning Parameters from Pre-ASIR Noise and CNR Measurements
To establish new scanning parameters for imaging at 120 kVp with 40% ASIR and images reconstructed at similar noise levels to the preimplementation patient images, noise and NI data were extracted from previously published anthropomorphic phantom data at the 40% ASIR level (2). Four anthropomorphic phantoms, representing average 1-, 5-, and 10-year-old patients and an adult female (considered for this study to be a 15-year-old patient) (ATOM phantom; CIRS, Norfolk, Va) were used to generate the phantom-based model data. The weight-based patient noise analysis data were matched to the four phantoms for which their size and weight correlated with the patient scanning protocols being corrected, namely: Data in the population of patients weighing between 0 and 14.5 kg were matched to the phantom that represented a 1-year-old, data in the population of patients weighing 14.5–31.5 kg were matched to the phantom that represented a 5-year-old, data in the population of patients weighing 31.5–55.5 kg were matched to the phantom that represented a 10-year-old, and data in patients weighing more than 55 kg were matched to the phantom that represented an adult female. From those noise models, the data were interpolated to identify new NIs, using as input the measured noise values in patients at 0% ASIR. In conjunction with the new NIs, new minimum tube current criteria for the beam current modulation software were established to allow lower-tube-current imaging at the 40% ASIR level; the maximum tube current remained the same. After the new NIs and lower minimum tube current criteria for the beam current modulation software were determined and the appropriate patient scanning protocols were revised, the noise magnitude was analyzed prospectively in patients imaged with 40% ASIR for the chest and the abdomen and pelvis in a similar manner as it was analyzed in the 0% ASIR patient cohort.
To establish new parameters for imaging at 100 kVp with 40% ASIR, the anthropomorphic phantoms representing 1- and 5-year-olds (representing patients weighing in the 0–31.5 kg range) were used to model changes in CNR and noise magnitude. Phantom internal organ contrast was limited, so two material plugs, one of low contrast (mean contrast, approximately 5–10 HU), and one of high contrast (mean contrast, approximately 900 HU), were placed at approximately the levels of the aortic arch and the midliver in the phantom. The phantoms were imaged with fixed tube current in the chest and in the abdomen and pelvis.
The first step was to measure CNR (Fig E1 [online]) and noise (Fig E2 [online]) in the phantom images at 120 kVp to establish a baseline, and then, in the phantoms imaged with multiple 100-kVp acquisitions (three at a lower tube current and one at a higher tube current), to establish a range of image noise magnitudes (Fig E2 [online]). The volume CT dose index (CTDIvol) for each 100- and 120-kVp acquisition was recorded and converted to a size-specific dose estimate (SSDE) on the basis of American Association of Physicists in Medicine Report 204 (15). The CNR and noise data were plotted as a function of SSDE. Each phantom was imaged five times per exposure setting, and data were averaged per datum point.
The second step, dose reduction, was determined by holding CNR constant and extrapolating from 120 to 100 kVp (Fig E1 [online]). An increase in noise magnitude was expected for the 100 kVp images; the average increase in noise for patients weighing 0–31.5 kg was 9%. However, increased noise was compensated for by the increased contrast achieved by imaging at 100 kVp.
In the third step, the measured increase in noise was used to establish new beam current parameters by extrapolating from the original 120-kVp to the new 100-kVp acquisition protocols (Figs E2b, E2d [online]); beam current increased by 63%, 25%, and 33% for the 0–9.5-kg, 9.5–14.5-kg, and 14.5–31.5-kg patient weight protocols, respectively.
Scanning protocols with 100 kVp at 40% ASIR in patients weighing more than 31.5 kg were investigated, but the increase in contrast at 100 kVp did not compensate for the increased image noise; therefore, dose reduction was not deemed appropriate for these patient populations.
Patient Image Noise Analysis
ASIR most directly affects image noise; therefore, measurements of image noise and CNR were used as metrics for patient image quality. The patient noise magnitude was measured to ensure that post-ASIR implementation noise levels were similar to pre-ASIR levels. Similarly, patient CNR was calculated to ensure that ASIR implementation at 100 kVp was comparable in terms of CNR to ASIR implementation at 120 kVp. For noise and CNR analysis in the chest, circular regions of interest (ROIs) were placed within the aortic arch and in the surrounding chest wall musculature, and in the abdomen and pelvis, multiple ROIs were placed in the liver parenchyma at the level of the right portal vein and over the descending aorta (Fig E3 [online]). ROI placement was performed by S.L.B. and B.M.M. (an undergraduate physics student with 2 years of experience, supervised by S.L.B.). In general, the ROI size was established to be 100 mm2. ROIs smaller than 100 mm2 were adapted to fit within the aortic arch for small patients (ROI size range, 60–100 mm2).
Noise in the chest was assessed by evaluating the standard deviations of the ROIs placed in the aortic arch, and CNR was calculated on the basis of the absolute difference between the average CT number of the aortic arch and the average CT number of the surrounding muscle divided by the noise measurement. Noise in the abdomen and pelvis was assessed by evaluating the standard deviation of the ROIs in the liver parenchyma, and CNR was calculated on the basis of the absolute difference between the CT number of the descending aorta and that of the liver divided by the noise measurement. Noise and CNR were assessed for patients weighing up to 31.5 kg, and noise only was assessed for patients weighing more than 31.5 kg. The noise and CNR measurements were correlated according to patient weight.
Patient Dosimetry
To estimate relative radiation dose reduction to the patient from implementation of 40% ASIR at 120 kVp, archived patient CTDIvol values in the chest and the abdomen and pelvis from the patient populations imaged with 0% and 40% ASIR were converted to SSDEs according to the method described in our recent report (16). Patient anteroposterior (AP) and lateral (LAT) measurements were combined to calculate patient effective diameter (
 ) and to convert CTDIvol to SSDE. Patient-specific dimensions were obtained from the axial CT images at the level of the body where the noise ROIs were placed, which was a slight departure from the use of CT radiographs (scout views) reported previously (16). SSDEs were averaged per CT weight scan category for comparison with 0% and 40% ASIR patient populations.
Statistical Analysis
A test for significance was performed by using a two-sided paired Student t test with PRISM software (Graphpad Software, La Jolla, Calif) and was applied individually for pre- and post-ASIR chest and abdominopelvic CT examinations per CT weight scan category. Statistical significance was determined at the 95% confidence level (α = .05), and the null hypothesis for each question was determined to be no difference between testing variables. To apply the Student t test, the data were tested for normality and were found to be normal by using the Anderson-Darling test (P = .11 for CNR at 120 kVp and P = .07 for CNR at 100 kVp). Data analysis was performed by using Excel (version 2007; Microsoft, Redmond, Wash). All error bars in this study represent 1 standard deviation from the arithmetic mean of the data.
Results
Patient Image Noise Analysis
The 0% ASIR phantom noise models agreed with the measured patient noise data to better than 2% (10.7/10.9) for the chest and 5% (11.5/12.1) for the abdomen and pelvis (Fig 1). New NIs were determined for patients weighing 0–11.5 kg for the chest (noise, 10.6 HU; NI, 16.28) and the abdomen and pelvis (noise, 10.3 HU; NI, 13.13) and for patients weighing 11.5 to more than 100 kg for the chest (noise, 10.8 HU; NI, 15.50) and the abdomen and pelvis (noise, 12 HU; NI, 13.08). The average increase in NI was between 32% and 34% (eg, at chest CT for 6.0- to 11.5-kg patients: 16.28/12.35). The minimum beam current level for the system’s beam current modulation software was lowered by 20%–25% (for 6.0- to 7.5-kg patients: 48/60).
Figure 1a:
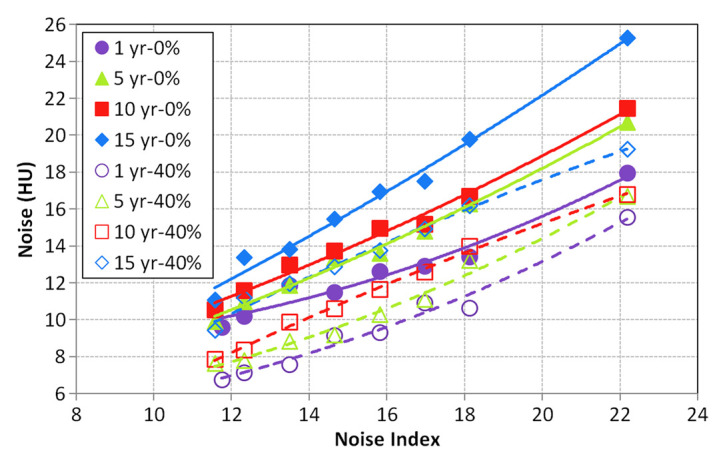
Graphs show noise in reconstructed images of anthropomorphic phantoms (1-, 5-, 10-, and 15-year-old size variations) as measured for (a) the chest and (b) the abdomen and pelvis before ASIR implementation (0% ASIR) and with 40% ASIR blended with FBP reconstruction.
Figure 1b:
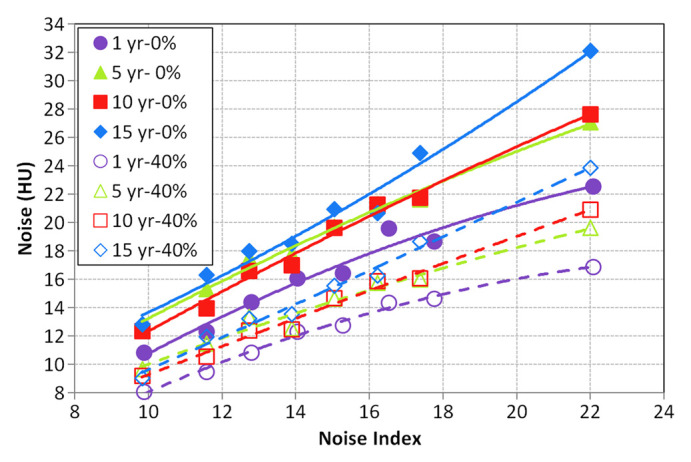
Graphs show noise in reconstructed images of anthropomorphic phantoms (1-, 5-, 10-, and 15-year-old size variations) as measured for (a) the chest and (b) the abdomen and pelvis before ASIR implementation (0% ASIR) and with 40% ASIR blended with FBP reconstruction.
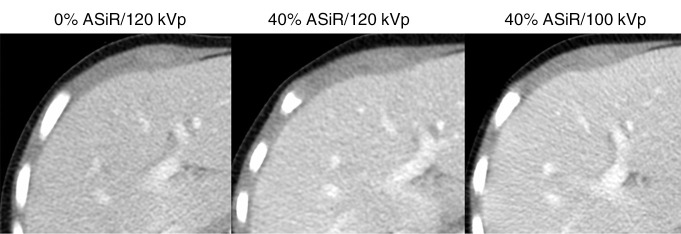
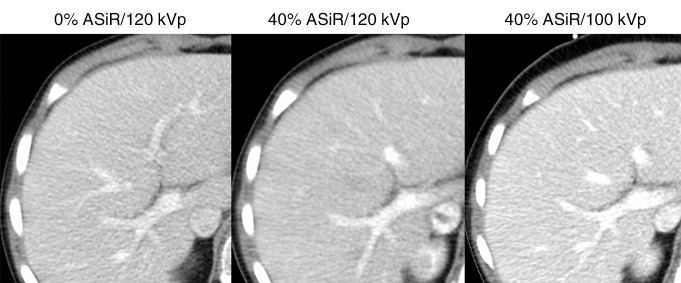
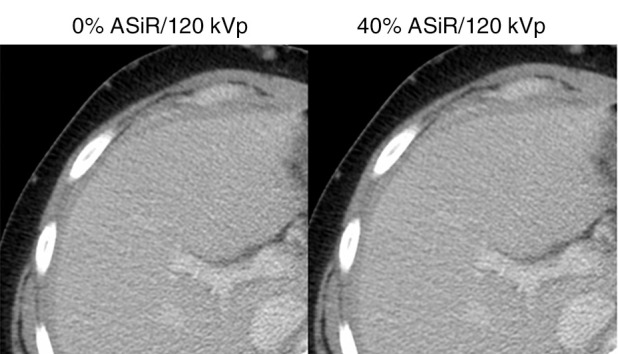
The measured noise magnitude in the 40% ASIR patient cohort deviated from the 0% ASIR patient cohort for the chest by an average of −0.6 HU (range, −2.6 to 0.4 HU) and for the abdomen and pelvis by an average of −0.7 HU (range, −2.1 to 0.1 HU), where a negative value indicates lower noise in the 40% ASIR measurement (Fig 2). Noise magnitude and texture were preserved in the 40% ASIR patient cohort (Fig 3).
Figure 2a:
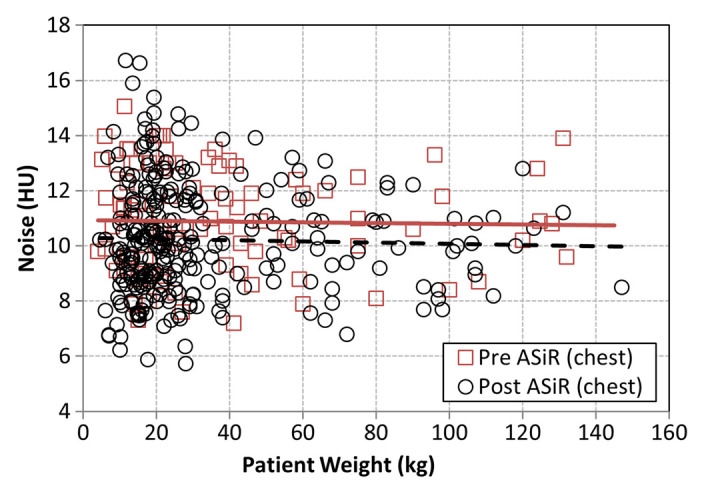
Graphs show image noise as measured in patient images reconstructed at 0% ASIR and at 40% ASIR for (a) the chest and (b) the abdomen and pelvis. Regression plots for pre-ASIR (dashed line) and post-ASIR (solid line) chest and abdominopelvic examinations are provided for comparison.
Figure 3a:
Transaxial CT scans in patients show visual image quality at different combinations of ASIR implementation and tube voltage. All images are presented with a window of 350 HU and a level of 40 HU. Each row of images represents images obtained in the same patient imaged at different stages of ASIR and tube voltage reduction implementation. (a) Scans in boy initially imaged on April 27, 2011 (weight, 16 kg; age, 3 years; noise, 13.1 HU; CNR, 13.0), before ASIR implementation, imaged later on May 23, 2012 (weight, 16 kg; age, 4 years; noise, 12.8 HU; CNR, 14.0), after ASIR was implemented, and imaged again on November 15, 2012 (weight, 20 kg; age, 5 years; noise, 13.6 HU; CNR, 14.1), after the implementation of ASIR with tube voltage reduction. (b) Scans in boy imaged on April 19, 2011 (weight, 22 kg; age, 7 years; noise, 13.9 HU; CNR, 12.5), on October 24, 2012 (weight, 22 kg; age, 8 years; noise, 13.8 HU; CNR, 15.5), and on January 14, 2013 (weight, 25 kg; age, 9 years; noise, 15.1 HU; CNR, 15.5). (c) Scans in young woman imaged on May 11, 2011 (weight, 61 kg; age, 21 years; noise, 16.5 HU; CNR, 11.1), and on June 9, 2011 (weight, 61 kg; age, 21 years; noise, 16.2 HU; CNR, 12.2). No images were acquired at 100 kVp for comparison because of her weight classification.
Figure 2b:
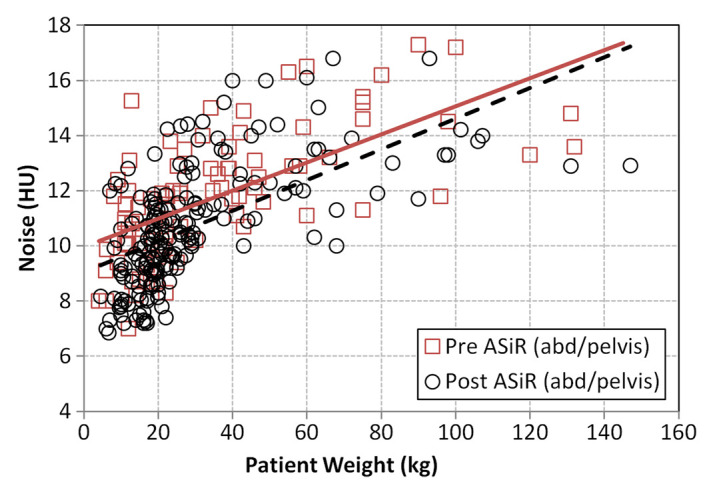
Graphs show image noise as measured in patient images reconstructed at 0% ASIR and at 40% ASIR for (a) the chest and (b) the abdomen and pelvis. Regression plots for pre-ASIR (dashed line) and post-ASIR (solid line) chest and abdominopelvic examinations are provided for comparison.
Figure 3b:
Transaxial CT scans in patients show visual image quality at different combinations of ASIR implementation and tube voltage. All images are presented with a window of 350 HU and a level of 40 HU. Each row of images represents images obtained in the same patient imaged at different stages of ASIR and tube voltage reduction implementation. (a) Scans in boy initially imaged on April 27, 2011 (weight, 16 kg; age, 3 years; noise, 13.1 HU; CNR, 13.0), before ASIR implementation, imaged later on May 23, 2012 (weight, 16 kg; age, 4 years; noise, 12.8 HU; CNR, 14.0), after ASIR was implemented, and imaged again on November 15, 2012 (weight, 20 kg; age, 5 years; noise, 13.6 HU; CNR, 14.1), after the implementation of ASIR with tube voltage reduction. (b) Scans in boy imaged on April 19, 2011 (weight, 22 kg; age, 7 years; noise, 13.9 HU; CNR, 12.5), on October 24, 2012 (weight, 22 kg; age, 8 years; noise, 13.8 HU; CNR, 15.5), and on January 14, 2013 (weight, 25 kg; age, 9 years; noise, 15.1 HU; CNR, 15.5). (c) Scans in young woman imaged on May 11, 2011 (weight, 61 kg; age, 21 years; noise, 16.5 HU; CNR, 11.1), and on June 9, 2011 (weight, 61 kg; age, 21 years; noise, 16.2 HU; CNR, 12.2). No images were acquired at 100 kVp for comparison because of her weight classification.
Figure 3c:
Transaxial CT scans in patients show visual image quality at different combinations of ASIR implementation and tube voltage. All images are presented with a window of 350 HU and a level of 40 HU. Each row of images represents images obtained in the same patient imaged at different stages of ASIR and tube voltage reduction implementation. (a) Scans in boy initially imaged on April 27, 2011 (weight, 16 kg; age, 3 years; noise, 13.1 HU; CNR, 13.0), before ASIR implementation, imaged later on May 23, 2012 (weight, 16 kg; age, 4 years; noise, 12.8 HU; CNR, 14.0), after ASIR was implemented, and imaged again on November 15, 2012 (weight, 20 kg; age, 5 years; noise, 13.6 HU; CNR, 14.1), after the implementation of ASIR with tube voltage reduction. (b) Scans in boy imaged on April 19, 2011 (weight, 22 kg; age, 7 years; noise, 13.9 HU; CNR, 12.5), on October 24, 2012 (weight, 22 kg; age, 8 years; noise, 13.8 HU; CNR, 15.5), and on January 14, 2013 (weight, 25 kg; age, 9 years; noise, 15.1 HU; CNR, 15.5). (c) Scans in young woman imaged on May 11, 2011 (weight, 61 kg; age, 21 years; noise, 16.5 HU; CNR, 11.1), and on June 9, 2011 (weight, 61 kg; age, 21 years; noise, 16.2 HU; CNR, 12.2). No images were acquired at 100 kVp for comparison because of her weight classification.
Patient Image CNR Analysis
Comparisons of patient CNR between CT protocols in 0–31.5-kg patients imaged at 100 kVp demonstrated an increase in CNR compared with imaging at 120 kVp by 8% (15.3/14.2) and 13% (7.8/6.8) for the chest and the abdomen and pelvis, respectively (Fig 4); however, neither the CNR in the chest (P = .41) nor the CNR in the abdomen and pelvis (P = .40) was found to be statistically different between 100- and 120-kVp images.
Figure 4a:
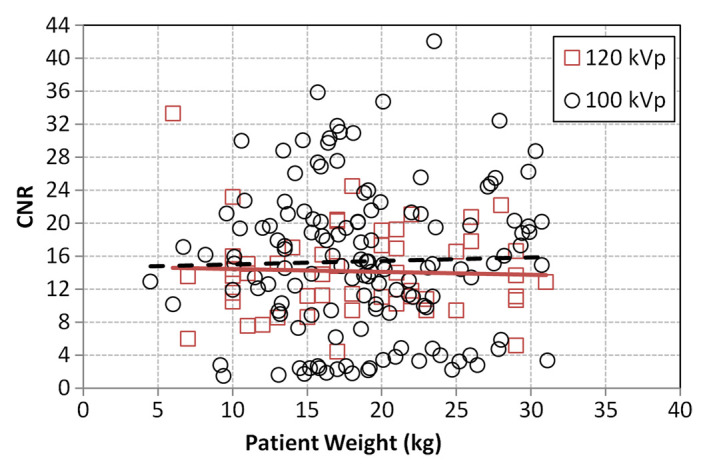
Graphs show measured patient CNRs at 40% ASIR implemented at 100 and 120 kVp for (a) the chest and (b) the abdomen and pelvis. Regression plots for 100 kVp (dashed line) and 120 kVp (solid line) are provided for comparison and demonstrate a nonstatistically significant improvement in CNR at 100 kVp for both body regions.
Figure 4b:
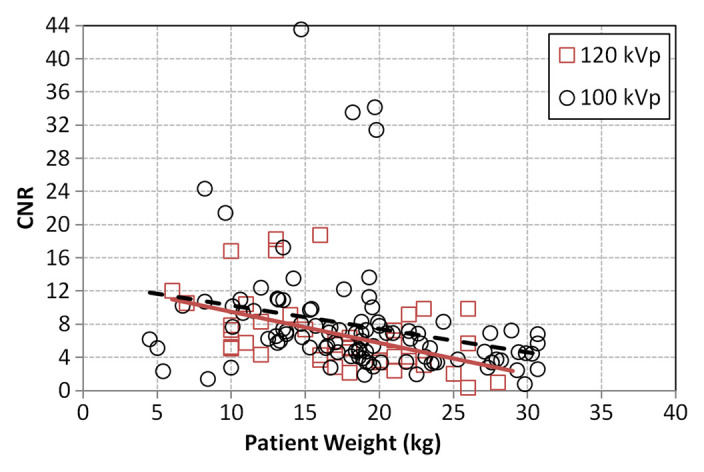
Graphs show measured patient CNRs at 40% ASIR implemented at 100 and 120 kVp for (a) the chest and (b) the abdomen and pelvis. Regression plots for 100 kVp (dashed line) and 120 kVp (solid line) are provided for comparison and demonstrate a nonstatistically significant improvement in CNR at 100 kVp for both body regions.
Patient Dosimetry
The patient effective diameters used to calculate SSDEs were similar between the pre-ASIR and post-ASIR patient cohorts; differences of 5 mm (range, 1–18 mm) for the chest and 1.7 mm (range, 0.2–15 mm) for the abdomen and pelvis were measured. For CT at 40% ASIR and 120 kVp, data showed that the average radiation dose decreased between 6% and 32% (19.9/21.2 and 4.0/5.9 mGy), with a maximum dose reduction of 72% (5.3/18.8 mGy), for chest CT (Fig 5a) and between 7% and 32% (26.6/28.5 to 5.8/8.5 mGy), with a maximum dose reduction of 64% (7.6/20.9 mGy), for abdominopelvic CT (Fig 5b). Additional dose reduction was realized with the decrease of tube potential to 100 kVp with 40% ASIR for patients weighing 0–31.5 kg. For chest CT, dose reduction increased by an average of 39% (2.7/4.4 mGy), and for abdominopelvic CT, dose reduction increased by an average of 29% (4.8/6.8 mGy).
Figure 5a:
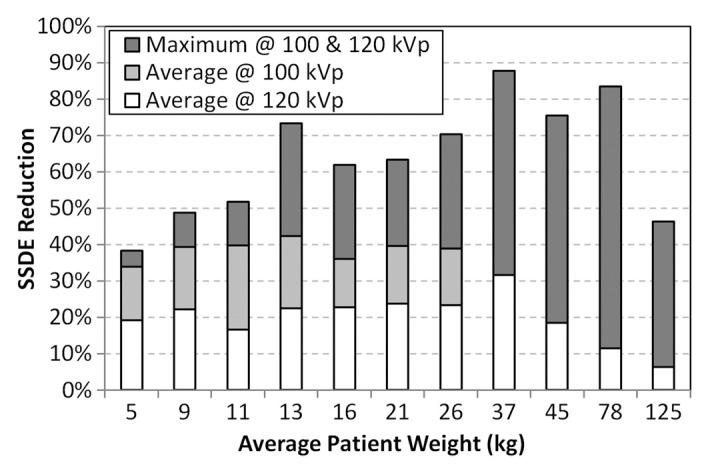
Bar graphs show additive effect of incremental patient dose reduction. First, SSDE reduction was calculated for 40% ASIR implementation for imaging at 120 kVp for both (a) chest and (b) abdominopelvic CT protocols (white bars). Additional dose reduction was then calculated for imaging at 100 kVp (for patients between 0 and 31.5 kg), which provided additional dose savings to the reported 120 kVp reduction levels (ie, total dose savings = white bars + light gray bars). Finally, the maximum dose reduction for imaging at both 100 kVp and that at 120 kVp is shown relative to the mean dose savings (dark gray bars).
Figure 5b:
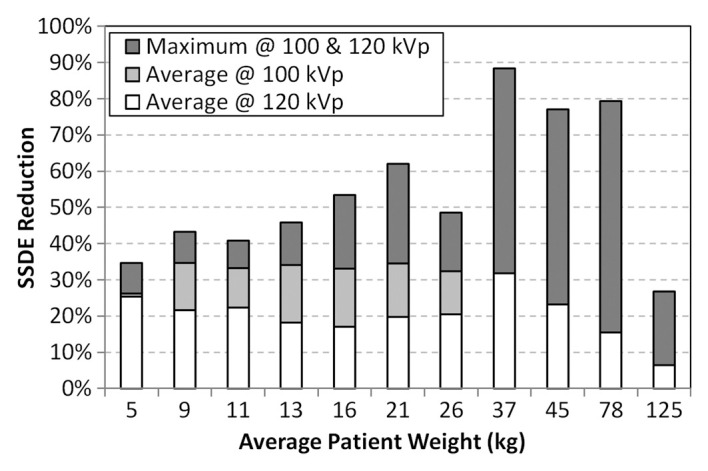
Bar graphs show additive effect of incremental patient dose reduction. First, SSDE reduction was calculated for 40% ASIR implementation for imaging at 120 kVp for both (a) chest and (b) abdominopelvic CT protocols (white bars). Additional dose reduction was then calculated for imaging at 100 kVp (for patients between 0 and 31.5 kg), which provided additional dose savings to the reported 120 kVp reduction levels (ie, total dose savings = white bars + light gray bars). Finally, the maximum dose reduction for imaging at both 100 kVp and that at 120 kVp is shown relative to the mean dose savings (dark gray bars).
Discussion
By maintaining pre-ASIR image quality standards (ie, noise and noise texture), ASIR was implemented as a dose reduction–only tool. This was accomplished by using ASIR to improve the noise content in the reconstructed image, which then allowed the overall noise target for the beam current modulation system (ie, NI) to be increased, having the subsequent effect of lowering the overall average beam current used for image formation. This approach stands in contrast to the majority of current ASIR implementation methods, where dose reduction is realized with some image noise improvement (3–5,8,9,11–13).
The specific blend of ASIR with FBP was determined by modeling the effects of image noise magnitude and noise texture as a function of ASIR (2) so that the new NI levels could be established to meet our image quality goal of not changing noise magnitude or texture in the reconstructed image. The choice to use 40% ASIR was predominantly made to preserve noise texture in the reconstructed CT image; it has been demonstrated that the texture of the noise in the reconstructed CT image changes with increased ASIR, such that images produced with the standard reconstruction filter take on a more noticeably smoothed appearance with implementation of 50% ASIR or greater (2,6,12). Also, at 40% ASIR, it has been shown that spatial resolution is slightly improved for high-contrast objects and the loss in spatial resolution in low-contrast objects is minimized (17,18). In theory, the methods in this study will be applicable for any percentage ASIR implementation in conjunction with the noise models previously reported (2).
The use of beam current modulation technology in conjunction with ASIR provided additional dose reduction for pediatric patients weighing more than 40 kg because of the heightened heterogeneity of this patient population’s body habitus and weight, but beam current modulation was found to be unnecessary for patients weighing 40 kg or less for both chest and abdominopelvic imaging. Beam current modulation was unable to modulate the beam current lower than the established minimum tube current for patients weighing 40 kg or less. A previous study (4) reported similar findings, but for patients weighing between 0 and 9 kg and more than 100 kg. However, in that study, the authors reported a higher degree of modulation of the tube current, which they attributed to the system’s inability to achieve the noise target level specified by the NI. Those authors increased the NI and decreased the minimum tube current by only 20%. In our study, we calculated the increased NI to be approximately 33% and the decreased tube current to be 20%–25% of the original values; the minimum tube current was not lowered by the same percentage as the NI was raised because tube current shares a quadratic relationship with NI (2). By virtue of carefully establishing new NI and minimum beam current levels at our institution, the mean change in image noise magnitude was shown to be less than 1 HU; what little reduction of noise was realized was done so in the population of the smallest patients and was welcome for these very small patients.
There were limitations in our study. First, only 19 patients in our post-ASIR population weighed more than 100 kg. The modest dose reduction in this category was attributed to the paucity and wide range of the data; typical adult-centric ASIR studies have reported dose reductions much greater than those reported in our study. Second, patient dosimetry was performed on the basis of SSDE calculation methods, which may make comparison of our dose reduction findings with those in other published works difficult. Previous studies detailing dose reduction with ASIR primarily based their calculations on CTDIvol, a non–patient-specific dosimetry method. CTDIvol values are derived from cylindric Plexiglas phantoms that are sex and age indiscriminate. Additionally, nearly all recorded CTDIvol values are derived from cylindric phantoms that are 32 cm in diameter; this diameter tends to result in underestimation of the exposure risk to smaller patients, particularly pediatric patients, by upward of 50%. Third, our study did not assess all aspects of image quality but based image quality assessment on the use of noise and CNR only. This decision was based primarily on the fact that ASIR most directly affects noise in the reconstructed image; however, recent publications (17,18) have demonstrated that ASIR affects other aspects of image quality such as spatial resolution. Finally, the dose savings quoted in this study were calculated on the basis of the use of a single CT scanner from a single manufacturer and therefore may vary among scanners of the same manufacturer and similar software from other manufacturers. Also, dose reduction was based on our institution’s preliminary selection of 40% ASIR; one may expect enhanced dose reduction for ASIR implementation of more than 40%.
In conclusion, for a predominantly pediatric population imaged with 40% ASIR, a mean of 39% (2.7/4.4 mGy; range, 23%–72%) dose reduction was achieved in chest CT, and a mean of 29% (4.8/6.8 mGy; range, 20%–64%) was achieved in the abdomen and pelvis, with no change in image noise magnitude or CNR.
Advances in Knowledge
■ The use of 40% adaptive statistical iterative reconstruction (ASIR) in conjunction with tube voltage reduction and beam current modulation maximizes CT radiation dose reduction in the pediatric cancer population without changing noise magnitude (<1 HU) or image contrast (8% [15.3/14.2] for chest imaging and 13% [7.8/6.8] for abdominopelvic imaging).
■ For a predominantly pediatric population (4–147 kg), the use of 40% ASIR yielded an average radiation dose reduction at chest CT of 39% (2.7/4.4 mGy), with a maximum reduction of 72% (5.3/18.8 mGy), and an average dose reduction at abdominopelvic CT of 29% (4.8/6.8 mGy), with a maximum reduction of 64% (7.6/20.9 mGy).
Implication for Patient Care
■ To maximize radiation dose reduction in a pediatric population, 40% ASIR was implemented for CT studies of the chest and the abdomen and pelvis without changing pre-ASIR image quality standards (noise magnitude or texture).
Disclosures of Conflicts of Interest: S.L.B.No relevant conflicts of interest to disclose. B.M.M. No relevant conflicts of interest to disclose. B.S.Y. No relevant conflicts of interest to disclose. R.A.K. No relevant conflicts of interest to disclose.
Received November 20, 2012; revision requested January 2, 2013; revision received February 22; accepted May 14; final version accepted May 23.
Supported by American Lebanese Syrian Associated Charities.
Current address: Department of Physics, Tuskegee University, Tuskegee, Ala.
Abbreviations:
- ASIR
- adaptive statistical iterative reconstruction
- CNR
- contrast-to-noise ratio
- CTDIvol
- volume CT dose index
- FBP
- filtered back projection
- NI
- noise index
- ROI
- region of interest
- SSDE
- size-specific dose estimate
References
- 1. Kalra MK , Maher MM , Toth TL , et al. Strategies for CT radiation dose optimization . Radiology 2004. ; 230 ( 3 ): 619 – 628 . [DOI] [PubMed] [Google Scholar]
- 2. Brady SL , Yee BS , Kaufman RA . Characterization of adaptive statistical iterative reconstruction algorithm for dose reduction in CT: a pediatric oncology perspective . Med Phys 2012. ; 39 ( 9 ): 5520 – 5531 . [DOI] [PubMed] [Google Scholar]
- 3. Prakash P , Kalra MK , Digumarthy SR , et al. Radiation dose reduction with chest computed tomography using adaptive statistical iterative reconstruction technique: initial experience . J Comput Assist Tomogr 2010. ; 34 ( 1 ): 40 – 45 . [DOI] [PubMed] [Google Scholar]
- 4. Singh S , Kalra MK , Shenoy-Bhangle AS , et al. Radiation dose reduction with hybrid iterative reconstruction for pediatric CT . Radiology 2012. ; 263 ( 2 ): 537 – 546 . [DOI] [PubMed] [Google Scholar]
- 5. Vorona GA , Ceschin RC , Clayton BL , Sutcavage T , Tadros SS , Panigrahy A . Reducing abdominal CT radiation dose with the adaptive statistical iterative reconstruction technique in children: a feasibility study . Pediatr Radiol 2011. ; 41 ( 9 ): 1174 – 1182 . [DOI] [PubMed] [Google Scholar]
- 6. Cornfeld D , Israel G , Detroy E , Bokhari J , Mojibian H . Impact of Adaptive Statistical Iterative Reconstruction (ASIR) on radiation dose and image quality in aortic dissection studies: a qualitative and quantitative analysis . AJR Am J Roentgenol 2011. ; 196 ( 3 ): W336 – W340 . [DOI] [PubMed] [Google Scholar]
- 7. Hara AK , Paden RG , Silva AC , Kujak JL , Lawder HJ , Pavlicek W . Iterative reconstruction technique for reducing body radiation dose at CT: feasibility study . AJR Am J Roentgenol 2009. ; 193 ( 3 ): 764 – 771 . [DOI] [PubMed] [Google Scholar]
- 8. Leipsic J , Labounty TM , Heilbron B , et al. Adaptive statistical iterative reconstruction: assessment of image noise and image quality in coronary CT angiography . AJR Am J Roentgenol 2010. ; 195 ( 3 ): 649 – 654 . [DOI] [PubMed] [Google Scholar]
- 9. Leipsic J , Nguyen G , Brown J , Sin D , Mayo JR . A prospective evaluation of dose reduction and image quality in chest CT using adaptive statistical iterative reconstruction . AJR Am J Roentgenol 2010. ; 195 ( 5 ): 1095 – 1099 . [DOI] [PubMed] [Google Scholar]
- 10. Marin D , Nelson RC , Schindera ST , et al. Low-tube-voltage, high-tube-current multidetector abdominal CT: improved image quality and decreased radiation dose with adaptive statistical iterative reconstruction algorithm—initial clinical experience . Radiology 2010. ; 254 ( 1 ): 145 – 153 . [DOI] [PubMed] [Google Scholar]
- 11. Sagara Y , Hara AK , Pavlicek W , Silva AC , Paden RG , Wu Q , Abdominal CT : comparison of low-dose CT with adaptive statistical iterative reconstruction and routine-dose CT with filtered back projection in 53 patients . AJR Am J Roentgenol 2010. ; 195 ( 3 ): 713 – 719 . [DOI] [PubMed] [Google Scholar]
- 12. Silva AC , Lawder HJ , Hara A , Kujak J , Pavlicek W . Innovations in CT dose reduction strategy: application of the adaptive statistical iterative reconstruction algorithm . AJR Am J Roentgenol 2010. ; 194 ( 1 ): 191 – 199 . [DOI] [PubMed] [Google Scholar]
- 13. Singh S , Kalra MK , Hsieh J , et al. Abdominal CT: comparison of adaptive statistical iterative and filtered back projection reconstruction techniques . Radiology 2010. ; 257 ( 2 ): 373 – 383 . [DOI] [PubMed] [Google Scholar]
- 14. Kanal KM , Stewart BK , Kolokythas O , Shuman WP . Impact of operator-selected image noise index and reconstruction slice thickness on patient radiation dose in 64-MDCT . AJR Am J Roentgenol 2007. ; 189 ( 1 ): 219 – 225 . [DOI] [PubMed] [Google Scholar]
- 15. American Association of Physicists in Medicine . Size-specific dose estimates (SSDE) in pediatric and adult body CT examinations (Task Group 204) . College Park: , Md: American Association of Physicists in Medicine; , 2011. . [Google Scholar]
- 16. Brady SL , Kaufman RA . Investigation of American Association of Physicists in Medicine Report 204 size-specific dose estimates for pediatric CT implementation . Radiology 2012. ; 265 ( 3 ): 832 – 840 . [DOI] [PubMed] [Google Scholar]
- 17. Brady S , Kaufman R . TH-E-217BCD-03: Image contrast dependent spatial resolution differences for varying levels of ASiR™ implementation . Med Phys 2012. ; 39 ( 6 ): 4015 . [Google Scholar]
- 18. Richard S , Husarik DB , Yadava G , Murphy SN , Samei E . Towards task-based assessment of CT performance: system and object MTF across different reconstruction algorithms . Med Phys 2012. ; 39 ( 7 ): 4115 – 4122 . [DOI] [PubMed] [Google Scholar]


