Abstract
We study how modularity of the human brain changes as children develop into adults. Theory suggests that modularity can enhance the response function of a networked system subject to changing external stimuli. Thus, greater cognitive performance might be achieved for more modular neural activity, and modularity might likely increase as children develop. The value of modularity calculated from fMRI data is observed to increase during childhood development and peak in young adulthood. Head motion is deconvolved from the fMRI data, and it is shown that the dependence of modularity on age is independent of the magnitude of head motion. A model is presented to illustrate how modularity can provide greater cognitive performance at short times, i.e. task switching. A fitness function is extracted from the model. Quasispecies theory is used to predict how the average modularity evolves with age, illustrating the increase of modularity during development from children to adults that arises from selection for rapid cognitive function in young adults. Experiments exploring the effect of modularity on cognitive performance are suggested. Modularity may be a potential biomarker for injury, rehabilitation, or disease.
Keywords: fMFI, neural activity, modularity, development
1. Introduction
A modular organization of neural activity can facilitate more rapid cognitive function, because much of the rewiring of connections required for adaptation is performed within the modules, which is easier and faster than within the entire network [1–7]. On the other hand, modularity may restrict possible cognitive function, because a modular neural architecture is a subset of all possible architectures [3– 6]. Modularity in the neural activity of the human brain has been demonstrated [8, 9], with activation of neural activity in different parts of the brain observed by functional magnetic resonance imaging (fMRI) [10–16]. Remarkably, correlated neural activity can also be generated from free-streaming, subject-driven, cognitive states [10]. Models of developing neural activity have shown a self-organization of modular structure [17].
We here hypothesize that selection for neural plasticity is strong during childhood and peaks during young adulthood. Since modularity increases plasticity, we expect that modularity of neural activity in the brain might peak during adulthood as well. These modules are correlated with physical structure of the brain [18], but they are not completely hard coded at birth. Cognitive demands upon the brain promote development of modular neural activity, which empowers the brain with increased plasticity and task switching ability.
A dynamic network of neural activity in the brain that can reconfigure its architecture will converge to a value of the modularity that depends on the pressure upon it [5, 6]. Here we show that modularity of neural activity in the human brain increases from age 4 and peaks in young adulthood. We use a model to interpret these results, showing that highly modular neural activity favors rapid, low-level tasks, whereas less modular neural activity promotes less rapid, effortful, high-level tasks. The model shows that increased connection between stored memories or faster required response times for adults versus children can explain the observed development of modularity in neural activity.
The structure of functional networks constructed from fMRI data is age dependent. For example, analysis of fMRI data from young adults and old adults shows the modularity of human brain functional networks decreases with age [6, 13, 19]. Additionally, the architecture of the default network of the brain extracted from fMRI data changes as children develop into adults [20], and working memory performance has been shown to be related in an age-dependent way with functional networks [21]. That functional network constructed from fMRI data can be age dependent was emphasized in a study showing subject age can be estimated from 5 minutes of fMRI data from individual subjects [22]. These works suggests a clear developmental and age dependence of the networks constructed from fMRI data. In other work, connection matrices averaged over ages were constructed and the modularity of these average matrices was computed, observing no trend of modularity with age [23]. The lack of observed trend in that study may be due to the construction of averaged connection matrices, rather than consideration of the connection matrices constructed from each individual.
Measurements of task switching costs, both mixing and switching, show that young adults are more efficient than both children and old adults at task switching [24]. We suggest selection for neural task switching peaks during young adulthood, and that selection for task switching is one mechanism to explain the observed peak of modularity in neural activity in young adulthood. We demonstrate the cross-task utility of modularity in a model of memory recall. In other words, in this model, we show that modularity measured during the task of watching a movie has functional implications for a task such as memory recall. Previous results show that regions of interest observed during resting state activity strongly overlap with known functional regions [10, 18]. Thus, it is likely that the modularity observed during the task of movie watching has functional implications for other tasks, such as memory recall. Indeed, it has been demonstrated that modularity of resting-state neural activity is positively correlated with working memory capacity [25].
A number of studies have reported that children move their heads more than adults, and that this motion can affect properties computed from the observed fMRI data. Thus, it has been suggested that calculations should separately account for head motion and age when drawing conclusions about the effect of development on correlations of neural activity. In some subject populations, with particular alignment methods, spurious correlations between the computed network properties and extent of head motion have been observed [26]. Further work showed that the underlying age-dependent changes to the spatial dependence of correlations persist after head motion correction, although the magnitude of the age dependence decreases [27]. A study using the SPM2 software showed an apparent increase in local connectivity and decrease in large-scale, distributed networks due to head motion [28]. A study using in-house software showed an effect of head motion on extracted time series data [29]. A study using FSL showed a negative correlation between modularity and head motion for motions above 0.07 mm [26]. Since head motion is negatively correlated with age, these studies caution that artifacts due to head motion might erroneously be interpreted to predict that modularity is positively correlated with age. We quantify head motion artifacts, showing that with the alignment procedure and strict censor cutoff used used in our study, effects of head motion are negligible after alignment.
In this work, we analyzed patterns of neural activity measured by fMRI for children of different ages and for young adults watching a movie. We show that a mathematical definition of modularity, using several different basis sets, leads to the conclusion that modularity increases from childhood to young adulthood. These results are consistent with very recent results showing increased within-module connectivity during development [27]. Theory suggests that highly modular neural activity favors rapid, low-level tasks, whereas less modular neural activity promotes less rapid, effortful, high-level tasks [5, 6, 16]. We test the general predictions of this theory relating modularity to performance and we derive a fitness function for a quasispecies description of the modularity dynamics. We describe details of the data analysis in the Methods section. The Results section describes these results. In the Model section, we introduce a model to show that a more modular neural architecture leads to more accurate recognition of memory at short times. We also show that a more modular neural architecture leads to more accurate recognition of memories when stored memories are more overlapping. This model suggests that overlapping stored memories or faster required response times for adults versus children are mechanisms that could explain the observed development of near-resting state modularity in neural activity. We conclude with experimental and clinical implications in the Discussion section.
2. Methods
2.1. Subjects
We analyzed fMRI data from 21 adults age 18–26 and 24 children age 4–11 watching 20 minutes of Sesame Street [30]. Image acquisition details are provided in [30]. These data were taken from a set of 27 children (16 female) and 21 adults (13 female). Three children were excluded due to excessive head motion (> 5 mm), opting-out, or experimenter error. All children were typically developing. In addition, screening for neurological abnormalities was performed on all participants [30]. Raw, KBIT-2 overall IQ scores are known for 17 of the children and range from 18.5 to 66 [30].
2.2. Processing of fMRI Data
The two-dimensional fMRI data slices [30] were combined into a three-dimensional fMRI representation of the neural activity as a function of time, with 2 sec time resolution and 4 mm spatial resolution. The first six fMRI images of each subject were discarded to allow the blood oxygen level dependent (BOLD) signal to stabilize. The time series images for each subject were registered to 1 mm resolution, deskulled anatomical data, which created a normalized image in standard space. The time series images were then despiked, and the spike values were interpolated using a non-linear interpolation [31]. The images were then slice time corrected, registered, scaled into Talarirach brain coordinates [32], motion corrected, bandpass filtered, and blurred (Cox, 1996). Frame-to-frame motion of a subjects’ head was corrected by regressing out rigid translations and rotations of the fMRI data and derivatives of these parameters during the time course. Motion was censored with a threshold of 0.2, i.e. RMSD of 2 mm or 2 degrees based on the Euclidean Norm of the derivative of the translation and rotation parameters. Outliers were censored with a threshold of 10%. Due to excessive censoring, 2 of the child and 1 of the adult subject data were excluded. For the individuals remaining in the study, a small fraction of the time slices were removed by this censoring, also termed scrubbing, and the values replaced with values linearly interpolated from neighboring time points. All calculations were performed with AFNI [31]. The block of analysis code of example 9a in the afni_proc.py was applied.
2.3. Calculation of Modularity
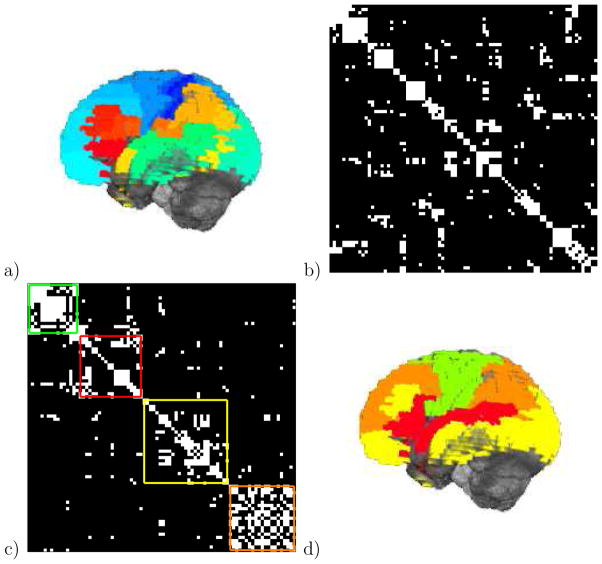
We computed modularity from correlations in neural activity of the brain extracted from fMRI data [11, 13, 33]. Fig. 1 illustrates the process. Correlations were computed for each subject between Brodmann areas, a standardized basis set describing regions of the human cerebral cortex [34]. Modularity was computed using the Newman algorithm [35]. We projected the Nedge largest values of the correlation matrix to unity, and set the remaining values to zero. We computed the modularity of this projected matrix. These values of modularity depend on the parameter Nedge, and it will be confirmed that adult modularity is greater than child modularity for all Nedge values. The value for the Nedge parameter must be large enough that the projected correlation matrix is fully connected, which implies Nedge ≥ 200 for our data set. We considered 200 ≤ Nedge ≤ 500 so that the non-linear effect of the projection were significant, i.e. the projected matrix was not simply all unity.
Figure 1.
Brain neural activity is clustered into modules. a) fMRI neural activity data are projected onto Brodmann areas, shown as colored regions. b) Neural activity between different Brodmann areas is correlated for subjects watching 20 minutes of Sesame Street, shown here for one adult subject. Only the elements of the correlation matrix above a cutoff are retained (white). c) Modules are defined as the clusters that maximize Newman’s modularity. The four modules identified from the 84 Brodmann areas for this subject are shown, of size 16 (green), 20 (red), 27 (yellow), and 21 (orange). The modularity is 0.6441, with contributions of 0.1585, 0.1310, 0.1592, and 0.1954 from each module respectively. d) The four modules of neural activity for this subject.
The numerical value of the modularity is the probability to have correlations within the modules, minus the probability expected for a randomized matrix with the same degree sequence [35]. In other words,
| (1) |
where Aij is one if there is an edge between Brodmann area i and Brodmann area j and zero otherwise, The value of ai = Σj Aij is the degree of Brodmann area i, and is the total number of edges, as in Fig. 1. Edges are established if the correlation between Brodmann areas i and j is greater than the cutoff value, which is implicitly determined by the desired number of edges to keep in the matrix, see Fig. 1b. Modules are defined by the grouping that maximizes M [35]. The Newman algorithm [35] is used to calculate values of modularity and the identity of the modules. This algorithm gives a unique answer for the modularity and set of modules for a given connection matrix. The value of the modularity depends on how the Brodmann areas are grouped into modules, in Eq. 1, and the Brodmann areas are clustered into modules by choosing the grouping that maximizes the modularity, Eq. 1.
It is not necessary to use a cutoff in the calculation of the modularity. The Newman modularity calculation can be applied to a full matrix, with real number values, rather than the binary projection. That is, the matrix A in Eq. (1) can simply be the full correlation matrix, without projection. Modularity computations on the full, real-valued matrix will also be presented.
Finally, it is also not necessary to use the Brodmann areas as regions of interest. That is, the i and j in Eq. (1) can simply be voxels, rather than Brodmann areas. Results for (8 mm)3 and (12 mm)3 voxels will be presented. Thus, modularity values for three different basis sets were computed.
3. Results
Figure 2a shows modularity of neural activity for children and adults. The modularity of neural activity of adults is greater than that of children (p-value < 0.001 for 400 edges). This result persists when different cutoff values are used to calculate modularity from the correlation matrix. The results for 400 edges are representative, and unless otherwise noted, we used this criterion to construct the projected correlation matrix. Modularity of neural activity increases with age during childhood development. The average Pearson correlation between modularity and age, corresponding to the data in Fig. 2a, is 0.44 (p-value 0.02, sample size 22). Similarly, the average Pearson correlation between modularity and raw, not-age-normalized KBIT-2 overall IQ score is 0.234 (p-value 0.16, sample size 16, as some children did not have reported IQ scores). The positive correlation of modularity with both age and raw IQ shows the development of modularity in neural activity in the brain during childhood.
Figure 2.
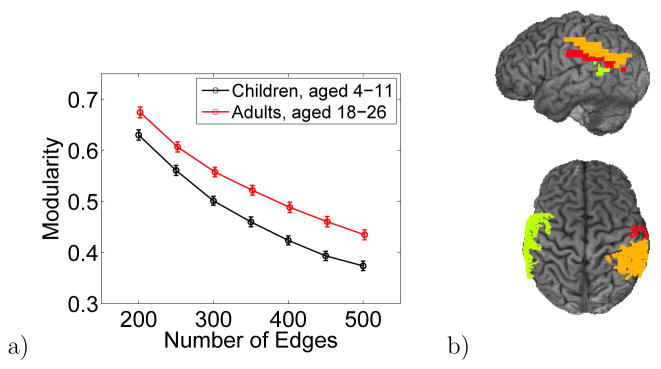
a) Average modularity of the neural activity in the brain for the child and adult cohorts. Modularity is greater for adults than for children. Modularity is computed from the correlation matrix of neural activity between Brodmann areas. The number of entries in the correlation matrix above the cutoff, denoted by edges, is chosen so that the matrix is fully connected yet still sparse. Modularity computed using different values of the cutoff persistently shows a higher value for adults than for children. The error bars are one standard error. b) top) The three Brodmann areas whose domains grow the most in size from children to adults, and bottom) the three Brodmann areas whose domains shrink the most, for 400 edges.
3.1. Modularity of a Full Matrix with Real-Numbered Connection Weights
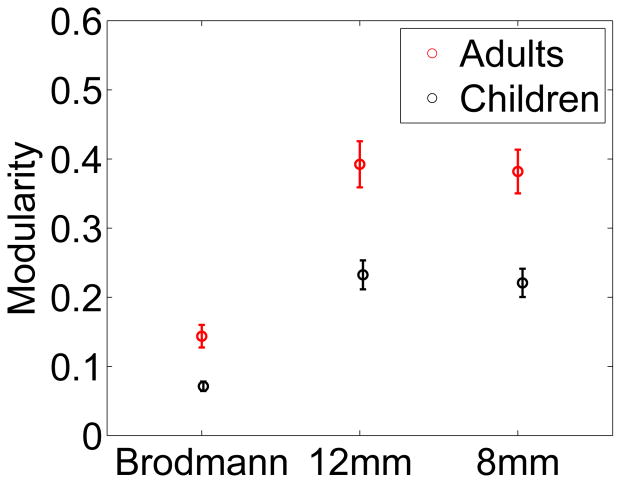
Figure 3 shows the results when the full matrix is computed, the “Brodmann area” values. The modularity of adults and children are significantly different, p-value 7 × 10⁻⁵.
Figure 3.
Calculation of modularity when the full matrix of correlations is used. Calculations were performed using Brodmann areas as nodes and a 84×84 matrix of correlations. Calculations were also performed without masking the data to Brodmann areas, and using the original data at a resolution of 12 mm and a 2160×2160 correlation matrix or a resolution of 8 mm and a 6426×6426 correlation matrix. The p-values for the significance of the difference between the modularity of adults and children are 7 × 10⁻⁵, 9 × 10⁻⁵, and 4 × 10⁻⁵, respectively. These results confirm the generality of the results in Fig. 2. Modularity develops during childhood.
3.2. Effect of Head Motion on Calculation of Modularity
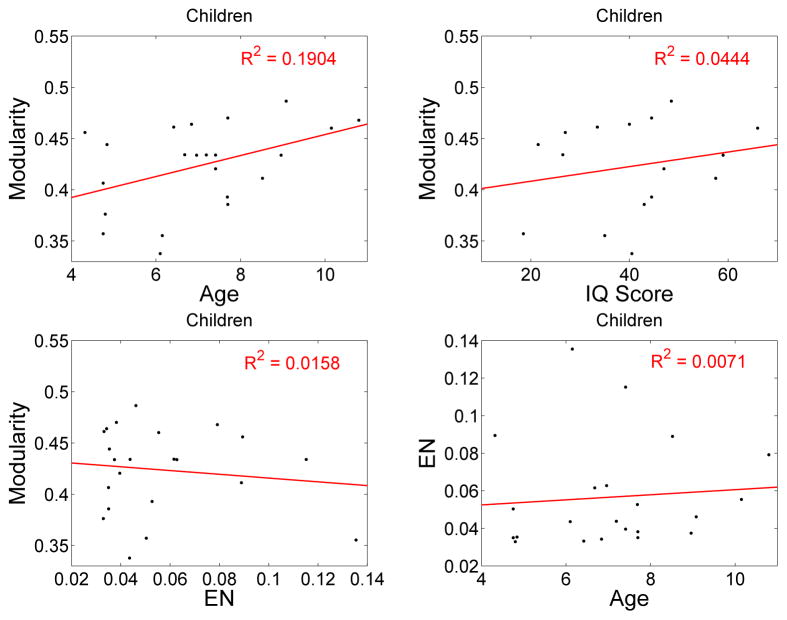
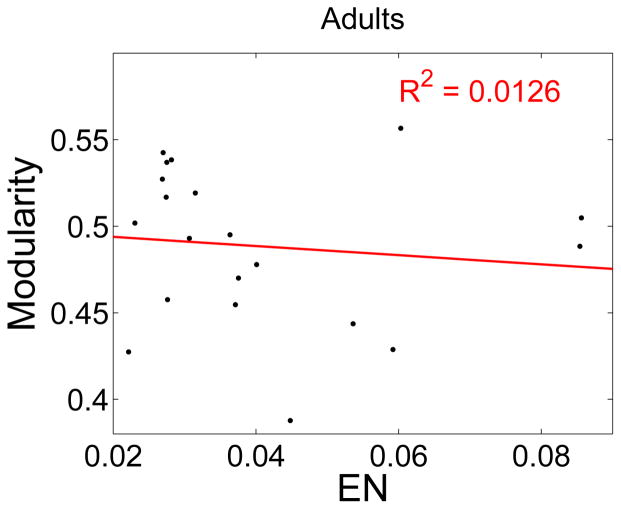
The extent of head motion was measured by the Euclidean norm of the derivatives of the motion parameters, termed EN. To illustrate this point, a number of correlations were carried out to illustrate the effect of head motion. The correlations for children are shown in Table 1 and Fig. 4. Modularity is significantly correlated with age. Furthermore, inclusion of EN to the correlation of modularity with age only very slightly increases the goodness of fit (R2), and does not change the positive slope of the correlation of M with age. The coefficient relating modularity to age, ∂M/∂ age, is the same whether head motion is included as an independent variable or not. Thus, the head motion is not biasing the estimated relationship between modularity and age. The correlations of modularity or age with EN are small and not significant. The correlation of modularity with EN for adults is also small and not significant, p-value = 0.32.
Table 1.
Quantification of the persistence of modularity and module identity with optimization of modularity.
| Dependent variable and independent variable(s) | R2 | p-value | ∂M/∂ age |
|---|---|---|---|
| M with age | 0.1904 | 0.0211 | 0.0102 |
| M with EN | 0.0158 | 0.2897 | |
| EN with age | 0.0071 | 0.3545 | |
| M with age and EN | 0.2170 | 0.0490 | 0.0106 |
Figure 4.
The correlation of modularity with age, IQ score, and Euclidean norm (EN) from AFNI for children. Also shown is the correlation of EN with age.
3.3. Development of Modules
Not only is the modularity of neural activity in the children and adults different, but also the identity of the modules changes with development. We computed the probability that Brodmann areas i and j were in the same module, as estimated from the data by the observed fraction. Consider a single person. The probability that area i and j are in the same module, pij, is either 0 or 1 (they either are, or are not, in the same module in one given subject sample). The sum of this quantity over j is the size of the module in which i is a member, Si. Averaging Si over all children or all adults gives the average size of the module in which i participates, 〈Si〉child or 〈Si〉adult, respectively. These two quantities were calculated for each Brodmann area. Also reported are the three i for which 〈Si〉adult − 〈Si〉child is largest and the three i for which 〈Si〉adult − 〈Si〉child is smallest.
We found the three Brodmann areas that had the largest positive difference between the average module size in adults and children, shown in Fig. 2b. These are the areas whose modules grew most in size with development. They are left Brodmann area 23, 29, and 31. We also found the three Brodmann areas that had the largest negative difference in average module size between adults and children, i.e. the areas whose modules shrink most with development, shown in Fig. 2b. They are left Brodmann area 21, right 40, and right 43.
3.4. Near Degeneracy of Modularity Values
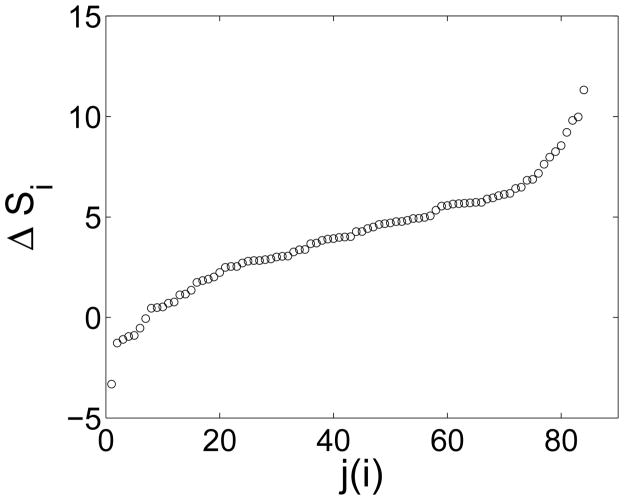
In the definition of modularity, Eq. (1), there can be partitions that give values of modularity near but slightly below the optimal value. The optimal value is denoted by M, and the nearby values are denoted by Q. To address the near degeneracy of modularity values, that is values of Q that are near the optimal value of modularity M, the Newman algorithm was generalized to include the possibility of accepting a move that decreases Q, with probability min[1, exp(ΔQ/T)]. This generalization leads to sampling the near-optimal values of Q, roughly in the range M − T to M. How the average Q varies with T was calculated. Also calculated was how often the set of the 3 Brodmann areas for 〈Si〉adult − 〈Si〉child is largest and the set of the 3 for which it is smallest changes identity in 100 runs. From these results, one sees that M values reported are representative, i.e. the nearly degenerate 〈Q〉 values are close to the optimal value, M. The identification of 3 Brodmann areas for which 〈Si〉adult − 〈Si〉child is largest and the 3 for which it is smallest is relatively stable among these nearly degenerate states. Essentially only the least stable member of the latter is lost at finite T (3/3 and 2/3 of the members are stable, respectively). The top areas are more stable than the bottom areas, because there is a gap in the distribution of 〈Si〉adult − 〈Si〉child after the 3rd highest value, see Fig. 6. This distribution shows there is a natural set of highest and lowest outliers.
Figure 6.
The distribution of the values of 〈Si〉adult − 〈Si〉child They are ordered from smallest to largest; j(i) denotes this ordering.
4. Model
4.1. Model of the Response Function for Memory Recall
We will explore a mechanism to understand the results with a model of neural activity and cognitive function. We build upon the Hopfield neural network model [36]. Models of brain activity with different levels of detail and complexity have been developed. At the detailed level, there are models of individuals neuron activation and spiking [37–39]. These models have been generalized to a population of neurons, in which synchronization of the spike trains has been calculated [40, 41]. The data analyzed are at the resolution of 4 mm, and a voxel of (4 mm)3 contains roughly a million neurons. The modeling is, therefore, of interactions between groups of neurons, with each group containing a million neurons. In addition, the time resolution of the fMRI BOLD signal data is 2 s. The fMRI BOLD signal results from the difference in magnetic spin properties of oxygenated and deoxygenated hemoglobin. This signal is, therefore, a representation of blood flow to each region of the brain. The regional blood flow is an indication of local neural activity [42]. At this time and length scale, a model such as the Hopfield neural network is appropriate. As with the data, neural activity is the only observable in this model.
We used a neural network model to describe the dynamics of neural activation that was measured by the fMRI experiments. The voxels of neural activation measured in the fMRI are subgroups of neurons in the brain. In the model, the activation state of subgroup i is given by σi(t), which takes on values 1 or −1 to indicate that the subgroup of neurons is active or inactive on average at time t, respectively. Thus, for each physical region of the brain in Fig. 1a, there is a σi(t). The neural state at time t + 1 was created from the neural state at time t, based upon connections between neurons and stored memories. We here took the connections between the neurons to be modular, with modularity M. These functional connections, denoted by the matrix Aij below, correspond roughly to the modules identified in Fig. 1d. The model describes how neural states in the brain are driven to match stored patterns, with the μth pattern denoted by . We also took the stored memories to be clustered. The correlation between these stored patterns is denoted by the weight matrix Wij. The clustering of the stored memories is quantified a parameter p, described below. The modules identified in the fMRI experiments, Fig. 1d, are described in detail in the model through the combined influence of the connection matrix and the memory correlation matrix, AijWij.
We related the modularity of the neural activation in the model to the modularity of the neural activity as measured by fMRI. The connection matrix denotes whether neural region i is connected to region j. Due to physiological changes that occur during development, these connections change, as shown in Figs. 2 and 3. In particular, we set the connection matrix of the neural network to be modular [43], with modularity M. Crucially, we also set the stored memory patterns to be clustered as well, with modularity p. The neural state is propagated from a random initial state to recall a stored memory according to the Hebbian learning rule [44]. We computed the average overlap between the final neural state and the stored memory. In terms of an experiment, overlap at time t can be interpreted as quantifying how well a subject correctly identifies an image that is visible for a time, t.
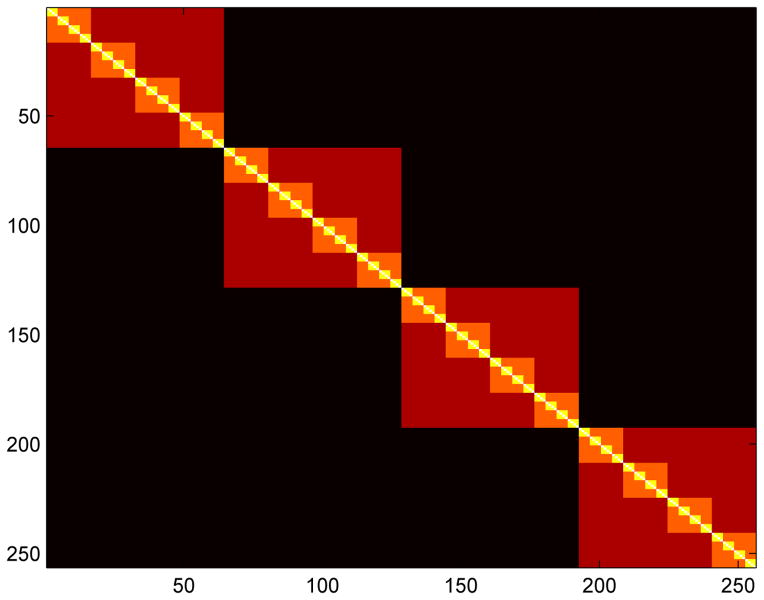
In the neural network model, memory μ is defined by the pattern of length N = 256 bits [36]. The weight matrix is defined by . The N/4×N/4 block diagonals define the four modules. Four distinct patterns are stored, one per module. Each pattern μ has N/4 values with , each of which has probability (1 + 3p)/4 of being within the μth block diagonal. The neural state is defined by σi(t) and updated by the Hebbian learning rule [44] σi(t+1) = sign[Σj AijWijσj(t)]. The connection matrix A is binary and sparse, with average degree 〈k〉 = 30. The probability for a connection to be at a given site within the block diagonal is given by (1+3M)〈k〉/N. The overlap of the neural state with the target memory is given by .
4.2. A Hierarchical Generalization
It has been argued that at the largest scales, the brain structure is hierarchical, not simply modular. Thus, the modular Hopfield neural network described above was also generalized to an hierarchical model. A similar hierarchical model was studied by Rubinov et al. in a computational analysis to show the effect of self-organized criticality and neuronal information processing [41]. In the modular model, the connection matrix A is made modular. In the hierarchical model discussed here, 5 levels, γ, are defined. The level for matrix position ij is defined as the smallest γ for which ⌊i/4γ⌋ = ⌊j/4γ⌋. For example, γ = 0 is the diagonal, and γ = 4 is the entire matrix, excluding the all the 4 × 4 block diagonals. See Fig. 7. The probability to be within region γ is assigned to be proportional to 1 − γε, with the proportionality determined so that the average number of connections per node remains at 30. Here ε = 1/4 is a measure of the asymmetry introduced by the hierarchy.
Figure 7.
Pictorial representation of the hierarchical matrix. The levels are 4 (black), 3 (red), 2 (orange), 1 (yellow), and 0 (white). matrix.
4.3. Model Results
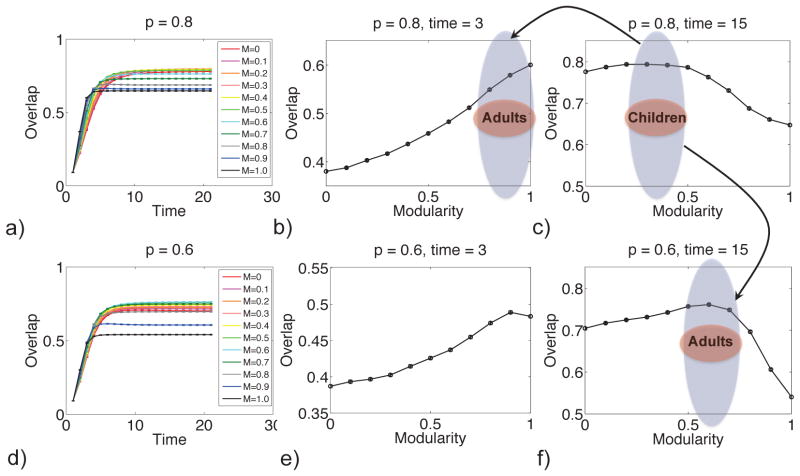
The cognitive ability of the brain, i.e. its ability to solve a challenge, depends on modularity of the neural activity. The responses of the model neural system with high modularity and lower modularity are shown in Fig. 8. In this figure, cognitive performance is quantified by overlap between evolved neural state and target memory state. These performance curves as a function of time and neural architecture depend on the clustering of the stored memories, p. The overlap typically increases with time, as the target memory is dynamically recalled. At short times, a more modular memory architecture can lead to a better recall, i.e. greater overlap with the stored memory. At longer times, a less modular memory architecture can give better performance. We view this crossing of the performance as a function of time to be a generic result of an evolving dynamical system with a rugged fitness landscape [45] and not unique to the particular model used here.
Figure 8.
More modular neural architectures give better performance at short times (a or d, short time) and less modular memory architectures can give better performance at long times (a or d, long time). The greater modularity in adults than children, Fig. 2, is consistent with either cognitive performance at short times is more important in adults than children (top arrow) or that memories are less clustered in adults than children (bottom arrow). Overlap is a measure of the probability that the neural state correctly recalls a memory. The modularity of the connection matrix is M. The timescale is of order seconds. The clustering of the stored patterns is denoted by p.
The variation in performance, shown in Fig. 8, helps to explain the change of modularity during development. We use quasispecies theory to quantify the relationship between performance and change of modularity. In this theory, systems with different modularity, m, are assigned a fitness, f(m), that quantifies the benefit of performance. This theory predicts how modularity changes with time, given the fitness function, and the rate at which entries in the connection matrix change, μ.
We take the overlap in Fig. 8 as the fitness for modularity, f(m), in the brain and use quasispecies theory [46] to predict how modularity develops with age. The average modularity, M(t) = 〈m(t)〉, changes with age according to
| (2) |
where μ is the rate of mutations in the connection matrix [46]. Following the bottom arrow of Fig. 8, the response time is taken to be 15, and it is assumed that p(t) changes from 0.8 at birth to 0.6 in middle age and 0.7 in old age, This p(t) is shown in Fig. 9a. Previous studies have shown that the modularity, measured with an automated anatomical labeling (AAL) basis set for resting state activity, of neural activity in adults with average age of 70 is roughly 7% below that of adults with average age of 22 [6, 13]. Another study of 193 adults aged 34–87, also using the AAL basis set, found that on average, modularity decreased 8% over 50 years [19]. These results imply p should be lower in old age than in young adulthood. The prediction from Eq. (2), shown in Fig. 9b, is a qualitative prediction for the developing human brain. Due to mutation [46], the observed modularity in Fig. 9b is below the value that maximizes the fitness, M*(t), defined by f[p(t),M*(t)] ≥ f[p(t), M] ∀ M. We calculate the modularity in the adiabatic limit, M∞(t), from the steady-state average fitness derived from a solution of the quasispecies theory [46]:
| (3) |
where C is the average number of connections in the connection matrix, per row.
Figure 9.
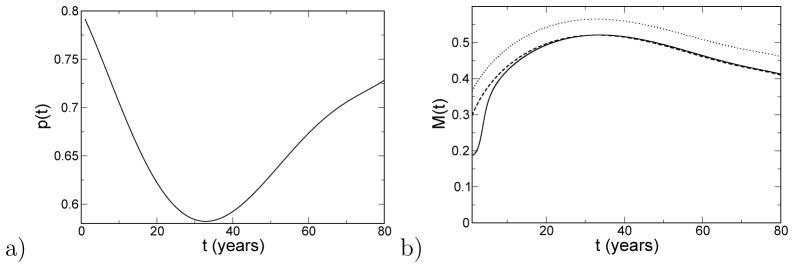
a) The clustering of memories versus age, after the bottom arrow in Fig. 8. b) The average modularity versus age predicted by quasispecies theory (solid). Here, the fitness is 10× the overlap in Fig. 8, and the rate of mutation is μ = 0.1 [46]. Also shown is the adiabatic approximation to the modularity, M∞ (dashed) as well as the modularity that maximizes the fitness, M* (dotted).
Results for the hierarchical model, analogous to those in Fig. 2, are shown in Figs. 10 and 11. These results show that this hierarchical generalization of the Hopfield model also shows a crossing of the response function at intermediate times. That is, low levels of hierarchy lead to better responses at long times. And high levels of hierarchy can lead to better responses at short times.
Figure 10.

Hierarchical Hopfield model results. Here p = 0.8.
Figure 11.

Hierarchical Hopfield model results. Here p = 0.6.
5. Discussion
We have observed that modularity of neural activity in the brain increases with age from children to young adults, as measured by fMRI experiments. These data are summarized in Fig. 2. The analysis separately takes into account head motion, and the present study finds that after censoring and alignment, the effects of head motion are negligible.
The Nedge cutoff parameter from Fig. 2 can be viewed as a clustering parameter. What Fig. 2 shows is that the modularity of adults is greater than that of children, persistently with the value of the Nedge cutoff parameter. In other words, the conclusion that modularity develops from children to adults is robust with respect to the particular value of the cutoff parameter.
Previous analysis of fMRI data from young adults and old adults has shown that modularity of neural activity in the brain decreases with age [6, 13, 19]. Taken together with the present results, it appears that modularity of neural activity peaks in young adulthood.
The calculation of modularity was done using both the Brodmann areas as a basis and using raw voxel data. Both calculations show the modularity of children is greater than that of young adults. Additionally, the calculated values of modularity were shown to be representative of the full distribution of near-optimal values.
The Brodmann areas that grew most during development, left Brodmann area 23, 29, and 31, are in the posteromedial cortex. They play a central role in the brain neural network and in communication with the rest of the brain [47–49]. These areas also play important roles in memory retrieval [50, 51]. It is interesting that all three areas in the left brain, generally associated with logic, language and analytical thinking. The Brodmann areas identified to be in the modules that grow the most with development are somewhat sensitive to the number of edges used in the projection of the correlation matrix. For the range of edges show in Fig. 2a, 80% of the identified Brodmann areas are in the left hemisphere. Additionally, the area with the most dominantly growing module, left Brodmann 29, is identified 80% of the time. Our results are consistent with the observation that the right brain is dominant in infants, and that left brain develops later into adulthood [52]. The Brodmann areas that shank most during development, They are left Brodmann area 21, right 40, and right 43, are related to language perception and processing, accessing word meaning, and face recognition [53, 54]. The area with the most dominantly shrinking module, left Brodmann 21, is identified 80% of the time.
Prior results show that young adults are able to more quickly solve task-switching challenges than are children or old adults [24]. The present model shows that modularity allows for rapid responses. That is, a more modular neural activity can allow the brain to switch more quickly from one type of neural activation to another. This conclusion is robust to refinements in the hierarchical structure of the model. Therefore, selective pressure for rapid cognition should lead to the emergence of modularity in neural activity of the brain during childhood development.
The present model suggests that modularity of neural activity may develop to facilitate rapid cognitive function. Modularity may be larger in young adults than in children because the typical required response time is shorter (upper arrow of Fig. 8). Modularity may also be larger because there are more connections between memories in adults than children, i.e. memories are less clustered, quantified by a smaller p (lower arrow Fig. 8). A module offers a pre-computed solution to a problem that has been previously encountered. Development of modularity from children to adults, thus, can improve task-switching performance.
5.1. Experimental Implications
Experiments to determine cognitive performance, as it depends on modularity, would be interesting to carry out. Predictions from quasispecies theory using this fitness function could test the significance of the measured task for developmental selection. Cognitive performance of subjects could be challenged while fMRI data are collected. For example, as suggested by the model, the probability of a subject to correctly identify an image visible for a time t may be measured. The cognitive performance should depend, among other parameters, on the modularity of the correlations in the subject’s neural activity in the brain. Measuring performance as a function of modularity would provide the cognitive performance function, e.g. Fig. 8a or d, for this particular task. Perhaps the cognitive performance function will peak at different values of modularity for different tasks. It has been suggested that cognitive processes which are fast are more modular than those which are slow [16]. The results in Fig. 8 show why this is the case: modular networks provide better performance at short times (Fig. 8b or e), but less modular networks can provide better performance at long times (Fig. 8c or f). Measurements of cognitive performance for high-level and low-level tasks would complement these results. We predict that performance curves as a function of time will cross for subject samples with different values of modularity, as in Fig. 8a.
5.2. Modularity as a Biomarker
A biomarker for brain function may be developed from modularity. For example, modularity of neural activity in epileptic patients is less than that in normal subjects [15]. Anecdotal evidence [55] suggests that neural activity in patients with traumatic brain injury (TBI) is less modular than that in healthy subjects. Thus, we predict that background neural activity in the brains of TBI patients will be less modular than that of healthy subjects. If so, modularity may be useful to quantify the extent of TBI, which is currently difficult to determine. Effectiveness of treatment is also difficult to quantify, and measurements of modularity may be helpful to track progress of TBI rehabilitation treatments. Measurements of modularity may even be useful as feedback during treatment. Interestingly, modularity seems to increase in response to disease progression and reduced cognitive function in multiple sclerosis patients [56], perhaps because the system is compensating for increased stress due to reduced function with increased modularity [6].
Figure 5.
The correlation of modularity with Euclidean norm from AFNI (EN) for adults. The correlation is small and not significant, p-value = 0.32.
Table 2.
Quantification of modularity and module identity persistence with optimization of modularity.
| T | 〈Q〉 (adults) | 〈Q〉 (children) | (Number top areas in common with T = 0 case)/3 | (Number of bottom areas in common with T = 0 case)/3 |
|---|---|---|---|---|
| 0 | 0.4885 | 0.4237 | 1.00 | 1.00 |
| 0.01 | 0.4885 | 0.4237 | 1.00 | 0.65 |
| 0.05 | 0.4883 | 0.4233 | 0.97 | 0.62 |
| 0.10 | 0.4871 | 0.4220 | 0.86 | 0.60 |
Acknowledgments
We thank Jessica Cantlon for providing the fMRI, age, and IQ data [30]. This research was supported by the US National Institutes of Health under grant 1 R01 GM 100468–01.
Footnotes
PACS numbers: 87.19.lw, 87.19.lv, 89.75.Fb, 89.75.-k
References
- 1.Wagner GP, Altenberg L. Complex adaptations and the evolution of evolvability. Evolution. 1996;50:967–976. doi: 10.1111/j.1558-5646.1996.tb02339.x. [DOI] [PubMed] [Google Scholar]
- 2.Lipson H, Pollack JB, Suh NP. On the origin of modular variation. Evolution. 2002;56:1549–1556. doi: 10.1111/j.0014-3820.2002.tb01466.x. [DOI] [PubMed] [Google Scholar]
- 3.Kashtan N, Alon U. Spontaneous evolution of modularity and network motifs. Proc Natl Acad Sci USA. 2005;102:13773–13778. doi: 10.1073/pnas.0503610102. [DOI] [PMC free article] [PubMed] [Google Scholar]
- 4.Kashtan N, Noor E, Alon U. Varying environments can speed up evolution. Proc Natl Acad Sci USA. 2007;104:13711–13716. doi: 10.1073/pnas.0611630104. [DOI] [PMC free article] [PubMed] [Google Scholar]
- 5.Sun J, Deem MW. Spontaneous emergence of modularity in a model of evolving individuals. Phys Rev Lett. 2007;99:228107. doi: 10.1103/PhysRevLett.99.228107. [DOI] [PubMed] [Google Scholar]
- 6.Lorenz DM, Jeng A, Deem MW. The emergence of modularity in biological systems. Phys Life Rev. 2011;8:129–160. doi: 10.1016/j.plrev.2011.02.003. [DOI] [PMC free article] [PubMed] [Google Scholar]
- 7.Callahan B, Thattai M, Shraiman BI. Emergent gene order in a model of modular polyketide synthases. Proc Natl Acad Sci USA. 2009;106:19410–19415. doi: 10.1073/pnas.0902364106. [DOI] [PMC free article] [PubMed] [Google Scholar]
- 8.Mountcastle VB. The Neurosciences Fourth Study Program. MIT Press; 1979. An organizing princple for cerebral function: The unit module and the distributed system; pp. 21–42. [Google Scholar]
- 9.Fodor J. The Modularity of Mind. MIT Press; 1983. [Google Scholar]
- 10.Shirer WR, Ryali S, Rykhlevskaia E, Menon V, Greicius MD. Decoding subject-driven cognitive states with whole-brain connectivity patterns. Cerebral Cortex. 2012;22:158–165. doi: 10.1093/cercor/bhr099. [DOI] [PMC free article] [PubMed] [Google Scholar]
- 11.Schwarz AJ, Gozzi A, Bifone A. Community structure and modularity in networks of correlated brain activity. Magnetic Resonance Imaging. 2008;26:914–920. doi: 10.1016/j.mri.2008.01.048. [DOI] [PubMed] [Google Scholar]
- 12.Ferrarnini L, et al. Hierarchical functional modularity in the resting-state human brain. Human Brain Mapping. 2009;30:2220–2231. doi: 10.1002/hbm.20663. [DOI] [PMC free article] [PubMed] [Google Scholar]
- 13.Meunier D, Achard S, Morcom A, Bullmore E. Age-related changes in modular organization of human brain functional networks. NeuroImage. 2009;44:715–723. doi: 10.1016/j.neuroimage.2008.09.062. [DOI] [PubMed] [Google Scholar]
- 14.He Y, et al. Uncovering intrinsic modular organization of spontaneous brain activity in humans. PLoS ONE. 2009;4:e5226. doi: 10.1371/journal.pone.0005226. [DOI] [PMC free article] [PubMed] [Google Scholar]
- 15.Chavez M, Valencia M, Navarro V, Latora V, Martinerie J. Functional modularity of background activities in normal and epileptic brain networks. Phys Rev Lett. 2010;104:118701. doi: 10.1103/PhysRevLett.104.118701. [DOI] [PubMed] [Google Scholar]
- 16.Meunier D, Lambiotte R, Bullmore ET. Modular and hierarchically modular organization of brain networks. Front Neurosci. 2010;4:200. doi: 10.3389/fnins.2010.00200. [DOI] [PMC free article] [PubMed] [Google Scholar]
- 17.Rubinov M, et al. Symbiotic relationship between brain structure and dynamics. BMC Neurosci. 2009;10:55. doi: 10.1186/1471-2202-10-55. [DOI] [PMC free article] [PubMed] [Google Scholar]
- 18.Hermundstad AH, et al. Structural foundations of resting-state and task-based functional connectivity in the human brain. Proc Natl Acad Sci USA. 2013;110:6169–6174. doi: 10.1073/pnas.1219562110. [DOI] [PMC free article] [PubMed] [Google Scholar]
- 19.Onoda K, Yamaguchi S. Small-worldness and modularity of the resting-state functional brain network decrease with aging. Neurosci Lett. 2013;556:104–108. doi: 10.1016/j.neulet.2013.10.023. [DOI] [PubMed] [Google Scholar]
- 20.Fair DA, et al. The maturing architecture of the brain’s default network. Proc Natl Acad Sci USA. 2008;105:4028–4032. doi: 10.1073/pnas.0800376105. [DOI] [PMC free article] [PubMed] [Google Scholar]
- 21.Satterthwaite TD, et al. Functional maturation of the executive system during adolescence. J Neurosci. 2013;33:16249–1626. doi: 10.1523/JNEUROSCI.2345-13.2013. [DOI] [PMC free article] [PubMed] [Google Scholar]
- 22.Dosenbach NUF, et al. Prediction of individual brain maturity using fMRI. Science. 2010;329:1358–1361. doi: 10.1126/science.1194144. [DOI] [PMC free article] [PubMed] [Google Scholar]
- 23.Fair DA, et al. Functional brain networks develop from a ‘local to distributed’ organization. PLoS Comput Biol. 2009;5:e1000381. doi: 10.1371/journal.pcbi.1000381. [DOI] [PMC free article] [PubMed] [Google Scholar]
- 24.Karbach J, Kray J. How useful is executive control training? age differences in near and far transfer of task-switching training. Develop Sci. 2009;12:978–990. doi: 10.1111/j.1467-7687.2009.00846.x. [DOI] [PubMed] [Google Scholar]
- 25.Stevens AA, Tappon SC, Garg A, Fair DA. Functional brain network modularity captures inter- and intra-individual variation in working memory capacity. PLoS ONE. 2012;7:e30468. doi: 10.1371/journal.pone.0030468. [DOI] [PMC free article] [PubMed] [Google Scholar]
- 26.Satterthwaite TD, et al. Impact of in-scanner head motion on multiple measures of functional connectivity: Relevance for studies of neurodevelopment in youth. NeuroImage. 2012;60:623–632. doi: 10.1016/j.neuroimage.2011.12.063. [DOI] [PMC free article] [PubMed] [Google Scholar]
- 27.Satterthwaite TD, et al. Heterogeneous impact of motion on fundamental patterns of developmental changes in functional connectivity during youth. NeuroImage. 2013;83:45–57. doi: 10.1016/j.neuroimage.2013.06.045. [DOI] [PMC free article] [PubMed] [Google Scholar]
- 28.Van Dijk KRA, Sabuncu MR, Buckner RL. The influence of head motion on intrinsic functional connectivity MFI. NeuroImage. 2012;59:431–438. doi: 10.1016/j.neuroimage.2011.07.044. [DOI] [PMC free article] [PubMed] [Google Scholar]
- 29.Power JD, et al. Spurious but systematic correlations nin functional connectivity MFI networks arise from subject motion. NeuroImage. 2012;59:2142– 2154. doi: 10.1016/j.neuroimage.2011.10.018. [DOI] [PMC free article] [PubMed] [Google Scholar]
- 30.Cantlon JF, Li R. Neural activity during natural viewing of sesame street statistically predicts test scores in early childhood. PLoS Biology. 2013;11:e1001462. doi: 10.1371/journal.pbio.1001462. [DOI] [PMC free article] [PubMed] [Google Scholar]
- 31.Cox RW. AFNI: Software for analysis and visualization of functional magnetic resonance neuroimages. Comput Biomed Res. 1996;29:162–173. doi: 10.1006/cbmr.1996.0014. [DOI] [PubMed] [Google Scholar]
- 32.Talairach J, Tournoux P. Co-planar stereotaxic atlas of the human brain. Thieme; 1988. [Google Scholar]
- 33.Fortunato S. Community detection in graphs. Phys Rep. 2010;486:75–174. [Google Scholar]
- 34.Nolte J. Nolte’s The Human Brain: An Introduction to its Functional Anatomy. 6. New York: Mosby; 2008. [Google Scholar]
- 35.Newman MEJ. Modularity and community structure in networks. Proc Natl Acad Sci USA. 2006;103:8577–8582. doi: 10.1073/pnas.0601602103. [DOI] [PMC free article] [PubMed] [Google Scholar]
- 36.Hopfield JJ. Neural networks and physical systems with emergent collective computational abilities. Proc Natl Acad Sci USA. 1982;79:2554–2558. doi: 10.1073/pnas.79.8.2554. [DOI] [PMC free article] [PubMed] [Google Scholar]
- 37.FitzHugh R. Impulses and physiological states in theoretical models of nerve membrane. Biophysical J. 1961;1:445–466. doi: 10.1016/s0006-3495(61)86902-6. [DOI] [PMC free article] [PubMed] [Google Scholar]
- 38.Nagumo J, Arimoto S, Yoshizawa S. An active pulse transmission line simulating nerve axon. Proc IRE. 1962;50:2061–2070. [Google Scholar]
- 39.Wang XJ, Buzsáki G. Gamma oscillation by synaptic inhibition in a hippocampal interneuronal network model. J Neurosci. 1996;16:6402–6413. doi: 10.1523/JNEUROSCI.16-20-06402.1996. [DOI] [PMC free article] [PubMed] [Google Scholar]
- 40.Buzsáki G, Wang XJ. Mechanisms of gamma oscillations. Ann Rev Neurosci. 2012;35:203–225. doi: 10.1146/annurev-neuro-062111-150444. [DOI] [PMC free article] [PubMed] [Google Scholar]
- 41.Rubinov M, et al. Neurobiologically realistic determinants of self-organized criticality in networks of spiking neurons. PLoS Comput Biol. 2011;7:e1002038. doi: 10.1371/journal.pcbi.1002038. [DOI] [PMC free article] [PubMed] [Google Scholar]
- 42.Ogawa S, Lee TM, Nayak AS, Glynn P. Oxygenation-sensitive contrast in magnetic resonance image of rodent brain at high magnetic fields. Magnetic Resonance in Medicine. 1990;14:68–78. doi: 10.1002/mrm.1910140108. [DOI] [PubMed] [Google Scholar]
- 43.Pradhan N, Dasgupta S, Sinha S. Modular organization enhances the robustness of attractor network dynamics. Euro Phys Lett. 2011;94:38004. [Google Scholar]
- 44.Amit DJ. Modeling Brain Function. Cambridge: Cambridge University Press; 1989. [Google Scholar]
- 45.Deem MW. Statistical mechanics of modularity and horizontal gene transfer. Ann Rev Cond Matt Phys. 2013;4:287–311. [Google Scholar]
- 46.Park JM, Niestemski LR, Deem MW. Quasispecies theory for evolution of modularity. 2014. ArXiv:1211.5646. [DOI] [PMC free article] [PubMed] [Google Scholar]
- 47.Leech R, Braga R, Sharp DJ. Echoes of the brain within the posterior cingulate cortex. J Neurosci. 2013;32:215–222. doi: 10.1523/JNEUROSCI.3689-11.2012. [DOI] [PMC free article] [PubMed] [Google Scholar]
- 48.Nielsen FA, Balslev D, Hansen LK. Mining the posterior cingulate: segregation between memory and pain components. Neuroimage. 2005;27:520–532. doi: 10.1016/j.neuroimage.2005.04.034. [DOI] [PubMed] [Google Scholar]
- 49.Kozlovskiy SA, Vartanov AV, Nikonova EY, Pyasik MM, Velichkovsky BM. The cingulate cortex and human memory processes. Psychology in Russia: State of the Art. 2012;5:231–243. [Google Scholar]
- 50.Cavanna EA, Trimble MR. The precuneus: A review of its functional anatomy and behavioral correlates. Brain. 2006;129:564–583. doi: 10.1093/brain/awl004. [DOI] [PubMed] [Google Scholar]
- 51.Parvizi J, Hoesen GWV, Buckwalter J, Damasio A. Neural connections of the posteromedial cortex in the macaque. Proc Natl Acad Sci USA. 2006;103:1563–1568. doi: 10.1073/pnas.0507729103. [DOI] [PMC free article] [PubMed] [Google Scholar]
- 52.Chiron C, Jambaque I, Nabbout R, Lounes R, Syrota1 A, Dulac O. The right brain hemisphere is dominant in human infants. Brain. 1997;120:1057–1065. doi: 10.1093/brain/120.6.1057. [DOI] [PubMed] [Google Scholar]
- 53.Stoeckel C, Cougn PM, Watkins KE, Devlin JT. Supramarginal gyrus involvement in visual word recognition. Cortex. 2009;45:1091–1095. doi: 10.1016/j.cortex.2008.12.004. [DOI] [PMC free article] [PubMed] [Google Scholar]
- 54.Technologies TC. Cortical Function Reference. 2012. [Google Scholar]
- 55.Leclercq M, et al. Dual task performance after severe diffuse traumatic brain injury or vascular prefrontal damage. J Clin Exper Neuropsychol. 2000;22:339–350. doi: 10.1076/1380-3395(200006)22:3;1-V;FT339. [DOI] [PubMed] [Google Scholar]
- 56.Gamboa OL, et al. Working memory performance of early ms patients correlates inversely with modularity increases in resting state functional connectivity networks. NeuroImage. 2014;94:385–395. doi: 10.1016/j.neuroimage.2013.12.008. http://dx.doi.org/10.1016/j.neuroimage.2013.12.008. [DOI] [PubMed] [Google Scholar]


