Abstract
We have recently reported that ROCK1 deficiency in mouse embryonic fibroblasts (MEF) has superior anti-apoptotic and pro-survival effects than antioxidants against doxorubicin, a chemotherapeutic drug. Although oxidative stress is the most widely accepted mechanism, our studies suggest that ROCK1-dependent actin cytoskeleton remodeling plays a more important role in mediating doxorubicin cytotoxicity on MEFs. To further explore the contributions of ROCK1-dependent actin cytoskeleton remodeling in response to stress, this study investigates the mechanistic differences between the cytotoxic effects of doxorubicin versus hydrogen peroxide (H2O2), with a focus on cytoskeleton alterations, apoptosis and necrosis induction. We found that both types of stress induce caspase activation but with different temporal patterns and magnitudes in MEFs: H2O2 induces the maximal levels (2 to 4-fold) of activation of caspases 3, 8, and 9 within 4 h, while doxorubicin induces much higher maximal levels (15 to 25-fold) of caspases activation at later time points (16–24 h). In addition, necrosis induced by H2O2 reaches maximal levels within 4 h while doxorubicin-induced necrosis largely occurs at 16–24 h secondary to apoptosis. Moreover, both types of stress induce actin cytoskeleton remodeling but with different characteristics: H2O2 induces disruption of stress fibers associated with cytosolic translocation of phosphorylated myosin light chain (p-MLC) from stress fibers, while doxorubicin induces cortical F-actin formation associated with cortical translocation of p-MLC from central stress fibers. Furthermore, N-acetylcysteine (an antioxidant) is a potent suppressor for H2O2-induced cytotoxic effects including caspase activation, necrosis, and cell detachment, but shows a much reduced inhibition on doxorubicin-induced changes. On the other hand, ROCK1 deficiency is a more potent suppressor for the cytotoxic effects induced by doxorubicin than by H2O2. These results support the notion that doxorubicin induces caspase activation, necrosis, and actin cytoskeleton alterations largely through ROCK1-dependent and oxidative stress-independent pathways.
Introduction
The undesirable toxicity of chemotherapeutic agents to normal tissues affects their therapeutic efficiency. Doxorubicin, a good example, is used to treat a wide spectrum of hematologic malignancies and solid tumors. However, the dose of doxorubicin needs to be closely monitored as it can cause life-threatening cardiotoxicity [1–5]. The mechanisms of doxorubicin-induced cytotoxicity to normal cells have been under intense investigation for many years [4–13]. Reactive oxygen species (ROS) generated by doxorubicin has been the most studied cause of cardiotoxicity, and is believed to act as a major trigger for several forms of cell death including apoptosis, necrosis, and autophagy [4–17]. However, clinical trials of antioxidant therapy showed insufficient beneficial effects [18,19], and the reasons for this under-expected outcome are still unclear.
In addition to generating free radicals, doxorubicin also affects actin cytoskeleton stability via inhibition of actin polymerization [20,21]. We have recently reported that ROCK1 plays an important role in stress fiber disassembly induced by doxorubicin leading to impaired cell adhesion and apoptosis in mouse embryonic fibroblasts (MEFs) [22,23]. At the molecular level, we observed that ROCK1 increases myosin light chain (MLC) phosphorylation and peripheral actomyosin contraction [22,23]. ROCK is the central regulator of the actin cytoskeleton downstream of small GTPase RhoA [24–33]. The two ROCKs, ROCK1 and ROCK2, encoded by distinct genes, are highly homologous with an overall amino acid sequence identity of 65% [24–26]. Our recent studies reveal that ROCK1 deficiency (but not ROCK2 deficiency) in MEFs not only exhibits greater protective effects than antioxidants, but also significantly increases the beneficial effects of antioxidants against doxorubicin-induced cytotoxicity including apoptosis and cell detachment [34]. These studies suggest that ROCK1-dependent actin cytoskeleton remodeling plays a more important role than ROS generation in mediating doxorubicin cytotoxicity, at least in MEFs.
To further explore the contribution of actin cytoskeleton alterations to doxorubicin-induced cytotoxicity, this study compares the cytotoxic effects induced by doxorubicin versus those induced by hydrogen peroxide (H2O2), one of the most frequently used oxidative stresses in cell biology. We found that both H2O2 and doxorubicin induce caspase activation, necrosis, actin cytoskeleton remodeling, and increased intracellular ROS levels in MEFs but with significantly different characteristics. Furthermore, N-acetylcysteine (NAC), an antioxidant, is a more potent suppressor for H2O2-induced than doxorubicin-induced cytotoxic effects, while ROCK1 deficiency has more potent inhibitory effects on doxorubicin-induced than H2O2-induced cytotoxicity. These results support the notion that doxorubicin induces actin cytoskeleton alterations, caspase activations, and necrosis largely through ROS-independent and ROCK1-dependent pathways.
Results
H2O2 and doxorubicin induce caspase activation with different temporal patterns and magnitudes in MEFs
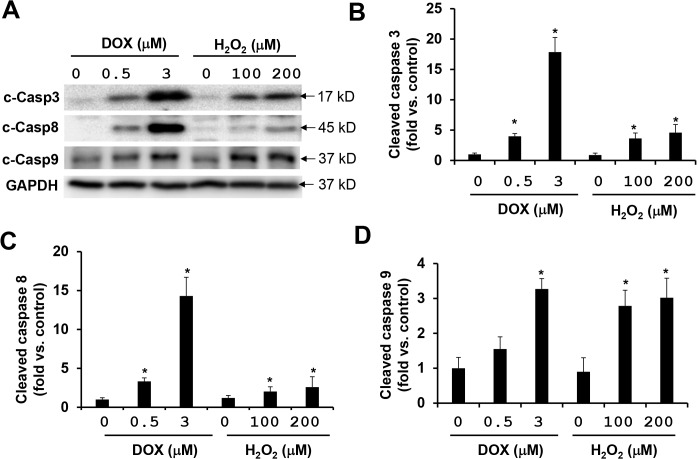
It is believed that ROS generation induced by doxorubicin plays an important role in caspase activations, and the caspases serve as the primary mediators of apoptosis. Cleaved caspase 3 is a central marker for the activation of the caspase cascades, which are the results of the activation of either extrinsic pathway involving caspase 8, or intrinsic mitochondrial pathway involving caspase 9. We previously observed that antioxidants NAC and diphenyleneiodonium (an inhibitor of NADPH oxidase) inhibit doxorubicin-induced activations of caspases 3, 8, and 9 by only 20–30% in MEFs while ROCK1 deficiency inhibits 70–80% of them [34]. This suggests that ROS-independent pathways play a predominant role in mediating the pro-apoptotic effects of doxorubicin. To further test this hypothesis, we compared the effects of H2O2 and doxorubicin on caspase activations in MEFs. In a dose-dependent study, we observed that the increased activation levels (2 to 4-fold) of caspase 3 and caspase 8 induced by 100 or 200 μM of H2O2 were significantly lower than those (15 to 25-fold) induced by 3 μM of doxorubicin after 16 h of treatment (Fig 1A–1C). Caspase 9 activation levels were comparable for these two inducers (Fig 1A and 1D). In addition, neither increasing nor decreasing the concentrations of H2O2 could further change the activation level of caspases 3, 8, and 9 (Fig A in S1 Fig) indicating that the H2O2 concentration ranges of 100 to 200 μM generate near maximum for caspase activations in MEFs. On the other hand, increasing doxorubicin up to 5–10 μM can further increase caspase 3, 8, and 9 activation (Fig B in S1 Fig).
Fig 1. Doxorubicin is more potent than H2O2 at inducing caspase activation.
(A)Representative image showing a Western blot of cleaved caspases 3, 8, and 9 in cell lysates from attached WT MEFs treated with H2O2 or doxorubicin at indicated concentrations for 16 h. Equal amount of proteins were loaded. (B-D) Quantitative analysis of immunoreactive bands of cleaved caspases 3, 8, and 9 expressed as fold change relative to WT control. n = 4–6 for each condition. * P < 0.05 vs. control.
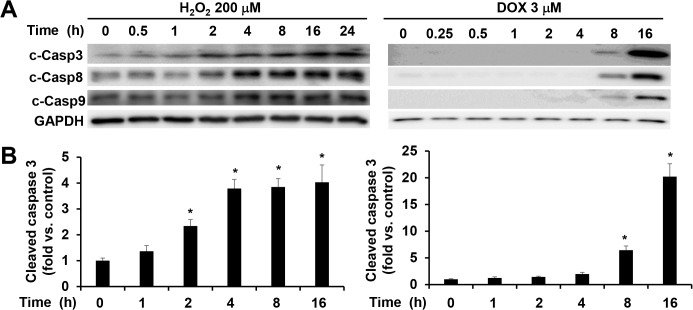
In addition to the different levels of activations, the temporal patterns of the caspase activations were also different for H2O2 and doxorubicin treatments. The maximal levels of activation of caspases 3, 8, and 9 induced by 200 μM of H2O2 were reached within 4 h and no further increases were observed up to 24 h of treatment (Fig 2). In comparison, the activation of these caspases was detectable at 8 h after receiving 3 μM of doxorubicin treatment and continuously increased till reaching a plateau at 16 h (Fig 2, data at 24 h were similar to those at 16 h, S2 Fig). These results indicate that doxorubicin is a more potent inducer of caspase activation than H2O2, especially for caspase 3 and caspase 8.
Fig 2. Different time courses of caspase activation by H2O2 versus doxorubicin.
(A) Representative image of Western blot of cleaved caspases 3, 8, and 9 in cell lysates from attached WT MEFs treated with 200 μM of H2O2 or 3 μM of doxorubicin at different time points as indicated. Equal amount of proteins were loaded. (B) Quantitative analysis of immunoreactive bands of cleaved caspase 3 expressed as fold change relative to WT control. n = 4–6 for each condition. * P < 0.05 vs. control.
It is worth noting that the time window for doxorubicin to induce caspase activation (8 to 24 h) in WT MEF cells (Figs 1 and 2) is consistent with our previous observation in neonatal mouse ventricles which also showed a marked increase of caspase 3 activation at 8 h after doxorubicin injection [35].
NAC is a potent suppressor for H2O2-induced caspase activations, but has limited effect on doxorubicin-induced caspase activation
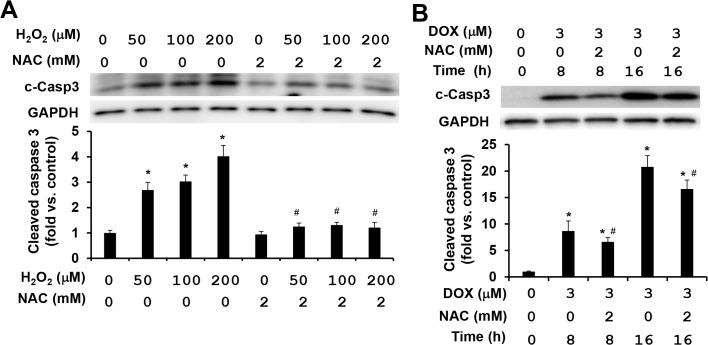
NAC, an analog and precursor of glutathione, has been used in the clinical practice for many decades with well characterized molecular mechanisms [36,37]. Because the time needed reaching the plateau of caspases 3, 8, and 9 activations was different under H2O2 and doxorubicin treatments (Fig 2), we assessed the effects of NAC on caspase activations in MEFs after 4 h of H2O2 treatment and 8 or 16 h of doxorubicin treatment. As expected, the treatment with 2 mM of NAC completely suppressed H2O2-induced caspase activations (Fig 3A). In contrast, the treatment with the same concentration of NAC exhibited only a partial reduction of less than 30% on doxorubicin-induced caspase 3 activation (Fig 3B). In addition to the treatment mentioned above, increasing NAC concentrations from 2 to 10 mM, or decreasing doxorubicin concentrations from 3 to 1 μM, the limited effects of NAC on doxorubicin-induced caspase activation were still persistent (<30%) (S3 Fig). These results indicate that doxorubicin-induced caspase activations are largely mediated by ROS-independent mechanisms.
Fig 3. NAC attenuates H2O2-induced caspase activation, but shows limited effect on doxorubicin-induced caspase activation.
(A) Representative image (top) and quantitative analysis (bottom) of Western blot of cleaved caspase 3 in cell lysates from attached WT MEFs treated with increasing concentrations of H2O2 and/or 2 mM NAC for 4 h. Equal amount of proteins was loaded. (B) Representative image (top) and quantitative analysis (bottom) of Western blot of cleaved caspase 3 in cell lysates from attached WT MEFs treated with 3 μM doxorubicin and/or 2 mM NAC for 8 or 16 h. n = 4–6 for each condition. * P < 0.05 vs. control. # P < 0.05 vs. H2O2 or doxorubicin only condition.
H2O2 and doxorubicin induce actin cytoskeleton remodeling with different characteristics
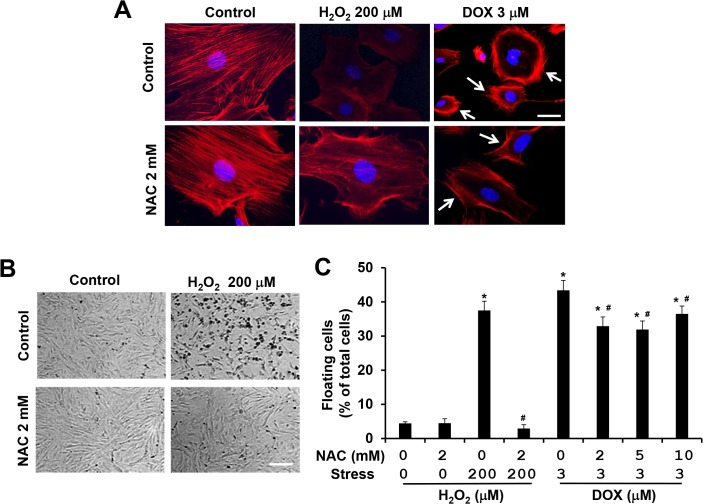
Our previous studies revealed that doxorubicin induces actin cytoskeleton remodeling with the formation of a cortical contractile ring at the cell periphery and the disruption of central stress fibers, resulting in impaired cell adhesion and increased cell detachment [22,23] (Fig 4A and 4C). Different from doxorubicin-induced actin cytoskeleton alterations, treatment with H2O2 at 200 μM for 4 h did not induce cortical actin formation; instead, stress fiber formation was homogenously reduced (Fig 4A). Consistent with this finding, H2O2 treatment impaired cell adhesion and increased cell detachment (Fig 4B and 4C). Moreover, co-treatment with 2 mM of NAC completely suppressed the disruption of actin cytoskeleton and cell detachment induced by 200 μM of H2O2 (Fig 4A–4C). On the other hand, co-treatment with 2 mM of NAC and 3 μM of doxorubicin did not suppress the disruption of central stress fibers, but slightly reduced the formation of cortical actin (Fig 4A) resulting in partial inhibition (<30%) of cell detachment (Fig 4C). These results indicate that H2O2 and doxorubicin induce actin cytoskeleton alterations through different mechanisms in MEFs.
Fig 4. NAC attenuates H2O2-induced disruption of actin cytoskeleton and cell detachment, but shows limited effect on doxorubicin-induced actin cytoskeleton alteration and cell detachment.
(A) Representative images of rhodamine-phalloidin staining for F-actin (red) and DAPI for nucleus (blue) of WT MEFs treated with 200 μM of H2O2 and/or 2 mM NAC for 4 h or with 3 μM of doxorubicin and/or 2 mM NAC for 8 h. Cells showing enriched cortical actin cytoskeleton are indicated with white arrows. Bar, 25 μm. (B) Representative images of bright field photography of WT MEFs treated with 200 μM of H2O2 and/or 2 mM NAC for 16 h showing H2O2-induced cell detachment. Bar, 400 μm. (C) Both floating and attached cells were collected after 16 h treatment with 200 μM of H2O2 and/or 2 mM NAC. Both floating and attached cells were also collected after 16 h treatment with 3 μM doxorubicin and/or increasing concentration of NAC as indicated. Floating cell ratio was expressed as percentage of total cells (floating plus attached cells) under each treatment condition. * P < 0.05 vs. control. # P < 0.05 vs. H2O2 or doxorubicin only condition.
ROCK1 deletion is a potent suppressor for doxorubicin-induced actin cytoskeleton remodeling and cell detachment, but shows minor effects on H2O2-induced cell detachment
We have revealed that the deletion of ROCK1 in MEFs reduces doxorubicin-induced actin cytoskeleton alterations and cell detachment, and significantly improved cell viability [22,23] (Fig 5A–5C). To examine the impact of ROCK1 deficiency on H2O2-induced actin cytoskeleton remodeling, we performed F-actin staining and cell detachment assays in WT and ROCK1 -/- MEFs after H2O2 treatment at the concentrations of 100, 200, and 300 μM, and at different time points. The ROCK1 deletion had insignificant effects on H2O2-induced actin cytoskeleton disruption. Fig 5A shows representative images observed in WT and ROCK1 -/- MEFs treated with 200 μM H2O2 for 4 h. Comparing the 16 h of treatment effects between H2O2 and doxorubicin, ROCK1 -/- MEFs demonstrated about 25% reduction in cell detachment induced by 200 μM H2O2, and about a 60% reduction induced by 3 μM doxorubicin (Fig 5B). Consistently, ROCK1 deletion had a smaller impact on cell viability in H2O2 treatment than in doxorubicin treatment as measured by 3-(4,5-dimethylthiazol-2-yl)-2,5-diphenyltetrazolium bromide (MTT) assay (Fig 5C). These results reveal that ROCK1 deficiency provides considerably more effective protection from doxorubicin-induced cytotoxicity than H2O2-induced cytotoxicity.
Fig 5. ROCK1 deletion has limited effects on H2O2-induced disruption of actin cytoskeleton, cell detachment and cell death.
(A) Representative images of stained F-actin (red) and nucleus (blue) in WT and ROCK1 -/- MEFs treated with 200 μM of H2O2 for 4 h or with 3 μM of doxorubicin for 8 h. Cells showing enriched cortical actin cytoskeleton are indicated with white arrows. Bar, 25 μm. (B) Both floating and attached WT and ROCK1 -/- MEFs were collected after 16 h treatment with increasing concentrations of H2O2 as indicated. Both floating and attached cells were also collected after 16 h treatment with 1 or 3 μM doxorubicin. Floating cell ratio was expressed as percentage of total cells (floating plus attached cells) under each treatment condition. (C) MTT assay was performed on WT and ROCK1 -/- MEFs treated with increasing concentrations of H2O2 or with 1–3 μM doxorubicin for 16 h. Cell viability was expressed as percentage of control cells without treatment. * P < 0.05 vs. control of the same genotype. # P < 0.05 vs. WT under the same treatment condition.
Phosphorylated MLC2 is a critical component of stress fibers and co-localized with F-actin on stress fibers under control conditions in ROCK1 -/- and WT MEFs (Fig 6). To further examine the effects of H2O2 and doxorubicin on actin cytoskeleton remodeling, we performed immunochemistry to stain p-MLC2 in WT and ROCK1 -/- MEFs which were treated with 3 μM of doxorubicin or 200 μM of H2O2. We found that in WT MEFs, doxorubicin and H2O2 had different impacts on p-MLC2 staining in MEFs: in doxorubicin treatment, p-MLC2 was reduced in the central stress fibers and translocated to the thick stress fibers on the cell periphery, but in H2O2 treatment, p-MLC2 was dissociated from both central and cortical stress fibers, and translocated to the cytosol (Fig 6). Compared with WT MEFs, ROCK1 deficient MEFs showed reduced translocation of p-MLC2 from central stress fibers to cortical stress fibers after doxorubicin treatment, however similar translocation of p-MLC2 from stress fibers to the cytoplasm in H2O2 treatment occurred in ROCK1 deficient MEFs (Fig 6).
Fig 6. H2O2 and doxorubicin treatments show different alteration on MLC phosphorylation.
Representative images of F-actin staining (red), p-MLC (green), and nucleus (blue) in WT and ROCK1 -/- MEFs treated with 200 μM of H2O2 for 4 h or with 3 μM of doxorubicin for 8 h. Cells showing enriched cortical p-MLC staining are indicated with white arrows. Bar, 25 μm. Doxorubicin induces an increase in p-MLC translocation to cortical actin cytoskeleton in WT MEFs but to a much smaller extent in ROCK1 -/- MEFs. WT and ROCK1 -/- MEFs treated with H2O2 both show diffused cytoplasmic p-MLC staining.
After a short time period of H2O2 treatment (from 2 to 4 h), p-MLC was heterogeneously located in the cytosol, the pattern could be high or low in individual MEF (Fig 6). However when treatment lasted from 6 to 8 h, the pattern became homogenously low (S4 Fig). On the other hand, cortical translocation of p-MLC in WT MEFs after doxorubicin treatment was most noticeable at 8 h before the peak of cortical actin ring formation at 16 h. In addition, co-treatment with 1 μM of blebbistatin, a direct inhibitor of myosin II ATPase, inhibited doxorubicin-induced cell detachment as previously reported [22], however it increased H2O2-induced cell detachment (S5 Fig). Together, these results indicate that doxorubicin and H2O2 induce different subcellular translocation of p-MLC resulting in different actin cytoskeleton alterations: Increased cortical actomyosin contraction, which is ROCK1 dependent, contributes to doxorubicin-induced cell detachment; while reduced actomyosin contraction and disruption of the actin cytoskeleton, which is independent of ROCK1, contributes to H2O2-induced cell detachment.
ROCK1 deletion is a potent suppressor for doxorubicin-induced apoptosis and necrosis, and only inhibits H2O2-induced necrosis but not apoptosis
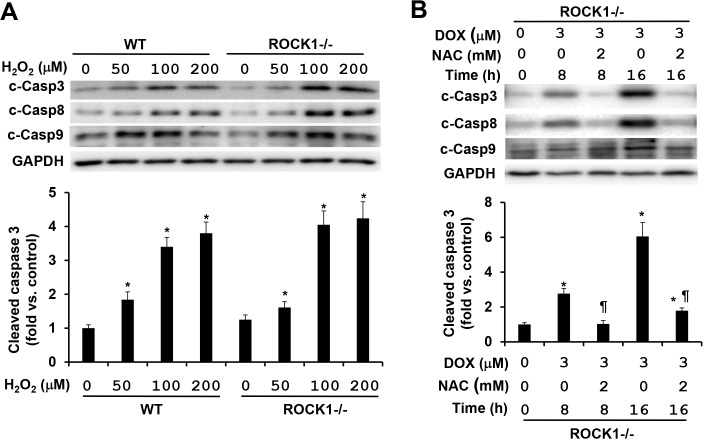
To further validate the notion that different mechanisms mediate the cytotoxic effects induced by doxorubicin and H2O2, we examined the effects of ROCK1 deletion on caspase activations induced by these two stresses. As previously described [22], ROCK1 deletion efficiently reduced the activations of caspases 3, 8, and 9 by more than 70% in the treatment of 3 μM doxorubicin for 16 h: the maximal levels of caspases 3 and 8 activations were in the range of 4–6 folds in ROCK1 -/- MEFs (Fig 7B) versus 15–25 folds in WT MEFs (Fig 2). Efficient inhibition by ROCK1 deletion on doxorubicin-induced caspase activations could be observed in a dose-dependent study (0.5 to 10 μM) and a time-course study (8 to 24 h) (S6 Fig). Moreover, NAC treatment was more effective in reducing caspase activations in ROCK1 -/- MEFs compared to WT MEFs: NAC at 2 mM reduced doxorubicin-induced caspase 3 activation by more than 70% in ROCK1 -/- MEFs (Fig 7B), but less than 30% in WT MEFs (Fig 3B) supporting the additive protection of NAC and ROCK1 deletion. On the other hand, ROCK1 deletion had no apparent effect on H2O2-induced caspase activation, our data showed similar levels of caspase activations between ROCK1 deletion and WT MEFs after 4 h of H2O2 treatment with different concentrations from 50 to 200 μM (Fig 7A). These results indicate that H2O2-induced caspase activation is mediated by ROCK1-independent mechanisms.
Fig 7. ROCK1 deletion has no inhibition on H2O2-induced caspase activation.
(A). Representative image of Western blot of cleaved caspases 3, 8, and 9 (top) and quantitative analysis (bottom) of Western blot of cleaved caspase 3 in cell lysates from attached WT and ROCK1 -/- MEFs treated with increasing concentrations of H2O2 for 4 h. Equal amount of proteins was loaded. (B) Representative image of Western blot of cleaved caspases 3, 8, and 9 (top) and quantitative analysis (bottom) of Western blot of cleaved caspase 3 in cell lysates from attached ROCK1 -/- MEFs treated with 3 μM doxorubicin and/or 2 mM NAC for 8 or 16 h. Similar experiments performed with the WT MEFs were presented in Fig 3B. n = 4–6 in each condition. * P < 0.05 vs. control of the same genotype. # P < 0.05 vs. WT under the same treatment condition. ¶ P < 0.05 vs. the same genotype under doxorubicin only condition.
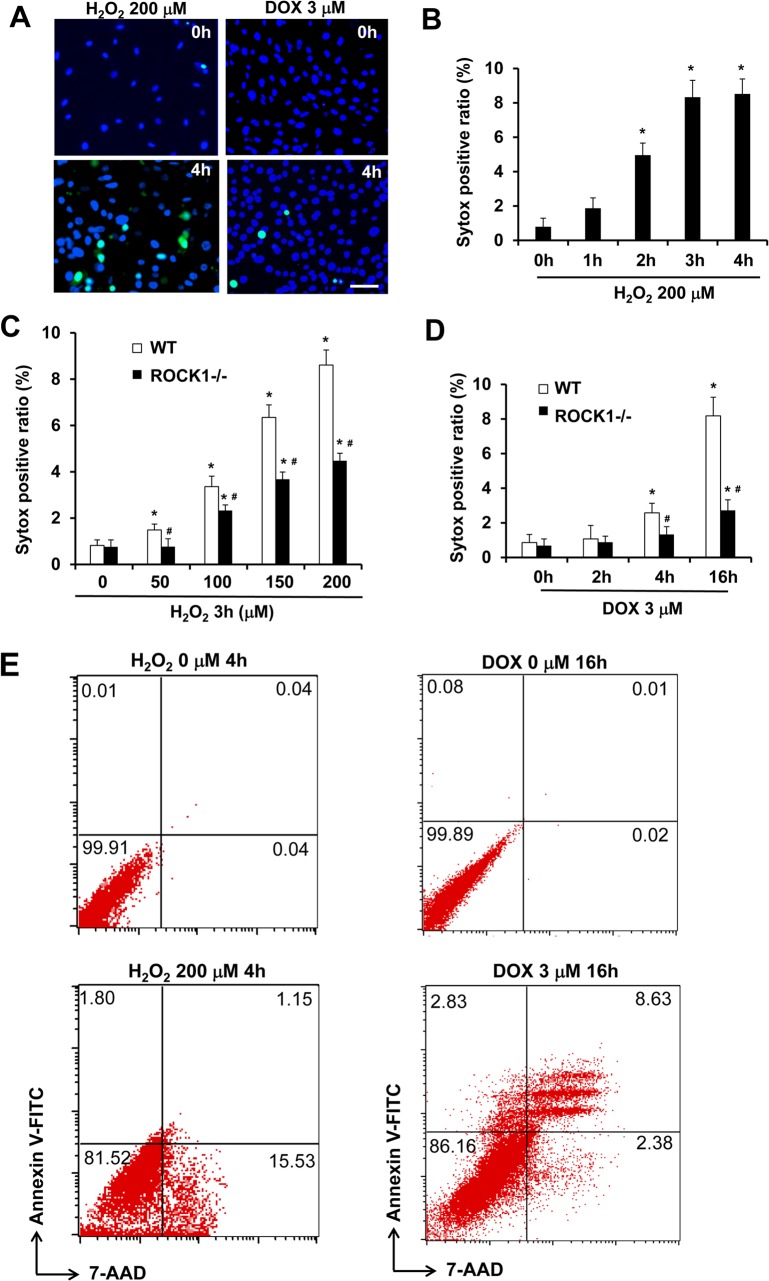
In addition to apoptosis, it has been reported that necrotic cell death also contributes to doxorubicin or H2O2 cytotoxicity [38,39]. We assessed early necrotic cell death induced by these two stresses within 4 h of treatment by measuring cellular uptake of Sytox Green dye, which is cell membrane impermeable in live cells but permeable in necrotic cells due to compromised cell membrane (Fig 8A). H2O2 treatment induced necrotic cell death in WT MEFs in a dose and time-dependent manner. The maximal levels of necrotic cell ratio were reached within 4 h (Fig 8B), and the time course of necrotic cell death is similar to that of caspase activation induced by H2O2 (Fig 2). The rate of necrosis increased when treated with H2O2 at 50 μM or higher and reached 8–10% at 200 μM H2O2. This dose-dependent increase of necrosis during the early time window (4 h) suggests that H2O2 treatment induces primary necrosis. To support this notion, double staining of annexin V and 7-AAD was performed in H2O2-treated cells followed by flow cytometry analysis, and the results showed that the majority of necrotic cells (7-AAD positive) were annexin V negative, therefore an event independent of apoptosis (Fig 8E). On the other hand, doxorubicin at 3 μM produced a much smaller scale of necrotic cell death, less than 3%, after 4 h, and reached 8–10% at 16 h (Fig 8D). Double staining of annexin V and 7-AAD followed by flow cytometry analysis showed that the majority of necrotic cells (7-AAD positive) were also annexin V positive (late apoptosis), suggesting that necrotic cell death largely occurs secondary to apoptosis after doxorubicin treatment. These results indicate that H2O2 is a stronger inducer for primary necrotic cell death than doxorubicin in MEFs. These results support that H2O2 and doxorubicin induce necrotic cell death through different mechanisms in MEFs.
Fig 8. ROCK1 deletion attenuates doxorubicin- and H2O2-induced necrotic cell death.
(A). Representative images of Sytox Green (Green) and Hoechst 33342 staining (blue) of WT MEFs treated with 200 μM of H2O2 or 3 μM doxorubicin for 0 or 4 h. Bar, 200 μm. (B-D) Necrotic cells measured by Sytox Green staining in attached WT and/or ROCK1 -/- MEFs at indicated time points and dosages of H2O2 and doxorubicin. The ratio of Sytox Green positive cells was expressed as percentage of attached cells. At least 10,000 cells were analyzed for each condition. * P < 0.05 vs. control of the same genotype. # P < 0.05 vs. WT under the same treatment condition. (E) Representative scatter plots of necrosis and apoptosis quantified by FACS analysis after staining with annexin V and 7-AAD in attached WT and ROCK1-/- cells collected after treatment for 4 h with 200 μM of H2O2 or 16 h with 3 μM doxorubicin. Viable cells are annexin V−/7-AAD−; annexin V+/7-AAD− cells are in early apoptosis; annexin V+/7-AAD+ cells are in late apoptosis; necrotic cells are annexin V−/7-AAD+. Necrotic cells induced by H2O2 are predominantly annexin V negative, whereas the majority of necrotic cells induced doxorubicin are annexin V positive (late apoptosis).
The quantitative analysis of necrosis induced by H2O2 was performed in parallel with ROCK1 -/- MEFs (Fig 8C). ROCK1 deficiency showed a significant reduction of necrotic cell ratio compared to WT MEFs after 4 h H2O2 treatment at 50–200 μM. This reduced necrosis in ROCK1 -/- MEFs compared to WT MEFs most likely contributes to the moderate reduction in cell detachment and loss of cell viability after treatment with H2O2 (Fig 5B and 5C). ROCK1 -/- MEFs also showed reduced numbers of Sytox Green positive cells at both 4 and 16 h after doxorubicin treatment (Fig 8D). The marked reduction of necrosis observed in doxorubicin treated ROCK1 -/- MEFs compared to WT MEFs at 16 h correlated with the high degree of inhibition of caspase activation by ROCK1 deletion (Fig 7). These results reveal a role for ROCK1 in mediating H2O2-induced primary necrosis and in doxorubicin-induced necrosis most likely secondary to apoptosis.
Both NAC and ROCK1 deletion reduce ROS levels in doxorubicin- and H2O2-treated cells
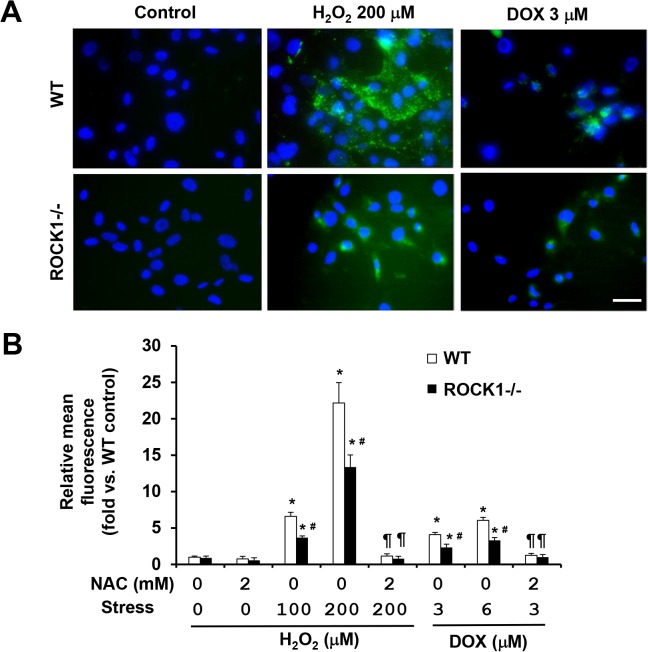
To evaluate effects of NAC and ROCK1 deficiency on oxidative stress induced by doxorubicin or H2O2 treatment, we measured intracellular ROS levels with chloromethyl derivative of dichlorodihydrofluorescein diacetate (CM-H2DCFDA), an oxidant-sensitive dye (Fig 9A). The treatment with doxorubicin or H2O2 for 3 h increased ROS levels in WT MEFs in a dose-dependent manner. Interestingly, 3 μM doxorubicin treatment produced much smaller increases of ROS levels (3 to 4-fold) compared to those produced by 200 μM H2O2 treatment (20 to 25-fold) (Fig 9B), correlating with lower necrosis induced by doxorubicin compared those induced by H2O2 treatment for 3 to 4 h (Fig 8). Co-treatment with 2 mM of NAC completely suppressed the increased ROS levels in both doxorubicin and H2O2 treated cells (Fig 9B), supporting that increased intracellular ROS levels contribute to necrosis. In addition, ROCK1 deficiency showed a significant reduction of ROS levels compared to WT MEFs after doxorubicin or H2O2 treatment (Fig 9B). This reduced ROS levels in ROCK1 -/- MEFs compared to WT MEFs most likely contributes to the reduced necrosis induced by H2O2 or by doxorubicin at early time points (Fig 8C and 8D).
Fig 9. NAC and ROCK1 deletion reduce ROS levels induced by doxorubicin and H2O2 treatments.
(A). Representative images of CM-H2DCFDA staining of WT and ROCK1 -/- MEFs treated with 200 μM of H2O2 or 3 μM doxorubicin, and/or 2 mM NAC for 0 or 4h, and then exposed to 13 μM CM-H2DCFDA. Coverslip was mounted with AntiFade Mountant containing DAPI and imaged immediately. Bar, 50 μm. (B). Quantitative analysis of CM-H2DCFDA staining of WT and ROCK1 -/- MEFs treated as above followed by the measurement with microplate reader and image analytic system. At least 10,000 cells were analyzed in each condition. Fluorescence levels in WT cells at baseline were arbitrarily set at 1. * P < 0.05 vs. control of the same genotype. # P < 0.05 vs. WT under the same treatment condition. ¶ P < 0.05 vs. the same genotype under doxorubicin or H2O2 only condition.
Discussion
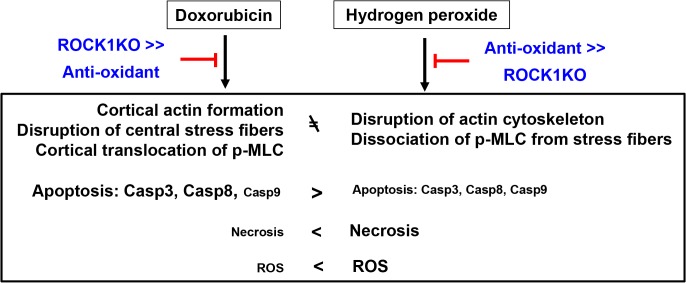
We recently reported that ROCK1 deficiency in MEFs has superior anti-apoptotic and pro-survival effects compared to anti-oxidants against doxorubicin. However, this drug-induced oxidative stress is the most widely accepted underlying mechanism attributable to its cytotoxicity to normal cells, especially to cardiomyocytes. The present study investigates the mechanistic differences between the cytotoxic effects of doxorubicin compared to H2O2. The approaches consist of comparing the cytotoxic effects induced by doxorubicin versus those induced by H2O2 in WT and ROCK1 -/- MEFs, and in the presence or absence of the antioxidant NAC. Although both H2O2 and doxorubicin induce significant cytotoxicity in WT MEFs including apoptosis, necrosis, cell detachment, actin cytoskeleton alterations and excessive ROS production, our analyses reveal that these cytotoxic events clearly present with different characteristics (Fig 10). The present study reveals that the drug-induced actin cytoskeleton remodeling (ROCK1-dependent) plays a more important role than the drug-induced oxidative stress in mediating doxorubicin cytotoxicity in MEFs.
Fig 10. Schematic summary.
The diagram summarizes the effects of antioxidant (NAC) and ROCK1 deficiency in opposing apoptosis, necrosis, ROS production and actin cytoskeleton alterations induced by H2O2 and doxorubicin. Antioxidant treatment shows a stronger protection than ROCK1 deletion against H2O2-induced cytotoxic effects while ROCK1 deletion shows a stronger protection than antioxidant treatment against doxorubicin-induced cytotoxicity. These results support the notion that doxorubicin induces apoptosis, necrosis, and actin cytoskeleton alterations predominantly through a ROS-independent and ROCK1-dependent mechanisms. Additional results supporting this concept include different temporal patterns and magnitudes of caspase activations and necrotic cell death, different levels of ROS production and different alteration of actin cytoskeleton induced by H2O2 compared to doxorubicin.
The present study reveals striking differences between H2O2- and doxorubicin-induced caspase activation: H2O2-induced activations of caspases 3, 8, and 9 occur earlier (within 4 h) and with much lower maximal levels (2 to 4-fold) compared to those induced by doxorubicin (8 to 24 h and 15 to 25-fold activation for caspase 3 and 8). These differences in caspase activation are associated with different actin cytoskeleton remodeling induced by H2O2 and doxorubicin: H2O2 induces disruption of stress fibers accompanied by dissociation of p-MLC from stress fibers to the cytoplasm, while only central stress fibers are disrupted by doxorubicin accompanied by increased cortical stress fibers and cortical translocation of p-MLC from central stress fibers. Although the antioxidant NAC suppresses both H2O2- and doxorubicin-induced ROS production and also H2O2-induced caspase activation and cytoskeleton remodeling, it has limited effects on doxorubicin-induced caspase activation and cytoskeleton remodeling. Importantly, ROCK1 deficiency has more potent inhibition on doxorubicin-induced caspase activation and cytoskeleton remodeling than those induced by H2O2. These results support the notion that doxorubicin induces actin cytoskeleton alterations, impairs cell adhesion, and increases caspase activations largely through ROS-independent and ROCK1-dependent mechanisms.
Although many studies have suggested that antioxidants have protective effects on chemotherapy-induced cardiotoxicity, clinical trials of antioxidant therapy showed unsatisfactory benefits [18,19]; the reasons for it are still undetermined. Our results from the current study support a central role for ROCK1 in promoting p-MLC translocation to cortical stress fibers resulting in excessive cortical actomyosin contraction induced by doxorubicin. Two pieces of evidence from the current study indicate that this ROCK1-mediated translocation of p-MLC to the cortical stress fibers occurs independently of oxidative stress: 1) NAC treatment has minor effects on doxorubicin-induced cortical stress fiber formation; 2) H2O2 treatment does not induce cortical translocation of p-MLC, but instead, the treatment removes p-MLC from all stress fibers. In line with our previous report, the current study also supports that ROCK1 deletion and antioxidant have additive effects in reducing apoptosis, cell detachment and loss of cell viability induced by doxorubicin [34]. It would be of interest to explore the mechanisms through which doxorubicin treatment triggers ROCK1-mediated cortical translocation of p-MLC. Although MEFs are not primary targets of doxorubicin cardiotoxicity, the advantage of using these cells in the present mechanistic study is that actin cytoskeleton (stress fibers) can be easily visualized, therefore facilitating the investigation of their contribution to caspase activation, cell detachment and the loss of cell viability induced by cytotoxic stresses. It would be of interest to validate these mechanisms in other cell types such as cardiomyocytes, endothelial cells, and progenitor cells which are primary targets for doxorubicin cardiotoxicity [35,40–43].
In contrast to the strong protection on doxorubicin-induced cytoskeleton remodeling, the current study reveals that ROCK1 deletion has no apparent protection on stress fiber disruption induced by H2O2, which causes dislocation of p-MLC from all stress fibers including cortical stress fibers. The observation of the deletion of ROCK1 cannot prevent H2O2-induced dislocation of p-MLC from stress fibers is consistent with the established primary role of ROCK1 in promoting p-MLC association with stress fibers. This reduced actomyosin contraction due to dislocation of p-MLC from stress fibers is a key factor in the disruption of stress fibers by H2O2. In agreement with this idea, we observed that the inhibition of actomyosin contraction by blebbistatin, a direct inhibitor of myosin II ATPase, further increases H2O2-induced cell detachment while it decreases doxorubicin-induced cell detachment.
In association with the lack of protection on actin cytoskeleton in H2O2 treatment, ROCK1 deletion does not inhibit caspase activation, and has only moderate inhibition on cell detachment and the loss of cell viability. The moderate protective effects of ROCK1 deletion on H2O2-induced loss of cell viability are most likely through inhibition of necrosis. We observed that the anti-necrotic action of ROCK1 deletion correlates with its effect of partially reducing the ROS levels. In addition, the higher levels of primary necrosis-induced by H2O2 correlate with the higher levels of intracellular ROS levels compared to those-induced by doxorubicin in MEFs, supporting that oxidative stress is a major contributor to the primary necrosis induced by H2O2 or doxorubicin. We previously observed that ROCK1 deletion reduces doxorubicin-induced ROS production through inhibiting NADPH oxidase activation [34]. Future studies are needed to determine the mechanisms through which ROCK1 deletion reduces H2O2-induced excessive ROS. It is worth noting that ROS has been previously reported to induce RhoA/ROCK activation [44,45], supporting that ROCK1 is downstream of H2O2. The current study indicates that ROCK1 can also act upstream of H2O2 and be involved in the regulation of ROS production.
In summary, this study has shown that oxidative stress and doxorubicin produce actin cytoskeleton alteration, apoptosis, and necrosis with clearly different features in MEFs. Antioxidant treatment and ROCK1 deletion have distinct protective effects for these two stresses: an antioxidant is more effective on opposing oxidative stress cytotoxicity, while ROCK1 deletion is more effective on resisting doxorubicin cytotoxicity (Fig 10). These results support the notion that doxorubicin induces cortical stress fiber formation, impairs cell adhesion, increases caspase activations largely through oxidative stress-independent and ROCK1-dependent mechanisms. These observations also highlight the importance of actin cytoskeleton remodeling in stress responses: an increase in cortical actomyosin contraction (ROCK1-dependent) is linked with impaired cell adhesion, high level of apoptosis induction and low level of primary necrosis induction in response to doxorubicin; a decrease in actomyosin contraction is linked to impaired cell adhesion, low level of apoptosis induction, and high level of primary necrosis induction in response to H2O2 treatment. Our studies support the need to investigate actin cytoskeleton changes in response to other cytotoxic stresses (i.e. other anti-cancer drugs and other environmental stresses) and the impact of the actin cytoskeleton changes on cytotoxic mechanisms such as apoptosis and necrosis.
Materials and Methods
All animal experiments were conducted in accordance with the National Institutes of Health “Guide for the Care and Use of Laboratory Animals” (NIH Publication No. 85–23, revised 1996) and were approved by the Institutional Animal Care and Use Committee at Indiana University School of Medicine.
A detailed description of the materials and methods used in the present study can be found in S1 File (Supplemental Materials and Methods).
Cell culture and drug treatment
WT and ROCK1-deficient MEF cells were prepared from WT and ROCK1 -/- embryos as previously described [22]. Cells were cultured as previously described [22], and were treated at ~90% confluence with hydrogen peroxide, doxorubicin, and NAC (Sigma-Aldrich) at indicated times and dosages.
Cell viability, apoptosis and necrosis and detachment assays
Following the treatment of desired drugs at indicated concentrations, cell viability measured by MTT assay, cell detachment assay by counting the detached (floating) and attached (collected by trypsinization) cells were performed as previously described [22]. Flow cytometry was used for quantitative analysis of apoptotic and necrotic cells as previously described [22], using a FITC Annexin V Apoptosis Detection Kit with 7-AAD (BioLegend).
Cytation 3 (BioTek Instruments), a cell-based multi-mode microplate reader and image analysis system, was used for quantitative analysis of Sytox Green (Life Technologies) uptake by necrotic cells. The ratio of necrotic cells with compromised cellular membranes can be measured by fluorescence imaging of 24-well plates combined with image-based quantitative analyses of green nuclei (Sytox Green positive cells) and blue nuclei (Hoechst 33342 staining for total cells). The samples were prepared in duplicate and at least 5,000 cells were analyzed for each well. At least five independent experiments were analyzed.
Fluorescence imaging
Rhodamine-phalloidin staining of F-actin and immunostaining of p-MLC were followed by fluorescence microscopy detection as previously described [22]. ROS detection was performed in live cells with CM-H2DCFDA (C-6827, Life Technologies) as previously described [34].
Protein analysis
Following treatment with desired drugs, attached cells were collected for further analyses. Protein samples were prepared from cell lysates, and subsequently analyzed by Western blot as previously described [22].
Statistical analysis
We analyzed all data by using Student’s t-test or ANOVA as appropriate. A P < 0.05 was considered as significant. Data are presented as mean ± SE.
Supporting Information
(DOC)
(DOC)
(DOC)
(DOC)
(DOC)
(DOC)
(DOC)
Acknowledgments
This work was supported by National Institutes of Health grants (HL107537), a Grant-in-Aid award from American Heart Association, Midwest Affiliate (12GRNT12060525), and by the Riley Children's Foundation.
Data Availability
All relevant data are within the paper and its Supporting Information files.
Funding Statement
This work was supported by National Institutes of Health grants (HL107537), a Grant-in-Aid award from American Heart Association, Midwest Affiliate (12GRNT12060525), and by the Riley Children's Foundation.
References
- 1. Singal PK, Iliskovic N. Doxorubicin-induced cardiomyopathy. N Engl J Med. 1998;339: 900–905. [DOI] [PubMed] [Google Scholar]
- 2. Yeh ET, Bickford CL. Cardiovascular complications of cancer therapy: incidence, pathogenesis, diagnosis, and management. J Am Coll Cardiol. 2009;53: 2231–2247. 10.1016/j.jacc.2009.02.050 [DOI] [PubMed] [Google Scholar]
- 3. Lipshultz SE, Cochran TR, Franco VI, Miller TL. Treatment-related cardiotoxicity in survivors of childhood cancer. Nat Rev Clin Oncol. 2013;10: 697–710. 10.1038/nrclinonc.2013.195 [DOI] [PubMed] [Google Scholar]
- 4. Lindsey ML, Lange RA, Parsons H, Andrews T, Aune GJ. The tell-tale heart: molecular and cellular responses to childhood anthracycline exposure. Am J Physiol Heart Circ Physiol. 2014;307(10):H1379–1389. 10.1152/ajpheart.00099.2014 [DOI] [PMC free article] [PubMed] [Google Scholar]
- 5. Tacar O, Sriamornsak P, Dass CR. Doxorubicin: an update on anticancer molecular action, toxicity and novel drug delivery systems. J Pharm Pharmacol. 2013;65: 157–170. 10.1111/j.2042-7158.2012.01567.x [DOI] [PubMed] [Google Scholar]
- 6. Shi J, Abdelwahid E, Wei L. Apoptosis in anthracycline cardiomyopathy. Curr Pediatr Rev. 2011;7: 329–336. [DOI] [PMC free article] [PubMed] [Google Scholar]
- 7. Zhang YW, Shi J, Li YJ, Wei L. Cardiomyocyte death in doxorubicin-induced cardiotoxicity. Arch Immunol Ther Exp (Warsz). 2009;57: 435–445. [DOI] [PMC free article] [PubMed] [Google Scholar]
- 8. Sawyer DB, Peng X, Chen B, Pentassuglia L, Lim CC. Mechanisms of anthracycline cardiac injury: can we identify strategies for cardioprotection? Prog Cardiovasc Dis. 2010;53: 105–113. 10.1016/j.pcad.2010.06.007 [DOI] [PMC free article] [PubMed] [Google Scholar]
- 9. Ranek MJ, Wang X. Activation of the ubiquitin-proteasome system in doxorubicin cardiomyopathy. Curr Hypertens Rep. 2009;11: 389–395. [DOI] [PMC free article] [PubMed] [Google Scholar]
- 10. Kalyanaraman B, Joseph J, Kalivendi S, Wang S, Konorev E, Kotamraju S. Doxorubicin-induced apoptosis: implications in cardiotoxicity. Mol Cell Biochem. 2002;234–235: 119–124. [PubMed] [Google Scholar]
- 11. Takemura G, Fujiwara H. Doxorubicin-induced cardiomyopathy from the cardiotoxic mechanisms to management. Prog Cardiovasc Dis. 2007;49: 330–352. [DOI] [PubMed] [Google Scholar]
- 12. Octavia Y, Tocchetti CG, Gabrielson KL, Janssens S, Crijns HJ, Moens AL. Doxorubicin-induced cardiomyopathy: from molecular mechanisms to therapeutic strategies. J Mol Cell Cardiol. 2012;52: 1213–1225. 10.1016/j.yjmcc.2012.03.006 [DOI] [PubMed] [Google Scholar]
- 13. Vejpongsa P, Yeh ET. Prevention of Anthracycline-Induced Cardiotoxicity: Challenges and Opportunities. J Am Coll Cardiol. 2014;64: 938–945. 10.1016/j.jacc.2014.06.1167 [DOI] [PubMed] [Google Scholar]
- 14. Doroshow JH, Davies KJ. Redox cycling of anthracyclines by cardiac mitochondria. II. Formation of superoxide anion, hydrogen peroxide, and hydroxyl radical. J Biol Chem. 1986;261: 3068–3074. [PubMed] [Google Scholar]
- 15. Rajagopalan S, Politi PM, Sinha BK, Myers CE. Adriamycin-induced free radical formation in the perfused rat heart: implications for cardiotoxicity. Cancer Res. 1988;48: 4766–4769. [PubMed] [Google Scholar]
- 16. Childs AC, Phaneuf SL, Dirks AJ, Phillips T, Leeuwenburgh C. Doxorubicin treatment in vivo causes cytochrome C release and cardiomyocyte apoptosis, as well as increased mitochondrial efficiency, superoxide dismutase activity, and Bcl-2:Bax ratio. Cancer Res. 2002;62: 4592–4598. [PubMed] [Google Scholar]
- 17. Kotamraju S, Konorev EA, Joseph J, Kalyanaraman B. Doxorubicin-induced apoptosis in endothelial cells and cardiomyocytes is ameliorated by nitrone spin traps and ebselen. Role of reactive oxygen and nitrogen species. J Biol Chem 2000;275: 33585–33592. [DOI] [PubMed] [Google Scholar]
- 18. Simunek T, Sterba M, Popelova O, Adamcova M, Hrdina R, Gersl V. Anthracycline-induced cardiotoxicity: overview of studies examining the roles of oxidative stress and free cellular iron. Pharmacol Rep. 2009;61: 154–171. [DOI] [PubMed] [Google Scholar]
- 19. van Dalen EC, Caron HN, Dickinson HO, Kremer LC. Cardioprotective interventions for cancer patients receiving anthracyclines. Cochrane Database Syst Rev: 2011;(6): CD003917. [DOI] [PMC free article] [PubMed] [Google Scholar]
- 20. Feng Z, Chen B, Tang SC, Liao K, Chen WN, Chan V. Effect of cytoskeleton inhibitors on deadhesion kinetics of HepG2 cells on biomimetic surface. Colloids Surf B Biointerfaces. 2010;75: 67–74. 10.1016/j.colsurfb.2009.08.010 [DOI] [PubMed] [Google Scholar]
- 21. Colombo R, Dalle Donne I, Milzani A. Metal ions modulate the effect of doxorubicin on actin assembly. Cancer Biochem Biophys. 1990;11: 217–226. [PubMed] [Google Scholar]
- 22. Shi J, Wu X, Surma M, Vemula S, Zhang L, Yang Y, et al. Distinct roles for ROCK1 and ROCK2 in the regulation of cell detachment. Cell Death Dis. 2013;4: e483 10.1038/cddis.2013.10 [DOI] [PMC free article] [PubMed] [Google Scholar]
- 23. Shi J, Surma M, Zhang L, Wei L. Dissecting the roles of ROCK isoforms in stress-induced cell detachment. Cell Cycle. 2013;12: 1492–1500. 10.4161/cc.24699 [DOI] [PMC free article] [PubMed] [Google Scholar]
- 24. Matsui T, Amano M, Yamamoto T, Chihara K, Nakafuku M, Ito M, et al. Rho-associated kinase, a novel serine/threonine kinase, as a putative target for small GTP binding protein Rho. Embo J. 1996;15: 2208–2216. [PMC free article] [PubMed] [Google Scholar]
- 25. Ishizaki T, Maekawa M, Fujisawa K, Okawa K, Iwamatsu A, Fujita A, et al. The small GTP-binding protein Rho binds to and activates a 160 kDa Ser/Thr protein kinase homologous to myotonic dystrophy kinase. Embo J. 1996;15: 1885–1893. [PMC free article] [PubMed] [Google Scholar]
- 26. Nakagawa O, Fujisawa K, Ishizaki T, Saito Y, Nakao K, Narumiya S. ROCK-I and ROCK-II, two isoforms of Rho-associated coiled-coil forming protein serine/threonine kinase in mice. FEBS Lett. 1996;392: 189–193. [DOI] [PubMed] [Google Scholar]
- 27. Amano M, Fukata Y, Kaibuchi K. Regulation and functions of Rho-associated kinase. Exp Cell Res. 2000;261: 44–51. [DOI] [PubMed] [Google Scholar]
- 28. Riento K, Ridley AJ. Rocks: multifunctional kinases in cell behaviour. Nat Rev Mol Cell Biol. 2003;4: 446–456. [DOI] [PubMed] [Google Scholar]
- 29. Amano M, Chihara K, Kimura K, Fukata Y, Nakamura N, Matsuura Y, et al. Formation of actin stress fibers and focal adhesions enhanced by Rho-kinase. Science. 1997;275: 1308–1311. [DOI] [PubMed] [Google Scholar]
- 30. Kimura K, Ito M, Amano M, Chihara K, Fukata Y, Nakafuku M, et al. Regulation of myosin phosphatase by Rho and Rho-associated kinase (Rho-kinase). Science. 1996;273: 245–248. [DOI] [PubMed] [Google Scholar]
- 31. Leung T, Chen XQ, Manser E, Lim L. The p160 RhoA-binding kinase ROK alpha is a member of a kinase family and is involved in the reorganization of the cytoskeleton. Mol Cell Biol. 1996;16: 5313–5327. [DOI] [PMC free article] [PubMed] [Google Scholar]
- 32. Maekawa M, Ishizaki T, Boku S, Watanabe N, Fujita A, Iwamatsu A, et al. Signaling from Rho to the actin cytoskeleton through protein kinases ROCK and LIM-kinase. Science. 1999;285: 895–898. [DOI] [PubMed] [Google Scholar]
- 33. Arber S, Barbayannis FA, Hanser H, Schneider C, Stanyon CA, Bernard O, et al. Regulation of actin dynamics through phosphorylation of cofilin by LIM-kinase. Nature. 1998;393: 805–809. [DOI] [PubMed] [Google Scholar]
- 34. Surma M, Handy C, Chang J, Kapur R, Wei L, Shi J. ROCK1 deficiency enhances protective effects of antioxidants against apoptosis and cell detachment. PLoS One. 2014;9: e90758 10.1371/journal.pone.0090758 [DOI] [PMC free article] [PubMed] [Google Scholar]
- 35. Shi J, Zhang L, Zhang YW, Surma M, Mark Payne R, Wei L. Downregulation of doxorubicin-induced myocardial apoptosis accompanies postnatal heart maturation. Am J Physiol Heart Circ Physiol. 2012; 302: H1603–1613. 10.1152/ajpheart.00844.2011 [DOI] [PMC free article] [PubMed] [Google Scholar]
- 36. Millea PJ. N-acetylcysteine: multiple clinical applications. Am Fam Physician. 2009; 80: 265–269. [PubMed] [Google Scholar]
- 37. Samuni Y, Goldstein S, Dean OM, Berk M. The chemistry and biological activities of N-acetylcysteine. Biochim Biophys Acta. 2013; 1830: 4117–4129. 10.1016/j.bbagen.2013.04.016 [DOI] [PubMed] [Google Scholar]
- 38. Rebbaa A, Zheng X, Chou PM, Mirkin BL. Caspase inhibition switches doxorubicin-induced apoptosis to senescence. Oncogene. 2003; 22: 2805–2811. [DOI] [PubMed] [Google Scholar]
- 39. Saito Y, Nishio K, Ogawa Y, Kimata J, Kinumi T, Yoshida Y, et al. Turning point in apoptosis/necrosis induced by hydrogen peroxide. Free Radic Res. 2006; 40: 619–630. [DOI] [PubMed] [Google Scholar]
- 40. Zhu W, Shou W, Payne RM, Caldwell R, Field LJ. A mouse model for juvenile doxorubicin-induced cardiac dysfunction. Pediatr Res. 2008; 64: 488–494. 10.1203/PDR.0b013e318184d732 [DOI] [PMC free article] [PubMed] [Google Scholar]
- 41. Zhu W, Soonpaa MH, Chen H, Shen W, Payne RM, Liechty EA, et al. Acute doxorubicin cardiotoxicity is associated with p53-induced inhibition of the mammalian target of rapamycin pathway. Circulation. 2009; 119: 99–106. 10.1161/CIRCULATIONAHA.108.799700 [DOI] [PMC free article] [PubMed] [Google Scholar]
- 42. De Angelis A, Piegari E, Cappetta D, Marino L, Filippelli A, Berrino L, et al. Anthracycline cardiomyopathy is mediated by depletion of the cardiac stem cell pool and is rescued by restoration of progenitor cell function. Circulation. 2010; 121: 276–292. 10.1161/CIRCULATIONAHA.109.895771 [DOI] [PMC free article] [PubMed] [Google Scholar]
- 43. Huang C, Zhang X, Ramil JM, Rikka S, Kim L, Lee Y, et al. Juvenile exposure to anthracyclines impairs cardiac progenitor cell function and vascularization resulting in greater susceptibility to stress-induced myocardial injury in adult mice. Circulation. 2010; 121: 675–683. 10.1161/CIRCULATIONAHA.109.902221 [DOI] [PMC free article] [PubMed] [Google Scholar]
- 44. Moon C, Lee YJ, Park HJ, Chong YH, Kang JL. N-acetylcysteine inhibits RhoA and promotes apoptotic cell clearance during intense lung inflammation. Am J Respir Crit Care Med. 2010; 181: 374–387. 10.1164/rccm.200907-1061OC [DOI] [PubMed] [Google Scholar]
- 45. Aghajanian A, Wittchen ES, Campbell SL, Burridge K. Direct activation of RhoA by reactive oxygen species requires a redox-sensitive motif. PLoS One. 2009; 4: e8045 10.1371/journal.pone.0008045 [DOI] [PMC free article] [PubMed] [Google Scholar]
Associated Data
This section collects any data citations, data availability statements, or supplementary materials included in this article.
Supplementary Materials
(DOC)
(DOC)
(DOC)
(DOC)
(DOC)
(DOC)
(DOC)
Data Availability Statement
All relevant data are within the paper and its Supporting Information files.


