

Abstract
The human cerebral cortex develops through an elaborate succession of cellular events that, when disrupted, can lead to neuropsychiatric disease. The ability to reprogram somatic cells into pluripotent cells that can be differentiated in vitro provides a unique opportunity to study normal and abnormal corticogenesis. Here, we present a simple and reproducible 3D culture approach for generating a laminated cerebral cortex–like structure, named human cortical spheroids (hCSs), from pluripotent stem cells. hCSs contain neurons from both deep and superficial cortical layers and map transcriptionally to in vivo fetal development. These neurons are electrophysiologically mature, display spontaneous activity, are surrounded by nonreactive astrocytes and form functional synapses. Experiments in acute hCS slices demonstrate that cortical neurons participate in network activity and produce complex synaptic events. These 3D cultures should allow a detailed interrogation of human cortical development, function and disease, and may prove a versatile platform for generating other neuronal and glial subtypes in vitro.
Progress in understanding the development of the human nervous system and elucidating the mechanisms of mental disorders has been greatly limited by restricted access to functional human brain tissue1. In recent years, a paradigm shift has been achieved with the introduction of cellular reprogramming—a process in which terminally differentiated somatic cells can be converted into pluripotent stem cells, named human induced pluripotent stem cells (hiPSCs)2. These hiPSCs can be generated from any individual and can be directed to differentiate in vitro into derivatives representing all germ layers, including neural cells. Although the methods and efficiency of generating hiPSCs have been significantly improved and standardized across laboratories, the methods for deriving specific neuronal cell types and glia remain challenging1,3,4.
Over the past decade, differentiation protocols of pluripotent stem cells in monolayers have led to the generation of a variety of neural cell types5, but these two-dimensional (2D) methods are unlikely to recapitulate the cytoarchitecture of the developing three-dimensional (3D) nervous system or the complexity and functionality of in vivo neural circuits. These needs have spawned 3D approaches for generating organoid cultures containing mixed ectodermal derivatives6–8. Although these methods recapitulate many aspects of corticogenesis and display a level of self-organization beyond what is possible in 2D cultures, there remain obstacles, including the need for (i) controlled specification of cell types, (ii) cortical lamination comprising equal proportions of superficial- and deep-layer neurons, (iii) concomitant generation of nonreactive astrocytes, (iv) robust synaptogenesis and spontaneous synaptic activity, (v) organization of a functional neural network that can be perturbed and probed in intact preparations and (vi) reproducibility between hiPSC clones within and across differentiations.
Here we report a simple method for generating pyramidal neurons from hiPSCs in a 3D cerebral cortex–like structure. These neural structures, which we named human cortical spheroids (hCSs), were generated from intact hiPSC colonies that were cultured and minimally patterned in exclusively nonadherent conditions and in the absence of extracellular scaffolding. This approach to generating hCSs addresses many of the difficulties mentioned above. The hCS method generated only excitatory neurons of the dorsal telencephalon. Moreover, the internal cyto-architecture was reminiscent of a laminated neocortex and grew to include equal proportions of projecting neurons expressing deep- and superficial-layer cortical markers. Transcriptional analysis and comparison to the developing human brain revealed that hCSs after 2.5 months resembled the mid-fetal prenatal brain (19–24 post-conception weeks, PCW). Cortical neurons were accompanied by a network of nonreactive astrocytes and were synaptically connected. Importantly, hCSs were amenable to acute slice physiology, which allows one to record and electrically stimulate neurons while preserving a relatively intact network. Lastly, this method is simple, scalable and reproducible between hiPSC lines, across and within differentiations. hCSs have the potential to reveal cellular phenotypes associated with neuropsychiatric disorders, identify biomarkers for early diagnosis and clinical stratification, and provide a platform for drug and teratologic agent screenings in vitro1,3,9.
RESULTS
Generation of hCSs from hiPSCs
To generate suspended cellular aggregates of pluripotent cells, we used cultures of hiPSCs grown on feeders. We used seven hiPSC lines derived from five subjects and successfully generated hCSs from each clone. Rather than using single-cell suspensions, we enzymatically detached intact hiPSC colonies from inactivated feeders (Fig. 1a). Suspended colonies were subsequently transferred into low-attachment plates in a KnockOut Serum (Invitrogen)-based medium without fibroblast growth factor 2 (FGF2). Within a few hours, the floating hiPSC colonies folded into spherical structures. To achieve rapid and efficient neural induction, both the BMP and TGF-β signaling pathways were inhibited with small molecules: dorsomorphin (also known as compound C) and SB-431542 (ref. 10). On the sixth day in suspension, the floating spheroids were moved to serum-free Neurobasal with B-27 (Invitrogen) medium containing FGF2 and epidermal growth factor (EGF). We changed the medium daily in the first 10 d and every other day for the subsequent 9 d.
Figure 1.

Generation and characterization of human cortical spheroids (hCS) from hiPSCs. (a) Scheme illustrating the main stages of the method for generating hCSs from hiPSCs. Floating hCSs can either be dissociated for flow cytometry or monolayer culture or be fixed and sectioned for immunofluorescence experiments. (b) Immunostaining for PAX6 and FOXG1 in dissociated neural cultures at day 18 in vitro. (c) Proportions of β3-tubulin (TUBB3)-, NEUN- and GFAP-expressing cells at days 49–52 and day 76 in vitro. Quantification performed in dissociated cells for TUBB3 and GFAP and in cryosections for NEUN (mean ± s.e.m.; n = 3–6 hCSs (numbers are listed within each bar); two-way ANOVA, F1,20 = 47.67, P < 0.0001 for time point (day 49–52 versus day 76), Bonferroni multiple-comparison tests: **P < 0.01, ****P < 0.0001). (d) Morphology and size of hCSs at days 13, 26 and 61 in vitro. For size comparison at day 61, a dissected E12.5 mouse brain is shown. (e) Transcriptional analyses and mapping onto the developing and adult human brain (age 4 PCW to >60 years) of hCSs at days 52 and 76 using the machine-learning algorithm CoNTExT (n = 3 hiPSC lines per time point from three subjects). (f) Rank-rank hypergeometric overlap (RRHO) between hCSs at days 52 and 76 (n = 3 hiPSC lines) and laminae in the developing human cortex. VZ, ventricular zone; SZ, subventricular zone; IZ, intermediate zone; SP, subplate; CPi, inner cortical plate; CPo, outer cortical plate; MZ, marginal zone; SG, subpial granular layer.
By day 18, over 85% of cells expressed PAX6, and more than 80% of these progenitors expressed FOXG1 (Fig. 1b; Supplementary Fig. 1). To promote differentiation of neural progenitors into neurons, FGF2 and EGF were replaced with brain-derived neurotrophic factor (BDNF) and neurotrophic factor 3 (NT3) starting at day 25. From day 43 onward, only neural medium without growth factors was used for medium changes every 4 d. After ~7 weeks of differentiation in vitro, 78.8% ± 2.5 (n = 4 hCSs, mean ± s.e.m.) of the cells expressed the neuronal marker β3-tubulin (Fig. 1c). We also observed a small population of cells (7.6% ± 1.02, n = 6 hCSs, mean ± s.e.m. at day 76) expressing the astrocyte and radial glial marker GFAP. At this stage, 36.2% ± 3.6 (n = 3 hCSs, mean ± s.e.m.) of neurons expressed the mature neuronal marker NEUN, which is present in the human forebrain only after 20 weeks of gestation11. The hCSs grew in size to more than 300 μm in diameter by 2 weeks of culture and reached up to 4 mm in diameter by 2.5 months (4.2 ± 0.3 mm, mean ± s.e.m., n = 16 hCSs from 4 differentiated hiPSC lines) (Fig. 1d).
We used transcriptional profiling to assess the developmental maturity and the regional identity of hCSs at two distinct time points. We compared the transcriptional profiles of hCSs to those of the developing human fetal brain using a machine learning algorithm (CoNTExT)12 trained on 1,340 primary tissue samples. We observed a strong overlap between hCSs and cortical developmental stages up to late mid-fetal periods (19–24 PCW) (Fig. 1e). This is in contrast to monolayer methods as well as other 3D approaches for neural differentiation of hiPSCs6,12 that yield neurons mapping onto earlier fetal stages (Supplementary Fig. 2). We then looked for genes whose expression was changing in the same direction in hCSs and human fetal cortex between stages 1 and 2 (4–10 PCW) and stage 6 (19–24 PCW), but not in hiPSC-derived neural cultures differentiated in monolayer (Supplementary Table 1). Interestingly, upregulated genes were enriched for synaptic transmission genes (GO enrichment, P = 0.009), whereas the downregulated genes were enriched for cell cycle (P = 0.02) and cell division genes (P = 0.001). We next used transition mapping12 to assess the similarity of the transcription transitions between in vitro development of the hCSs and two time points in the developing human brain. For this analysis we employed the transcriptional spatiotemporal atlas of the human brain13 and the laminar expression data dissected via laser capture microdissection from fetal human brain14. We found that the transition between day 52 and day 76 of in vitro development had the strongest overlap (max-log10(P value) > 83) with the ventricular zone (VZ)/subventricular zone (SVZ) and with the intermediate zone (IZ)/subplate (SP)/inner cortical plate (CPi), respectively (Fig. 1f).
We examined the cytoarchitecture of the hCSs (day 52) in cryosections and observed proliferative zones containing PAX6-expressing progenitors (Fig. 2a). Similarly to what occurs during in vivo cortical development, VZ-like structures inside hCSs were organized around a lumen delimited by N-cadherin (NCAD)-expressing cells (Fig. 2b). Furthermore, the VZ-like zone was surrounded by an intermediate region rich in TBR2+ cells resembling the SVZ15,16 (Fig. 2b). PAX6-expressing cells in the VZ-like zone also contained GFAP+ extensions directed orthogonally to the luminal surface, resembling radial glia (Fig. 2c). When plated in monolayer, these cells had either bipolar or monopolar morphologies (Fig. 2d,e). Both PAX6+ and TBR2+ neural progenitors were actively proliferating, as assessed by the expression of the radial glia–specific mitotic marker phosphovimentin (p-VIM)17 and the G2/M phase marker phosphohistone-3 (PH3) (Fig. 2f,g). In a pattern similar to in vivo cortical development, most of these mitoses were localized close to the luminal side of the proliferative zone rather than being dispersed16. Moreover, live imaging of radial glia fluorescently labeled with a cell-specific reporter (Lenti-GFAP::EGFP) revealed a characteristic division mode reminiscent of interkinetic nuclear migration18 (Fig. 2h, Supplementary Video 1).
Figure 2.

Corticogenesis in the hCS. (a) Cryosection of a hCS at day 52 stained for PAX6 (progenitors) and NEUN (neurons), demonstrating the presence of a VZ-like region organized around a lumen. (b) Intermediate progenitor cells (TBR2+) are present in a SVZ-like region beyond the VZ; Ncad stains the luminal side of the progenitors. (c–f) Radial glial cells expressing combinations of GFAP, PAX6 or TBR2 and pVIM are present in proliferative zones, extend processes perpendicular to the lumen (L) and, when plated in monolayer, have either one or two processes. White arrowheads indicate the cell body and yellow arrowheads processes. (g) Mitoses (PH3+) are spatially restricted to the luminal side of the proliferative zones. (h) Live imaging showing interkinetic nuclear migration (Lenti-GFAP::EGFP). (i) RELN+ neurons are positioned horizontally on the surface of hCSs. (j) Quantification in cryosections of the proportion of cells expressing layer-specific cortical markers at three time points of differentiation (mean ± s.e.m.; n = 3–13 hCSs (numbers are listed within each bar) from four hiPSC lines derived from four individuals; two-way ANOVA, F2,48 = 32.96, P < 0.0001 for time point (day 52 versus day 76 versus day 137); Tukey’s multiple-comparison tests: *P < 0.05, **P < 0.01, ****P < 0.0001). (k,l) Cryosections of hCSs at 137 d stained for the indicated markers, showing organization of layer-specific neurons. (m,n) Flow cytometry of dissociated hCSs at 76 d for cells expressing the indicated markers. (o,p) Cryosections of hCSs loaded with EdU for 48 h at 55 d of differentiation and analyzed 3 weeks later for TBR1+ deep-layer neurons (o) and SATB2+ superficial-layer neurons (p) (numbers below indicate days of differentiation).
Characterization of hCSs
To characterize the neuronal subtypes present in hCSs and to study the timing of their generation, we validated a panel of antibodies in the human fetal cortex (36 PCW) as probes for deep- and superficial-layer cortical identify (Supplementary Fig. 3). On the surface of the hCSs, we observed a layer of horizontal cells expressing reelin (RELN), suggestive of a MZ19 (Fig. 2i). We then used the validated markers to quantify the relative proportion of cells on cryosections at three separate time points (Fig. 2j). The T-box homeobox protein TBR1 localized in SP and CP and later in layers V–VI20, and reached a peak of expression (40.7% ± 0.3 of all cells, mean ± s.e.m.) at day 76 (equivalent of SP and CPi). CTIP2, a transcription factor involved in specifying subcortical projection neurons21,22, was highly expressed early in hCSs, and decreased over time after the in vitro stage equivalent to the early mid-fetal period, as shown in the human neocortex13. In contrast, superficial-layer cortical markers increased up to sevenfold from day 52 to day 137 in vitro. The transcription factor BRN2 (or POU3F2), which is expressed in late cortical progenitors and migrating neurons23, reached a peak of expression earlier than SATB2, which defines corticocortical projecting neurons21,22. The relative proportion of superficial-layer neurons was also confirmed by the expression of the homeodomain family proteins CUX1 and CUX2, whose expression is mostly localized to layers II–IV20,24. We found that the generation of these neurons is highly reproducible between hiPSC lines and within and across differentiations of the same hiPSC line (Supplementary Fig. 4). To provide independent validation of the quantification of neural populations from cryosections, we dissociated hCSs into single-cell suspensions and used flow cytometry to quantify the proportion of distinct cell populations (Supplementary Fig. 5).
We noticed that layer-specific cortical neurons in hCSs were organized concentrically around a VZ-like zone (Fig. 2k,l). Deep-layer neurons expressing TBR1 and CTIP2 moved immediately outside the proliferative zone, whereas at in vitro day 137, superficial-layer cortical neurons expressing SATB2 and BRN2 had migrated farther away, forming the outside layer of the hCSs. We also examined whether the colocalization of some of these cortical markers was consistent with in vivo studies. Indeed, flow cytometry experiments indicated that the mutually exclusive CTIP2 and SATB2 proteins21, which regulate alternate corticofugal and corticocortical cellular identity programs, were coexpressed by fewer than 3% of the cells (Fig. 2m). Conversely, as expected from a laminated cortical anlage, the cortical-layer markers TBR1 and CTIP2, which are expressed by subtypes of corticofugal neurons in deep layers and a small proportion of neurons in layer II, were colocalized in ~30% of the cells at day 76 in vitro (Fig. 2n).
We next explored whether the order of in vitro generation of cortical-layer neurons reflected the in vivo developmental program by labeling cells with EdU for 48 h at day 55 (Fig. 2o,p). Three weeks later, we observed that although the vast majority of SATB2+ cells colocalized with EdU, almost no TBR1+ cells showed EdU labeling. This indicates that most of the superficial-layer neurons are formed after 8 weeks of differentiation in vitro. This process continues for at least another 7 weeks, until the proportion of superficial- and deep-layer neurons is approximately equal (Fig. 2j).
Identification and verification of astrogenesis in hCSs
Both neurons and astrocytes share a common neuroepithelial origin and are born throughout embryogenesis in a temporally defined manner25,26. We hypothesized that because of the longer exposure to FGF2 and EGF, progenitors in the proliferative zones of hCSs would ultimately undergo a neurogenesis-to-gliogenesis switch. At early time points, dividing GFAP+ cells that coexpress PAX6 or TBR2 were localized only inside the VZ/SVZ-like zones (Fig. 2c–f). However, after ~7 weeks of differentiation in vitro, we observed astrocytes with thin GFAP+ processes intermingled with NEUN+ cells in the hCS parenchyma (Fig. 3a–d). As expected, we observed few GFAP+ cells over the first 35 d of differentiation (2.7% ± 0.7), but this number increased to ~8% by day 76 and almost 20% after 180 d. To better investigate the ultrastructure of the neuroglial architecture in hCSs, we used array tomography, a high-resolution imaging technique based on the use of ribbons of ultrathin serial sections (70 nm)27. We observed numerous GFAP+ branches traversing the dense neuropil and intricately intertwined with neuronal MAP2+ processes (Fig. 3b).
Figure 3.
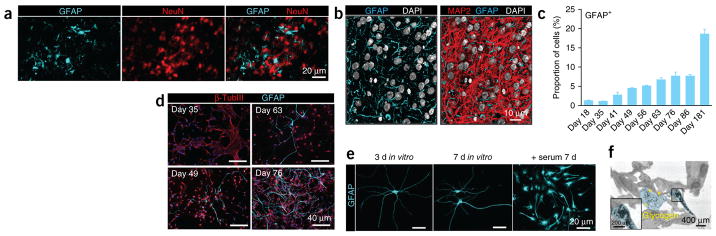
Astrogenesis in cortical hCSs. (a) The micrographs show hCSs at 76 d of in vitro differentiation stained for the indicated markers. (b) Volume rendering by array tomography of the interior of a hCS (74 × 88 × 2.45 μm) revealing the commingling of MAP2 (red) staining of neuronal dendrites and GFAP (cyan) staining of glial processes. DAPI staining for nuclei is rendered in white. (c,d) Developmental time course (3 weeks to 6 months in vitro) for the generation of GFAP+ cells. Quantification performed in dissociated hCSs (mean ± s.e.m.; n = 3 for all time points except for day 63, when n = 4; ANOVA F8,19 = 66.75, P < 0.0001). (e) Astrocyte morphology after the indicated periods of in vitro culture in monolayer in defined, serum-free medium and after a 1-week exposure to serum. (f) Transmission electron micrograph of a hCS section. An astrocyte process is pseudocolored in cyan; the inset shows granules (yellow arrowheads) within a hCS.
We also closely examined the morphology of GFAP+ cells after dissociation. When maintained in monolayer in defined serum-free culture conditions28, astrocytes extended abundant thin projections (Fig. 3e). To investigate whether these cells could respond to reactive cues in vitro, we added serum, which is a potent activator of reactive astrogliosis29, to the culture medium. Within several days, the cells adopted a reactive phenotype with polygonal morphologies and upregulated expression of genes associated with in vivo astrogliosis, including GFAP, VIM and LCN2 (ref. 30) (Supplementary Fig. 6). Finally, using electron microscopy, we confirmed that the thin GFAP+ processes dispersed throughout the hCSs contained numerous glycogen granules (Fig. 3f), which are predominantly localized in astrocytes in the mammalian brain31.
Functional maturation and synaptogenesis in hCSs
Next we tested the ability of the cells in hCSs to differentiate into electrically active mature neurons. We dissociated ~130-day-old hCSs and cultured cells in monolayer for 2 weeks before imaging them using the ratiometric calcium dye Fura-2. We observed that neurons displayed abundant spontaneous calcium spikes (Fig. 4a,b). We also directly loaded hCSs with the calcium indicator Fluo-4, sectioned hCSs and acutely imaged them with a confocal microscope (n = 3 hCSs). Again, we observed spontaneous calcium spikes (Supplementary Video 2). We then used patch clamping to record from human cortical neurons. All recorded neurons (n = 28 cells from hCSs differentiated from two hiPSC clones) produced a transient inward current after depolarization beyond −30 mV (Fig. 4c) that was blocked by tetrodotoxin (TTX) (Fig. 4d). This inward voltage-gated Na+ current was followed by activation of a more sustained K+ current. Importantly, depolarizing current injection revealed that all of the recorded neurons reliably produced action potentials (n = 9 cells from hCSs differentiated from two hiPSC clones) (Fig. 4e).
Figure 4.
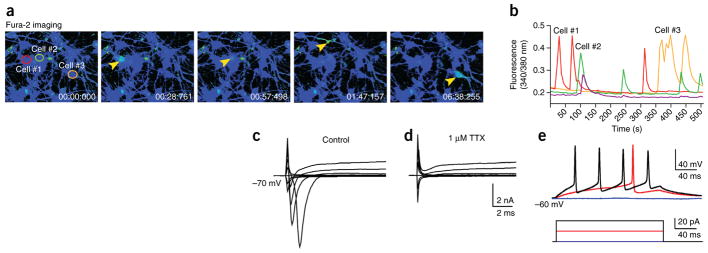
Functional characterization of cortical neurons from hCSs. (a) Time course of live calcium imaging in neurons dissociated from a hCS and cultured in monolayer (Fura-2 imaging). Arrowheads indicate active cells. (b) Average [Ca2+]i measurements in the neurons indicated in a (cells #1–3) demonstrating spontaneous activity. (c,d) A representative trace of whole-cell voltage-clamp Na+ current and K+ currents recorded in neurons from dissociated hCSs cultured in monolayer for 2 weeks (representative of data from 28 cells from hCSs differentiated from two hiPSC clones; 20-mV steps from −70 mV). TTX (1 μM) blocks Na+ currents. (e) Representative trace of a whole-cell current-clamp recording in human neurons from dissociated hCSs cultured in monolayer for 2 weeks (n = 9 cells from hCSs differentiated from two hiPSC clones). The trace shows action potential generation (red and black upper traces) in response to 20 pA current injections (lower traces).
Considering the functional maturity of the cortical neurons and the presence of astrocytes, we decided to investigate synaptogenesis within ~180-day-old hCSs. We used array tomography to visualize individual synapses27 within the dense neuropil of the hCSs (n = 5) and antibodies against multiple pre- and postsynaptic proteins to identify individual synapses with a high degree of confidence. We found that the presynaptic protein synapsin-1 (SYN-1) and postsynaptic protein PSD-95 were expressed throughout the interior of the hCSs in both large and small puncta (Fig. 5a). Larger SYN-1 puncta were often found adjacent to PSD-95 puncta, indicating the presence of a synapse. To examine these larger puncta in further detail, we constructed ‘synaptograms’ consisting of a series of high-resolution sections through a single synapse where we could probe for potential colocalization of at least three independent synaptic markers. In many cases, we observed colocalization of the presynaptic proteins SYN-1 and the glutamate transporter VGLUT1 in close apposition to postsynaptic protein PSD-95, indicating the presence of a glutamatergic synapse (Fig. 5b). In some cases, the NMDA receptor subunit NR2B was also colocalized with PSD-95 (data not shown). In addition, synaptic size was consistent with what was observed in the neuropil of the adult human cerebral cortex (N.A.O’R., S.J.S. et al., unpublished data).
Figure 5.

Synaptogenesis in hCSs. (a) The distribution of structural (MAP2, GFAP) and synaptic proteins (SYN-1, PSD-95) inside hCSs visualized with array tomography (volume: 29 × 29 × 2.45 μm). (b) ‘Synaptogram’ (70-nm sections) revealing a synapse inside a hCS. Twelve consecutive sections are represented in each row, and different antibody stains for the same section are represented in each column. (c,d) Representative traces of spontaneous EPSCs recorded at −70 mV in neurons derived in hCSs and cultured in monolayer for 2 weeks, testing the effect of 25 μM NBQX and 50 μM D-AP5 (c) or of TTX (d). (Quantification in Supplementary Fig. 7). (e) Cumulative distribution of EPSC inter-event interval in the absence or presence of TTX (P < 0.0001, Kolmogorov-Smirnov test, n = 10 cells). (f) Schematic illustrating slicing of hCSs, electrophysiological recordings (Record) and stimulation (Stim). (g) Representative EPSC traces recorded before (black) and during (blue) application of kynurenic acid in an acute slice preparation. (h) Biocytin-filled neuron after recording. (i) Voltage-clamp recordings showing EPSCs after electrical stimulation in an acute hCS slice preparation. Composite of seven overlaid sweeps from a neuron. Inset shows stimulus evoked EPSCs at higher temporal resolution. The electrical stimulation artifact is designated by a red dot. Other examples and quantification shown in Supplementary Figure 8d,e. (j) Current clamp recordings of action potentials (black trace), EPSPs (red trace) and failures (blue trace) evoked by electrical stimulation (red dot) of hCS slices. Also see Supplementary Figure 8f.
We found that the majority (88.8%) of neurons exhibited spontaneous synaptic activity (n = 27 neurons from hCSs differentiated from two hiPSC clones). This activity was completely abolished by the application of the AMPA-receptor antagonist NBQX (25 μM) and the NMDA-receptor antagonist D-AP5 (50 μM) (P = 0.001), suggesting that synaptic currents are due solely to the activation of glutamate receptors (Fig. 5c; Supplementary Fig. 7a). Further characterization of the synaptic activity revealed that TTX (1 μM) reduced the amplitude (n = 10 cells, P < 0.0001) and frequency of excitatory postsynaptic currents (EPSCs; n = 10, P = 0.002) by approximately 50% (Fig. 5d,e, Supplementary Fig. 7; hCSs differentiated from two hiPSC clones), suggesting that half of the events observed were evoked by action potential–dependent vesicle release and the remainder were due to spontaneous vesicle release.
To characterize the neural network in an increasingly intact system, we sliced hCSs into 250-μm sections and performed acute whole-cell recordings (Fig. 5f). We found that 80% of neurons (n = 15 cells from hCSs differentiated from two hiPSC clones) fire action potentials in response to depolarizing current steps from a holding potential of −65 mV (Supplementary Fig. 8a). The large majority of neurons (86%, n = 15; cells from hCSs differentiated from two hiPSC clones) showed spontaneous synaptic activity (Fig. 5g; Supplementary Fig. 8b) that was reduced by kynurenic acid, a glutamate receptor blocker (Fig. 5g; Supplementary Fig. 8c; n = 6 cells; P = 0.0008). Following patch-clamp recordings, neurons were labeled with biocytin to reveal their morphology (Fig. 5h). Importantly, in response to extracellular electrical stimulation, we observed large-amplitude excitatory postsynaptic potentials (EPSPs; >20 pA), demonstrating that cortical neurons in hCSs participate in network activity (Fig. 5i; Supplementary Fig. 8d,e). To determine whether these synaptic responses are capable of driving spike firing in hCS neurons, we performed current-clamp recordings in which no holding current was applied while administering periodic electrical stimulation. Single spikes as well as burst events were observed after stimulation (Fig. 5j; Supplementary Fig. 8f). Spontaneous spiking events were also observed in the absence of stimulation. These results demonstrate that an active network exists within hCSs that is capable of producing complex synaptic events associated with postsynaptic neuronal spike firing.
DISCUSSION
To date, several approaches have been developed for differentiating pluripotent stem cells into cortical neurons. Some of these methods achieve neural induction in high-density monolayer cultures10 or by embedding clusters of hiPSCs in gelatinous protein mixtures (such as Matrigel) and later culturing them in a spinning bioreactor8. Other approaches use embryoid bodies derived from hiPSCs that are either plated on coated surfaces to generate neural progenitors organized in rosettes32–34 or maintained in suspension initially in serum-free conditions and later in serum and Matrigel (for example, SFEBq: serum-free floating culture of embryoid body–like aggregates with quick reaggregation)6,7. Here we describe an approach for in vitro neural differentiation of human pluripotent stem cells that has several advantages.
The method is simple and does not involve cell (re)-plating, embedding into extracellular matrices or culture in complex environments. hCSs are maintained in floating conditions on low-attachment plates with biweekly changes of regular serum-free Neurobasal with B-27 medium (Invitrogen), and can be easily maintained for up to 9 months in vitro. Moreover, the specification of hCS, as well as the functional properties of the resulting cells, are reproducible between hiPSC lines and differentiation experiments.
This system also provides a platform on which, together with deep and superficial cortical neurons, human astrocytes are generated from an identical genetic background. Astrocytes powerfully control synapse formation and function and are critical for proper neural development35,36. In contrast to existing protocols for generating astrocytes from hiPSCs or by direct conversion37,38, here the astrocytes dispersed throughout the hCS develop spontaneously without the need for ciliary neurotrophic factor (CNTF), leukemia inhibitory factor (LIF) or serum, which are known activators of astrocytes. It is likely that the generation and close spatial integration of astrocytes inside hCSs mediate synaptogenic mechanisms that ultimately produce robust synaptic responses39,40. In fact, neurons in the hCS are more transcription-ally and electrophysiologically mature than neurons generated through conventional methods.
Finally, and importantly, hCSs are amenable to slice physiology techniques, which have been extensively used to study circuits in animal brain slices. Excitatory neurons within acutely prepared slices are capable of complex synaptic events that result in postsynaptic neuronal spike firing, making hCSs an attractive model for investigating neural network activity in human cells.
hCSs represent a versatile platform for patterning and specification of various neuronal and glial cell types as well as for designing large-scale drug screening in vitro. With the ability to derive hiPSCs from unique patient populations, this approach may prove a convenient and physiologically relevant platform for studying neuropsychiatric disorders, including synaptopathies and epilepsies.
ONLINE METHODS
Culture of hiPSCs
hiPSCs were cultured on irradiated DR4 mouse embryonic fibroblast feeders in the following cell culture media: DMEM/F12 (1:1) (Invitrogen) containing 20% KnockOut Serum (Invitrogen), 1 mM non-essential amino acids (Invitrogen, 1:100), GlutaMax (Invitrogen, 1:100), 0.1 nM β-mercaptoethanol (Sigma-Aldrich), 100 U/ml penicillin and 100 μg/ml streptomycin (Invitrogen) and 10–15 ng/ml FGF2 (R&D Systems).
The lines/clones of hiPSC used in this study were validated using standardized methods as previously shown32,41. Cultures are regularly tested and maintained mycoplasma free. A total of seven iPSC lines (6593-8, 8343-3, 1804-5, NH1-1, 8858-1, 8858-3, 8858-C) derived from five subjects were used for experiments. Approval for this study was obtained from the Stanford IRB Panel and informed consent was obtained from all subjects.
Generation of hCSs from hiPSCs
For dissociating intact colonies of pluripotent stem cells from the layer of DR4 feeders, hiPSCs were exposed to a low concentration of dispase (Invitrogen: 17105-041; 0.7 mg/ml) for ~30 min. Suspended colonies were subsequently transferred into ultra-low-attachment 100 mm plastic plates (Corning) in hiPSC medium without FGF2. For the first 24 h (day 0), the medium was supplemented with the ROCK inhibitor Y-27632 (EMD Chemicals). For neural induction, dorsomorphin (also known as compound C; Sigma 10 μM) and SB-431542 (Tocris, 10 μM) were added to the medium for the first five days. On the sixth day in suspension, the floating spheroids were moved to neural medium (NM) containing Neurobasal (Invitrogen: 10888), B-27 serum substitute without vitamin A (Invitrogen: 12587), GlutaMax (Invitrogen, 1:100), 100 U/ml penicillin and 100 μl streptomycin (Invitrogen). The NM was supplemented with 20 ng/ml FGF2 (R&D Systems) and 20 ng/ml EGF (R&D Systems) for 19 days with daily medium change in the first 10 days, and every other day for the subsequent 9 days. To promote differentiation of the neural progenitors into neurons, FGF2 and EGF were replaced with 20 ng/ml BDNF (Peprotech) and 20 ng/ml NT3 (Peprotech) starting at day 25, while from day 43 onwards only NM without growth factors was used for medium changes every four days.
Cryopreservation
hCSs were fixed in 4% paraformaldehyde (PFA) overnight. They were then washed in PBS, transferred in a 30% sucrose solution and kept at 4 °C for 48–72 h. Subsequently, they were transferred into embedding medium (Tissue-Tek OCT Compound 4583, Sakura Finetek), snap-frozen on dry ice and stored at −80 °C. For immunohistochemistry, 10 μm thick sections were obtained using a cryostat.
Immunohistochemistry
Cryosections were washed with PBS to remove excess OCT and blocked in 10% normal goat serum (NGS), 0.1% bovine serum albumin (BSA), 0.3% Triton X-100 diluted in PBS for one hour at room temperature. The sections were then incubated overnight at 4 °C with primary antibodies diluted in solution containing 2% NGS and 0.1% Triton X-100. PBS was used to wash the primary antibodies and the cryosections were incubated with secondary antibodies containing 2% NGS and 0.1% Triton X-100 for 1 h. The following primary antibodies were used for immunocytochemistry: PAX6 (rabbit, 1:300; Covance: PRB-278P), PAX6 (mouse, 1:300; DSHB), p-vimentin (mouse, 1:2,000; Abcam: ab22651), N-CAD (mouse, 1:50; Santa Cruz: 8424), FOXG1 (rabbit, 1:500; NCFAB), NEUN (mouse, 1:500, Millipore: MAB377), MAP2 (guinea pig, 1:1,000; Synaptic Systems: 188004), GFAP (rabbit; 1:500; DAKO: Z0334), SATB2 (mouse, 1:50; Abcam: AB51502), CTIP2 (rat, 1:300; Abcam: AB18465), TBR1 (rabbit, 1:200; Abcam: AB31940), TBR2 (rabbit, 1:300; Abcam: AB23345), BRN2 (mouse, 1:50; Millipore: MABD51), RELN (mouse, 1:200; MBL: D223-3). Alexa Fluor Dyes (LifeTechnologies) were used at 1:1,000 dilution for amplifying the signal. Nuclei were visualized with Hoechst 33258 (LifeTechnologies, 1:10,000). Cryosections were mounted for microscopy on glass coverslips, using Aquamount (ThermoScientific) and imaged on a Zeiss M1 Axioscope with a 10×, 20×, 40× or 63× objective. All cells expressing a particular marker were counted on sections and normalized to the total number of cells.
Gene expression
RNA was isolated using the miRNeasy Micro Kit (Qiagen) and RNA integrity was assessed by obtaining a RIN score on the Agilent 2100 Bioanalyzer. All of the RNA samples had a RIN > 8. Total RNAs were amplified, labeled and hybridized on HumanHT-12 v4 Expression BeadChips (Illumina) according to the manufacturer’s protocol. Microarray data was analyzed with custom R scripts calling Bioconductor (http://www.bioconductor.org/) packages. Briefly, outlier arrays were detected based on low inter-sample correlations. Raw expression data was log2 transformed, and quantile normalized. Probes were considered robustly expressed if the detection P value was <0.05 for at least half of the samples in the data set. Regional brain and temporal identify of the cells was assessed using CoNTExt (http://context.semel.ucla.edu/).
Flow cytometry
Cells were stained with a viability dye (Live/ Dead Blue, Invitrogen, 1:1,000 in PBS) for 10 min on ice in the dark. A volume of 100 μl of PBS was subsequently added to the cell suspension and the pellet was spanned down at 1,800 rpm for five minutes. The supernatant was decanted and cell pellets were subjected to intracellular staining. For intracellular staining, cells were permeabilized with a transcription factor staining buffer set (eBiosciences). Briefly, cell pellets were resuspended in 200 μl permeabilization buffer and incubated on ice in the dark for 20 min. A 200 μl perm-wash buffer was subsequently added to cell suspension and the samples were centrifuged at 1,800 r.p.m. at 4 °C for five minutes. The supernatant was decanted and samples were stained with antibodies in 100 μl perm-wash buffer on ice in the dark for 20 min. Finally, 200 μl of PBS was added to the cell suspension and the samples were centrifuged at 1,800 r.p.m. at 4 °C for five minutes. Cell suspensions were stored in 1% PFA in PBS at 4 °C until analysis. The following antibodies were used: CTIP2 (rat, 1:100; Abcam: AB18465), TBR1 (rabbit, 1:100; Abcam: AB31940), BRN2 (mouse, 1:50; Millipore: MABD51), SATB2 (rabbit, 1:50; Epitomics, 2819-1), CUX1 (mouse, 1:100; Abnova: H00001523-M01). The anti-CUX2 antibody was generated in rat, tested in human fetal cortex and used at dilution of 1:100. The following secondaries were used: anti-rat Alexa 647, anti-mouse PE, anti-rabbit Alexa 488 (dilution 1:5,000). The LSRII system (BD Biosciences) was used for data acquisition, while data analysis was performed with FlowJo (Treestar). Cellular events were gated for singlets (FSC-A versus FSC-H) to exclude potential cell clumps. Dead cells were then excluded from singlet population by elimination of cells that stained positive for Live/dead Blue. Negative threshold gates were defined with control samples (secondary antibodies alone). Example FACS plots are shown in Supplementary Figure 2.
Live imaging
For visualizing radial glia, hCSs were infected with a lentivirus expressing EGFP under the human GFAP promoter (Lenti-GFAP::EGFP). At day 52 of differentiation in vitro, hCSs were sliced and VZ-like regions were imaged at 37 °C with a Leica SP8 confocal microscope for up to three hours.
Astrocyte methods
hCSs were enzymatically dissociated to make a single cell suspension using a method used previously for dissociating brain tissue42,43. Briefly, the tissue was incubated at 33 °C for 45 min in 20 ml of a papain solution containing Earle’s balanced salts (EBSS, Sigma, E7510), D-(+)-glucose (22.5 mM), NaHCO3 (26 mM), DNase (125 U/ml, Worthington, LS002007), papain (30 U/ml, Worthington LS03126), and L-cysteine (1 mM, Sigma, C7880). The papain solution was equilibrated with 5% CO2 and 95% O2 gas before and during treatment. The tissue was subsequently washed three times with an inhibitor buffer containing BSA (1.0 mg/ml, Sigma A-8806) and ovomucoid (also known as trypsin inhibitor, 1.0 mg/ml, Roche Diagnostics Corporation 109878) and then mechanically dissociated by gentle sequential trituration. Dissociated cells were layered on top of high concentration inhibitor solution with 5 mg/ml BSA and 5 mg/ml ovomucoid and centrifuged at 130 g for five minutes. The cell pellet was then resuspended in Dulbecco’s phosphate-buffered saline (DPBS, Invitrogen, 14287) containing 0.02% BSA and 12.5U/ml DNase and filtered through a 20 μm Nitex mesh (Sefar America Inc., Lab Pak 03-20/14) to remove undissociated cell clumps. Cell health was assessed by trypan blue exclusion. Only single cell suspensions with > 85% viability were used for experiments.
Real time quantitative PCR (qPCR)
mRNA was isolated using the RNeasy Mini kit and RNase-Free DNase set (Qiagen). Template cDNA was prepared by reverse transcription using the SuperScript III First-Strand Synthesis SuperMix for qRT-PCR (Invitrogen). Gene expression was quantified using real time qPCR in combination with gene specific primers and the SYBR GREEN system (Roche). The reactions were performed on an Eppendorf Realplex4 cycler (Eppendorf). All samples (n = 3) were run in duplicate. Values were normalized to GAPDH expression. The following primers were used: GADPH-fw, 5′-GAACGGGAAGCTTGTCATCAA-3′; GADPH-rev, 5′-ATCGCCCCACTTGATTTTGG-3′; GFAP-fw, 5′-GAGAA CCGGATCACCATTCC-3′; GFAP-rev, 5′-CCCAGTCTGGAGCA ACCTAC-3′; LCN2-fw, 5-GTTACCTCGTCCGAGTGGTG-3′; LCN2-rev, 5′-TTGGTTCTCCCGTAGAGGGT-3′; VIM-fw, 5′-CTC CGGGAGAAATTGCAGGA-3′; VIM-rev, 5′-TTCAAGGTCAA GACGTGCCA-3′.
Array tomography (AT)
AT was carried out according to previously published protocols44. Briefly, hCSs were removed from their growth medium and immediately fixed with 4% PFA, 2.5% sucrose in PBS. The tissue was embedded and sectioned into ribbons of 70 nm thick serial sections (30–50 sections/ribbon). Ribbons were stained in four consecutive sessions with the following antibodies: PSD-95 (rabbit, 1:200; Cell Signaling 34505), VGLUT1 (guinea pig, 1:5,000; Millipore: AB5905), SYN-1 (rabbit, 1:500; Cell Signaling: 52975), MAP2 (guinea pig, 1:1,000; Synaptic Systems: 188 004), GFAP (rabbit, 1:500; DAKO: Z0334), NR2B (mouse, 1:500; Neuromab: 75–101). The images were processed and registered for volume reconstruction using plugins from FIJI/ImageJ. The final volumes were rendered using AxioVision software (rel. 4.7, Zeiss).
Calcium imaging
For calcium imaging in monolayer, hCSs were dissociated and cultured for two weeks. Cells were loaded with 1 μM Fura-2 acetoxymethyl ester (Invitrogen) for 30 min at 37 °C in Neurobasal supplemented with B-27, washed with Tyrode’s solution (5 mM KCl, 129 mM NaCl, 2 mM CaCl2, 1 mM MgCl2, 30 mM glucose and 25 mM HEPES, pH 7.4) and placed in a perfusion chamber on the stage of an inverted fluorescence microscope (TE2000U; Nikon). Imaging was performed at room temperature (23–25 °C) on an epifluorescence microscope equipped with an excitation filter wheel and an automated stage. The Openlab software (PerkinElmer) was used to collect and quantify time-lapse excitation ratio images, and fluorescence images were analyzed with the IGOR Pro software (WaveMetrics). For calcium imaging in 3D cultures, intact hCSs were loaded with 1 μM Fluo-4 acetoxymethyl ester (Invitrogen) for 30 min at 37 °C in Neurobasal supplemented with B-27, washed and sliced in half. Live imaging was performed at the NMS (Stanford Neuroscience Microscopy Service, supported by a US National Institute of Health grant, NS069375) using a Zeiss LSM780 confocal microscope.
Monolayer electrophysiology
Whole-cell patch-clamp recordings from dissociated hCSs were performed at room temperature in an isotonic saline solution (NaCl 125 mM, NaHCO3 25 mM, KCl 2.5 mM, NaH2PO4 1.25 mM, glucose 25 mM, MgCl2 1 mM, CaCl2 2 mM). Patch electrodes with resistances of 2.5–3.5 MΩ were pulled from thick-walled borosilicate glass capillaries and were filled with an internal solution containing potassium gluconate 130 mM, NaCl 4 mM, EGTA 5 mM, CaCl2 0.5 mM, HEPES 10 mM, MgATP 4 mM, Na2GTP 0.5 mM (pH 7.2 with KOH). Voltage-gated sodium and potassium currents were elicited with a series of voltage steps (from −110 to 10 mV, in 20 mV increments) from a holding potential of −70 mV. Spontaneous synaptic transmission was monitored in voltage-clamp from a holding potential of −70 mV. Action potentials evoked in response to current injection were recorded from the resting potential of the cell (applying 20 pA steps for 200 ms). Series resistance was monitored throughout the recording and was <20 MΩ. NBQX (25 μM, Tocris) and D-AP5 (50 μM, Tocris) were used to inhibit AMPA-receptor mediated and NMDA-receptor mediated excitatory synaptic responses, respectively. TTX (1 μM, Alomone) was used to block voltage-gated Na+ currents and record mEPSCs. An Axopatch 200A amplifier (Molecular Devices) was used for voltage and current clamp, and electrode junction potentials were compensated. Data were sampled at 50 kHz and filtered at 1 kHz using pClamp 9.2, and offline analysis was performed using Clampfit 10.3 (Molecular Devices). All electrophysiological experiments were performed between day 90 and 130 of in vitro differentiation.
Slice preparation
hCSs were removed from Neurobasal–B-27 medium, quickly fixed to a block of 4% agarose, and covered in ice-cold oxygenated (95% O2 and 5% CO2) ACSF containing 126 mM NaCl, 2.5 mM KCl, 1.25 mM NaH2PO4, 2 mM MgCl2, 2 mM CaCl2, 26 mM NaHCO3 and 10 mM glucose. Slices with a 250 μm thickness were cut using a Leica VT1200 vibrating microtome. After slicing, sections were moved to continuously oxygenated, warm (~32 °C) ACSF. Slices were incubated in warm ACSF for at least one hour before recording.
Slice electrophysiology
Whole cell patch clamp recordings were made at 22–25 °C. Slices were superfused at a rate of 3 ml min−1. Patch-clamp recordings were made using a MultiClamp 700A amplifier with Clampex 10.3 software. 3–5 MΩ borosilicate glass recording electrodes were filled with internal solution containing 120 mM potassium gluconate, 11 mM KCl, 1 mM MgCl2, 1 mM CaCl2, 10 mM HEPES, 1 mM EGTA, pH adjusted to 7.4 with KOH (290 mOsm). To determine if EPSCs recorded in voltage clamp are glutamate dependent, the glutamate receptor blocker kynurenic acid (1 mM) was added to the bath solution following at minimum 5 min of baseline recording. Evoked responses were produced by extracellular monopolar tungsten electrode placed 100–300 μm from the whole cell recording. At the end of the recording, biocytin was added to the internal solution, and the slice was fixed and immunostained (Streptavidin, Alexa Fluor 555 conjugate, Life Technologies) to visualize neuronal morphology. All electrophysiological experiments were performed between days 90 and 130 of in vitro differentiation.
Supplementary Material
Acknowledgments
We thank R. Dolmetsch, R. O’Hara, U. Francke and J. Hallmayer for valuable scientific advice and discussions, and also acknowledge E. Engleman and the Stanford Blood Flow Cytometry Center for technical advice and support, J. Ou for assistance with RNA preparation, and D. Castaneda-Castellanos for assistance with live imaging. This work was supported by a NARSAD Young Investigator Award (Behavioral and Brain Foundation), US National Institute of Mental Health (NIMH) 1R01MH100900 and 1R01MH100900-02S1, MQ Fellow Award and Startup Funds from Stanford University (to S.P.P.); NIMH R01 MH099555-03 (to B.A.B.); NIMH T32GM007365, F30MH106261 and Bio-X Predoctoral Fellowship (to or supporting S.A.S.); NIMH 5R37 MH060233 and 5R01 MH094714 (to D.H.G.); NIH R01NS075252, R21MH099797 and R01NS092474 (to S.J.S.); and the DGIST R&D Program of the Korean Ministry of Science and ICT & Future Planning, 14-BD-16 (to C.H.K.).
Footnotes
Accession code. GEO: GSE68917.
Note: Any Supplementary Information and Source Data files are available in the online version of the paper.
AUTHOR CONTRIBUTIONS
A.M.P., S.A.S. and S.P.P. conceived the project. A.M.P., S.A.S., L.E.C., Y.T., C.D.M., C.H.K., J.-Y.P., N.A.O’R., K.D.N., N.H., S.J.S., J.R.H., D.H.G., B.A.B. and S.P.P. planned and/or executed experiments. A.M.P., S.A.S. and S.P.P. wrote the paper with input from all authors. S.P.P. supervised all aspects of the work.
COMPETING FINANCIAL INTERESTS
The authors declare no competing financial interests.
References
- 1.Dolmetsch R, Geschwind DH. The human brain in a dish: the promise of iPSC-derived neurons. Cell. 2011;145:831–834. doi: 10.1016/j.cell.2011.05.034. [DOI] [PMC free article] [PubMed] [Google Scholar]
- 2.Takahashi K, Yamanaka S. Induction of pluripotent stem cells from mouse embryonic and adult fibroblast cultures by defined factors. Cell. 2006;126:663–676. doi: 10.1016/j.cell.2006.07.024. [DOI] [PubMed] [Google Scholar]
- 3.Tabar V, Studer L. Pluripotent stem cells in regenerative medicine: challenges and recent progress. Nat Rev Genet. 2014;15:82–92. doi: 10.1038/nrg3563. [DOI] [PMC free article] [PubMed] [Google Scholar]
- 4.Brennand KJ, Simone A, Tran N, Gage FH. Modeling psychiatric disorders at the cellular and network levels. Mol Psychiatry. 2012;17:1239–1253. doi: 10.1038/mp.2012.20. [DOI] [PMC free article] [PubMed] [Google Scholar]
- 5.Paşca SP, Panagiotakos G, Dolmetsch RE. Generating human neurons in vitro and using them to understand neuropsychiatric disease. Annu Rev Neurosci. 2014;37:479–501. doi: 10.1146/annurev-neuro-062012-170328. [DOI] [PubMed] [Google Scholar]
- 6.Mariani J, et al. Modeling human cortical development in vitro using induced pluripotent stem cells. Proc Natl Acad Sci USA. 2012;109:12770–12775. doi: 10.1073/pnas.1202944109. [DOI] [PMC free article] [PubMed] [Google Scholar]
- 7.Kadoshima T, et al. Self-organization of axial polarity, inside-out layer pattern, and species-specific progenitor dynamics in human ES cell-derived neocortex. Proc Natl Acad Sci USA. 2013;110:20284–20289. doi: 10.1073/pnas.1315710110. [DOI] [PMC free article] [PubMed] [Google Scholar]
- 8.Lancaster MA, et al. Cerebral organoids model human brain development and microcephaly. Nature. 2013;501:373–379. doi: 10.1038/nature12517. [DOI] [PMC free article] [PubMed] [Google Scholar]
- 9.Brennand KJ, Gage FH. Modeling psychiatric disorders through reprogramming. Dis Model Mech. 2012;5:26–32. doi: 10.1242/dmm.008268. [DOI] [PMC free article] [PubMed] [Google Scholar]
- 10.Chambers SM, et al. Highly efficient neural conversion of human ES and iPS cells by dual inhibition of SMAD signaling. Nat Biotechnol. 2009;27:275–280. doi: 10.1038/nbt.1529. [DOI] [PMC free article] [PubMed] [Google Scholar]
- 11.Sarnat HB, Nochlin D, Born DE. Neuronal nuclear antigen (NeuN): a marker of neuronal maturation in early human fetal nervous system. Brain Dev. 1998;20:88–94. doi: 10.1016/s0387-7604(97)00111-3. [DOI] [PubMed] [Google Scholar]
- 12.Stein JL, et al. A quantitative framework to evaluate modeling of cortical development by neural stem cells. Neuron. 2014;83:69–86. doi: 10.1016/j.neuron.2014.05.035. [DOI] [PMC free article] [PubMed] [Google Scholar]
- 13.Kang HJ, et al. Spatio-temporal transcriptome of the human brain. Nature. 2011;478:483–489. doi: 10.1038/nature10523. [DOI] [PMC free article] [PubMed] [Google Scholar]
- 14.Miller JA, et al. Transcriptional landscape of the prenatal human brain. Nature. 2014;508:199–206. doi: 10.1038/nature13185. [DOI] [PMC free article] [PubMed] [Google Scholar]
- 15.Englund C, et al. Pax6, Tbr2, and Tbr1 are expressed sequentially by radial glia, intermediate progenitor cells, and postmitotic neurons in developing neocortex. J Neurosci. 2005;25:247–251. doi: 10.1523/JNEUROSCI.2899-04.2005. [DOI] [PMC free article] [PubMed] [Google Scholar]
- 16.Hansen DV, Lui JH, Parker PR, Kriegstein AR. Neurogenic radial glia in the outer subventricular zone of human neocortex. Nature. 2010;464:554–561. doi: 10.1038/nature08845. [DOI] [PubMed] [Google Scholar]
- 17.Weissman T, Noctor SC, Clinton BK, Honig LS, Kriegstein AR. Neurogenic radial glial cells in reptile, rodent and human: from mitosis to migration. Cereb Cortex. 2003;13:550–559. doi: 10.1093/cercor/13.6.550. [DOI] [PubMed] [Google Scholar]
- 18.Taverna E, Huttner WB. Neural progenitor nuclei IN motion. Neuron. 2010;67:906–914. doi: 10.1016/j.neuron.2010.08.027. [DOI] [PubMed] [Google Scholar]
- 19.Meyer G, Goffinet AM. Prenatal development of reelin-immunoreactive neurons in the human neocortex. J Comp Neurol. 1998;397:29–40. [PubMed] [Google Scholar]
- 20.Saito T, et al. Neocortical layer formation of human developing brains and lissencephalies: consideration of layer-specific marker expression. Cereb Cortex. 2011;21:588–596. doi: 10.1093/cercor/bhq125. [DOI] [PubMed] [Google Scholar]
- 21.Alcamo EA, et al. Satb2 regulates callosal projection neuron identity in the developing cerebral cortex. Neuron. 2008;57:364–377. doi: 10.1016/j.neuron.2007.12.012. [DOI] [PubMed] [Google Scholar]
- 22.Britanova O, et al. Satb2 is a postmitotic determinant for upper-layer neuron specification in the neocortex. Neuron. 2008;57:378–392. doi: 10.1016/j.neuron.2007.12.028. [DOI] [PubMed] [Google Scholar]
- 23.Sugitani Y, et al. Brn-1 and Brn-2 share crucial roles in the production and positioning of mouse neocortical neurons. Genes Dev. 2002;16:1760–1765. doi: 10.1101/gad.978002. [DOI] [PMC free article] [PubMed] [Google Scholar]
- 24.Zeng H, et al. Large-scale cellular-resolution gene profiling in human neocortex reveals species-specific molecular signatures. Cell. 2012;149:483–496. doi: 10.1016/j.cell.2012.02.052. [DOI] [PMC free article] [PubMed] [Google Scholar]
- 25.Shen Q, et al. The timing of cortical neurogenesis is encoded within lineages of individual progenitor cells. Nat Neurosci. 2006;9:743–751. doi: 10.1038/nn1694. [DOI] [PubMed] [Google Scholar]
- 26.Bayer SA, Altman J. Neocortical Development. Raven Press; New York: 1991. [Google Scholar]
- 27.Micheva KD, Smith SJ. Array tomography: a new tool for imaging the molecular architecture and ultrastructure of neural circuits. Neuron. 2007;55:25–36. doi: 10.1016/j.neuron.2007.06.014. [DOI] [PMC free article] [PubMed] [Google Scholar]
- 28.Foo LC, et al. Development of a method for the purification and culture of rodent astrocytes. Neuron. 2011;71:799–811. doi: 10.1016/j.neuron.2011.07.022. [DOI] [PMC free article] [PubMed] [Google Scholar]
- 29.McCarthy KD, de Vellis J. Preparation of separate astroglial and oligodendroglial cell cultures from rat cerebral tissue. J Cell Biol. 1980;85:890–902. doi: 10.1083/jcb.85.3.890. [DOI] [PMC free article] [PubMed] [Google Scholar]
- 30.Zamanian JL, et al. Genomic analysis of reactive astrogliosis. J Neurosci. 2012;32:6391–6410. doi: 10.1523/JNEUROSCI.6221-11.2012. [DOI] [PMC free article] [PubMed] [Google Scholar]
- 31.Brown AM, Ransom BR. Astrocyte glycogen and brain energy metabolism. Glia. 2007;55:1263–1271. doi: 10.1002/glia.20557. [DOI] [PubMed] [Google Scholar]
- 32.Paşca SP, et al. Using iPSC-derived neurons to uncover cellular phenotypes associated with Timothy syndrome. Nat Med. 2011;17:1657–1662. doi: 10.1038/nm.2576. [DOI] [PMC free article] [PubMed] [Google Scholar]
- 33.Brennand KJ, et al. Modelling schizophrenia using human induced pluripotent stem cells. Nature. 2011;473:221–225. doi: 10.1038/nature09915. [DOI] [PMC free article] [PubMed] [Google Scholar]
- 34.Marchetto MC, et al. A model for neural development and treatment of Rett syndrome using human induced pluripotent stem cells. Cell. 2010;143:527–539. doi: 10.1016/j.cell.2010.10.016. [DOI] [PMC free article] [PubMed] [Google Scholar]
- 35.Pfrieger FW, Barres BA. Synaptic efficacy enhanced by glial cells in vitro. Science. 1997;277:1684–1687. doi: 10.1126/science.277.5332.1684. [DOI] [PubMed] [Google Scholar]
- 36.Ullian EM, Sapperstein SK, Christopherson KS, Barres BA. Control of synapse number by glia. Science. 2001;291:657–661. doi: 10.1126/science.291.5504.657. [DOI] [PubMed] [Google Scholar]
- 37.Krencik R, Weick JP, Liu Y, Zhang ZJ, Zhang SC. Specification of transplantable astroglial subtypes from human pluripotent stem cells. Nat Biotechnol. 2011;29:528–534. doi: 10.1038/nbt.1877. [DOI] [PMC free article] [PubMed] [Google Scholar]
- 38.Meyer K, et al. Direct conversion of patient fibroblasts demonstrates non-cell autonomous toxicity of astrocytes to motor neurons in familial and sporadic ALS. Proc Natl Acad Sci USA. 2014;111:829–832. doi: 10.1073/pnas.1314085111. [DOI] [PMC free article] [PubMed] [Google Scholar]
- 39.Allen NJ, et al. Astrocyte glypicans 4 and 6 promote formation of excitatory synapses via GluA1 AMPA receptors. Nature. 2012;486:410–414. doi: 10.1038/nature11059. [DOI] [PMC free article] [PubMed] [Google Scholar]
- 40.Eroglu C, et al. Gabapentin receptor alpha2delta-1 is a neuronal thrombospondin receptor responsible for excitatory CNS synaptogenesis. Cell. 2009;139:380–392. doi: 10.1016/j.cell.2009.09.025. [DOI] [PMC free article] [PubMed] [Google Scholar]
- 41.Yazawa M, et al. Using induced pluripotent stem cells to investigate cardiac phenotypes in Timothy syndrome. Nature. 2011;471:230–234. doi: 10.1038/nature09855. [DOI] [PMC free article] [PubMed] [Google Scholar]
- 42.Cahoy JD, et al. A transcriptome database for astrocytes, neurons, and oligodendrocytes: a new resource for understanding brain development and function. J Neurosci. 2008;28:264–278. doi: 10.1523/JNEUROSCI.4178-07.2008. [DOI] [PMC free article] [PubMed] [Google Scholar]
- 43.Dugas JC, Tai YC, Speed TP, Ngai J, Barres BA. Functional genomic analysis of oligodendrocyte differentiation. J Neurosci. 2006;26:10967–10983. doi: 10.1523/JNEUROSCI.2572-06.2006. [DOI] [PMC free article] [PubMed] [Google Scholar]
- 44.Micheva KD, Busse B, Weiler NC, O’Rourke N, Smith SJ. Single-synapse analysis of a diverse synapse population: proteomic imaging methods and markers. Neuron. 2010;68:639–653. doi: 10.1016/j.neuron.2010.09.024. [DOI] [PMC free article] [PubMed] [Google Scholar]
Associated Data
This section collects any data citations, data availability statements, or supplementary materials included in this article.