Abstract
India is experiencing an alarming rise in the burden of non-communicable diseases, but data on the incidence of chronic kidney disease (CKD) are sparse. Using the Center for Cardiometabolic Risk Reduction in South Asia surveillance study (a population-based survey of Delhi and Chennai, India) we estimated overall, and age-, sex-, city-, and diabetes-specific prevalence of CKD, and defined the distribution of the study population by the Kidney Disease Improving Global Outcomes (KDIGO) classification scheme. The likelihood of cardiovascular events in participants with and without CKD was estimated by the Framingham and Interheart Modifiable Risk Scores. Of 12,271 participants, 80% had complete data on serum creatinine and albuminuria. The prevalence of CKD and albuminuria, age standardized to the World Bank 2010 world population, were 8.7% (95% confidence interval: 7.9 to 9.4%) and 7.1% (6.4 to 7.7%) respectively. Nearly 80% of patients with CKD had an abnormally high hemoglobin A1c (5.7 and above). Based on KDIGO guidelines, 6.0, 1.0, and 0.5% of study participants are at moderate, high, or very high risk for experiencing CKD-associated adverse outcomes. The cardiovascular risk scores placed a greater proportion of patients with CKD in the high-risk categories for experiencing cardiovascular events, when compared with participants without CKD. Thus one in 12 persons living in two of India’s largest cities have evidence of CKD, with features that put them at high risk for adverse outcomes.
Keywords: Chronic kidney disease, albuminuria, epidemiology, cardiovascular disease, South Asians, resource-poor settings
Introduction
Prevalence of obesity and type 2 diabetes mellitus is rising rapidly in low- and middle-income countries (1, 2). Prevalence of chronic kidney disease (CKD) would be expected to rise in parallel but has been infrequently studied (3). Even in its early stages, CKD is associated with a two- to four-fold increase in the risk of death from cardiovascular causes (4). For patients who progress to end-stage renal disease, CKD is associated with enormous economic costs and early mortality (5).
India has experienced an explosion of non-communicable diseases, and several studies point to a high prevalence of cardiovascular disease and diabetes, even among younger persons (6, 7). Yet data on the burden of CKD in India remain scarce. Previous studies of CKD in India failed to apply a standard definition, were missing an assessment of albuminuria, or were not population-based (8–10).
To fill this gap, we analyzed data from the Center for Cardiometabolic Risk Reduction in South Asia (CARRS) surveillance study—a population-based survey of two major cities in India (Delhi and Chennai)—and estimated overall, and age-, sex-, city-, and diabetes-specific prevalence of CKD using a standardized definition from the 2012 Kidney Disease International Global Outcomes (KDIGO) CKD guidelines (11). We also estimated the impact of CKD on predicted risks for cardiovascular disease using the Framingham (FRS) and Interheart Modifiable Risk Scores (IHMRS) (12, 13).
Results
Table 1 describes the socio-demographic, anthropometric, and laboratory characteristics of participants (n=9,797). Mean age of participants was 41.4 (± 12.7) years for Chennai and 44.4 (±13.9) years for Delhi. A majority of participants received 5 years or more of education. More than 80% of women in each city were not employed in jobs outside of the home. There was a high prevalence of obesity as measured by waist-to-hip ratio or waist-to-height ratio.
TABLE 1.
Characteristics of Chennai and Delhi participants, CARRS Study (N=9797)
| Chennai N=5744 Mean ± SD or N (%) |
Delhi N=4053 Mean ± SD or N (%) |
|||
|---|---|---|---|---|
| Men | Women | Men | Women | |
| 2553 (44) | 3191 (56) | 2006 (49) | 2047 (51) | |
| Demographics | ||||
| Mean age (years) | 42.6 ± 13.0 | 40.4 ± 12.1 | 45.8 ± 13.5 | 44.4 ± 12.7 |
| 20 to 44 | 1511 (59) | 2093 (66) | 977 (49) | 1070 (52) |
| 45 to 64 | 881 (35) | 967 (30) | 821 (41) | 819 (40) |
| ≥ 65 | 161 (6) | 131 (4) | 208 (10) | 158 (8) |
| Education (years) | ||||
| < 1 to 4 | 123 (5) | 431 (14) | 166 (8) | 491 (24) |
| 5 to 12 | 1845 (72) | 2243 (70) | 1171 (59) | 1019 (50) |
| ≥ 12 | 402 (16) | 280 (9) | 584 (29) | 465 (23) |
| Occupation | ||||
| Not working# | 358 (14) | 2630 (82) | 312 (16) | 1801 (88) |
| Unskilled & semiskilled | 1077 (42) | 360 (11) | 605 (30) | 360 (4) |
| Skilled | 1058 (42) | 186 (6) | 881 (44) | 143 (7) |
| White collar | 60 (2) | 15 (1) | 208 (10) | 15 (1) |
| Asset index | ||||
| Low | 1083 (42) | 1444 (45) | 553 (27) | 606 (29) |
| Medium | 963 (38) | 1168 (37) | 495 (25) | 504 (25) |
| High | 507 (20) | 579 (18) | 958 (48) | 936 (46) |
| Current tobacco use | 979 (38) | 112 (4) | 757 (38) | 137 (7) |
| Anthropometry | ||||
| Abnormal WC† | 197 (8) | 873 (27) | 286 (14) | 916 (45) |
| Missing | 290 (11) | 138 (4) | 50 (2) | 53 (3) |
| Abnormal WHR╫ | 1729 (77) | 1301 (41) | 1497 (75) | 1222 (60) |
| Missing | 293 (12) | 139 (4) | 58 (3) | 62 (3) |
| Abnormal WHtRΩ | 1250 (49) | 1884 (59) | 1213 (61) | 1341 (66) |
| Missing | 707 (28) | 619 (19) | 317 (16) | 327 (16) |
| BMI (kg/m2) | ||||
| < 18.5 | 150 (6) | 119 (4) | 140 (7) | 106 (5) |
| 18.5 to <25 | 901 (35) | 832 (26) | 771 (38) | 571 (28) |
| 25 to < 30 | 612 (24) | 991 (31) | 523 (26) | 569 (28) |
| ≥ 30 | 136 (5) | 595 (19) | 201 (10) | 429 (21) |
| Missing | 750 (30) | 654 (31) | 371 (19) | 372 (18) |
| Laboratories and BP | ||||
| Fasting glucose (mg/dL) | ||||
| < 100 | 1666 (65) | 1901 (60) | 838 (42) | 882 (43) |
| 100 to < 126 | 410 (16) | 710 (22) | 751 (37) | 815 (40) |
| ≥ 126* | 477 (19) | 580 (18) | 414 (21) | 348 (17) |
| Missing | - | - | 3 (0.1) | 2 (0.1) |
| Hemoglobin A1c (%) | ||||
| < 5.7 | 1096 (43) | 1211 (38) | 556 (28) | 20 (1) |
| 5.7–6.4 | 836 (33) | 1238 (39) | 794 (40) | 644 (32) |
| ≥ 6.5* | 611 (24) | 737 (23) | 641 (32) | 790 (39) |
| Missing | 10 (0.4) | 5 (0.2) | 15 (0.8) | 593 (29) |
| Blood pressure (mmHg) | ||||
| Sys &/or Dias | ||||
| <120 & < 80 | 704 (28) | 1469 (46) | 417 (21) | 707 (35) |
| 120–139 or 80–89 | 847 (33) | 866 (27) | 728 (36) | 616 (30) |
| ≥ 140 or ≥ 90* | 737 (29) | 756 (24) | 848 (42) | 716 (35) |
| Missing | 265 (10) | 100 (3) | 13 (0.6) | 8 (0.4) |
Definitions:
Not working category includes home-makers or retired participants.
Abnormal waist circumference: > 102 cm for men, > 88 cm for women
Abnormal waist-to-hip ratio: > 0.9 for men, > 0.85 for women
Abnormal waist-to-height ratio: > 0.5
The highest blood pressure, fasting glucose and A1c category include participants who self-reported the condition and were on medications
Abbreviations: CARRS-Center for Cardiometabolic Risk Reduction in South Asia; WC-waist circumference; WHR: waist-to-hip ratio; WHtR: waist-to-height ratio; BMI: Body mass index; Sys-systolic; Dias-Diastolic
CKD prevalence
Chronic kidney disease was evident in 817 participants, corresponding to prevalence in the two cities of 7.5% (95% CI: 6.8 to 8.2%). After age-standardization to the World Bank 2010 world population structure, the prevalence was 8.7% (95% CI: 7.9 to 9.4%) for CKD and for albuminuria 7.1% (95% CI: 6.4 to 7.7%) (Table 2). A large majority (77.4% in men, 79.9% in women) of participants with CKD had stage 1 or 2 CKD (i.e., albuminuria with normal or near normal kidney function).
TABLE 2.
Prevalence of chronic kidney disease and albuminuria in the CARRS study
| Chennai Prevalence (95%CI) |
Delhi Prevalence (95%CI) |
Overall Prevalence (95%CI) |
|||
|---|---|---|---|---|---|
| Men | Women | Men | Women | ||
| CARRS | |||||
| CKD | 6.6 (5.1–8.0) | 6.5 (5.3–7.7) | 8.1 (6.5–9.7) | 9.4 (7.9–11.0) | 7.5 (6.8–8.2) |
| Albuminuria | 5.7 (4.3–7.0) | 6.2 (5.0–7.3) | 6.8 (5.5–8.2) | 7.9 (6.7–9.1) | 6.6 (5.9–7.2) |
| eGFR < 60 | 1.2 (0.7–1.7) | 0.9 (0.5–1.4) | 2.1 (1.3–3.0) | 2.5 (1.4–3.5) | 1.6 (1.2–2.0) |
| Age-standardized to World Population | |||||
| CKD | 7.5 (6.3–8.7) | 7.7 (6.0–9.4) | 9.0 (7.7–10.3) | 10.8 (9.3–12.3) | 8.7 (7.9–9.4) |
| Albuminuria | 6.2 (5.0–7.4) | 7.0 (5.5–8.5) | 7.1 (5.9–8.3) | 8.3 (7.1–9.5) | 7.1 (6.4–7.7) |
| eGFR < 60 | 1.7 (1.1–2.4) | 1.7 (0.8–2.6) | 3.1 (2.3–4.0) | 4.0 (2.9–5.1) | 2.6 (2.1–3.0) |
Prevalence of CKD, albuminuria (≥ 30 mg/g), and eGFR < 60 ml/min/1.73m2 in the CARRS study after adjusting for sampling probability and non-response, and age-standardized to census data from Chennai and Delhi. The second set of estimates also adjust for survey sampling but are age-standardized to the World Population as reported by the World Bank. Abbreviations: CARRS-Center for Cardiometabolic Risk Reduction in South Asia; CI-confidence interval; CKD-Chronic kidney disease eGFR-estimated glomerular filtration rate (in ml/min/1.73m2).
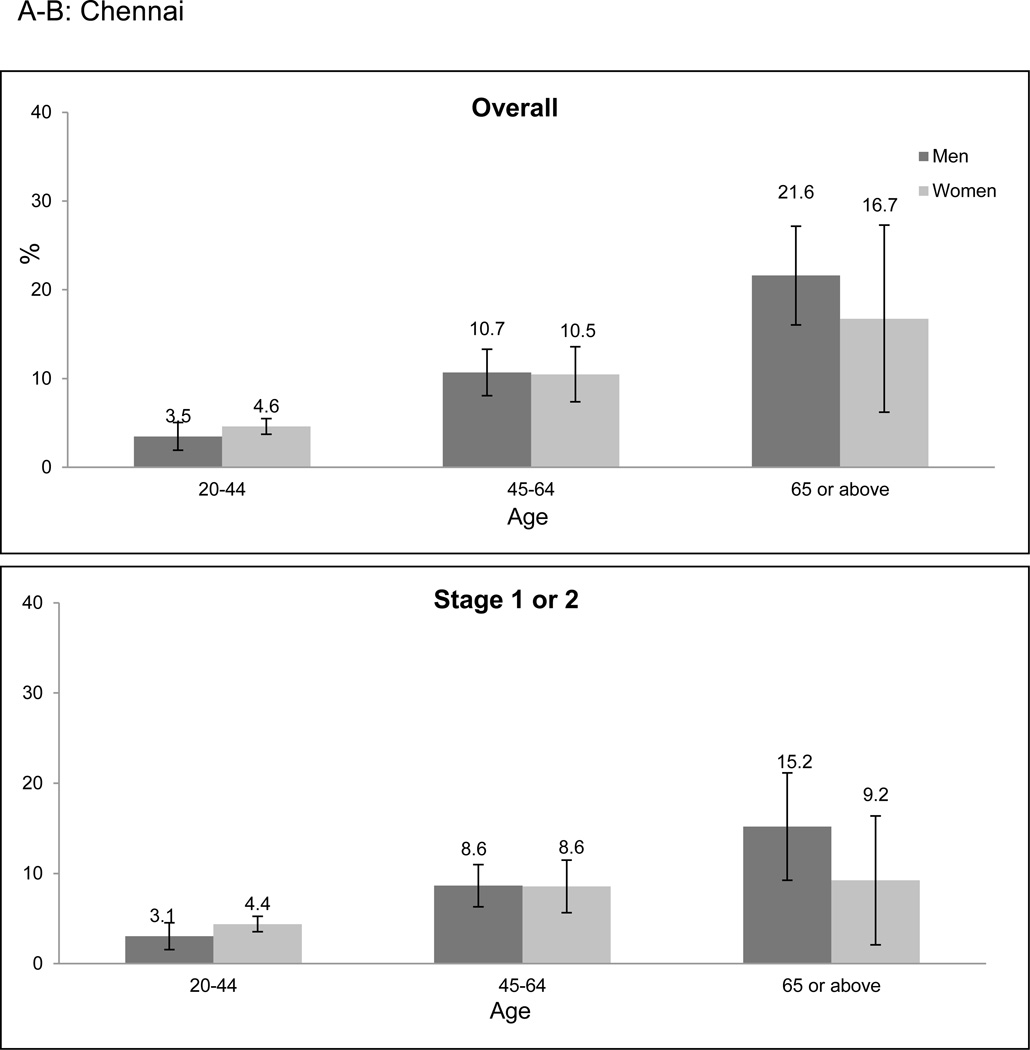
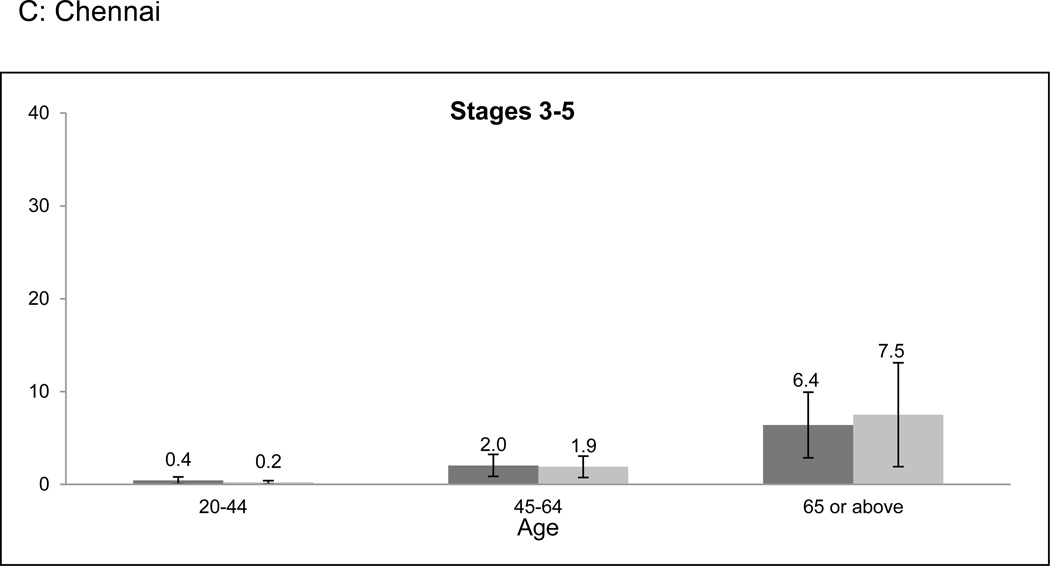
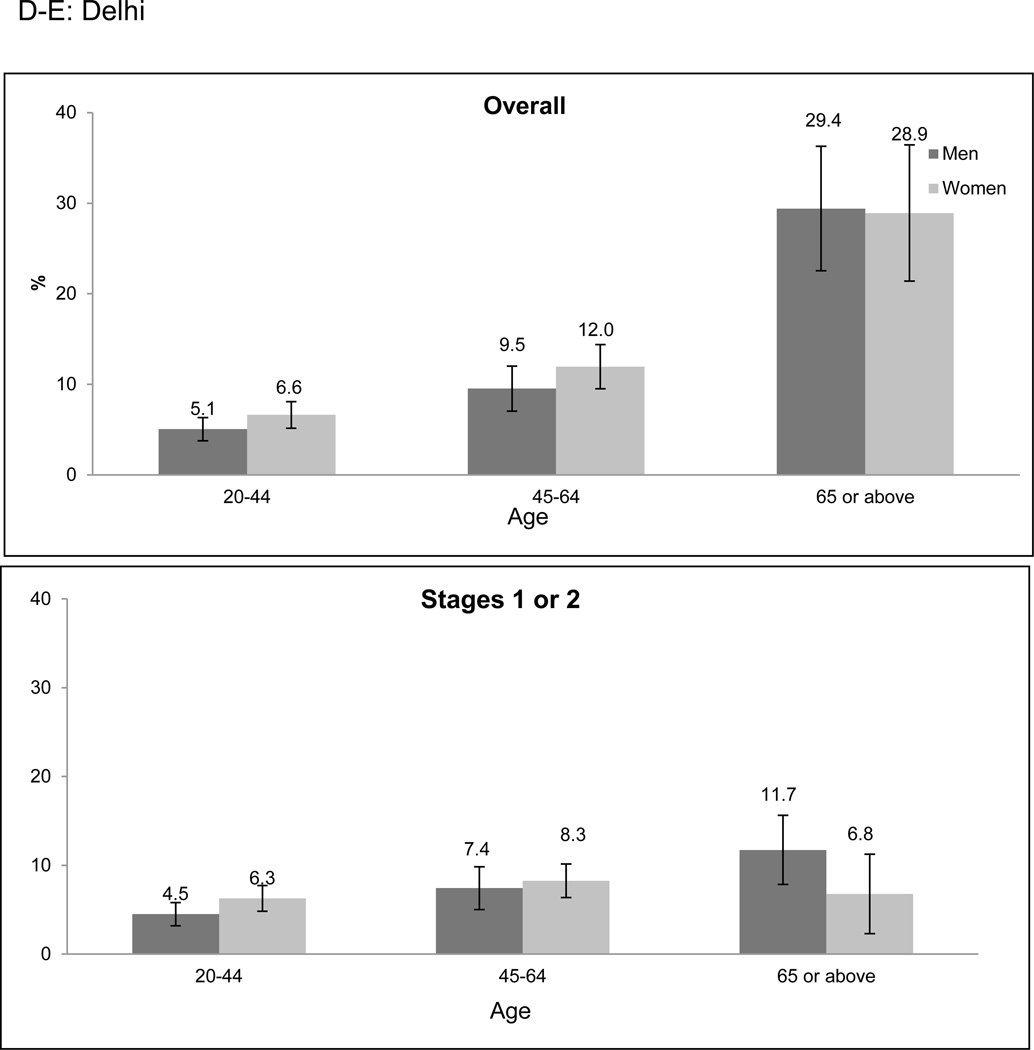
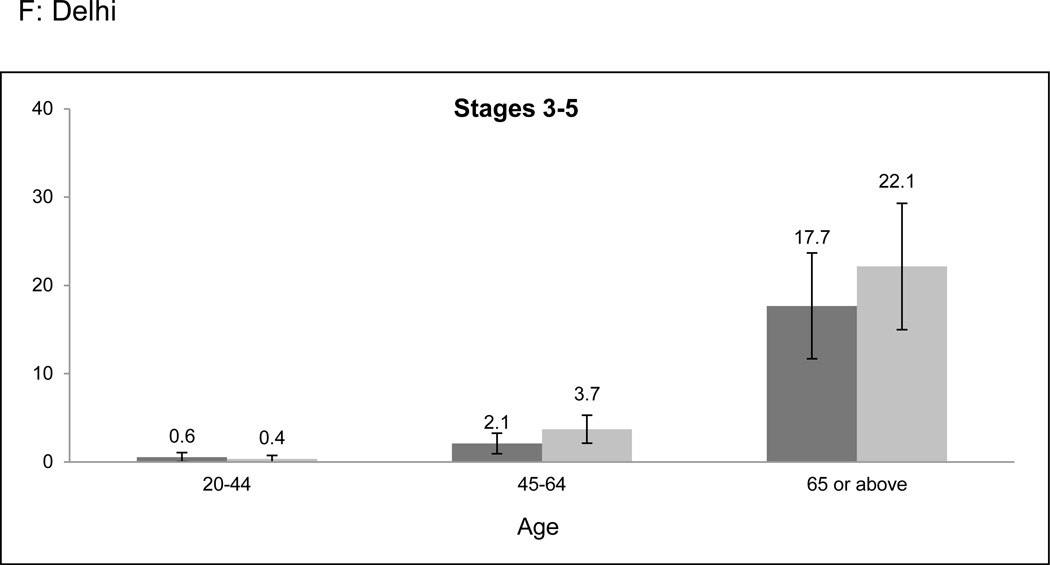
Overall prevalence of CKD was higher among older age categories in both cities (Figure 1a-f). However, the age-related prevalence difference was more pronounced in Stages 3 to 5 CKD than in Stage 1 or 2 CKD (prevalence difference 11.9% [95% CI: 8.8–15.0%] versus 5.4% [95% CI: 2.4–8.4%] when comparing the 20–64 and ≥ 65 years age groups). Only 2.0% of participants identified to have CKD had self-reported a history of kidney disease.
Figure 1. CKD prevalence according to age categories and stage of CKD.
CKD prevalence in the CARRS study according to age categories and stage. a-c represent Chennai; d-f represent Delhi. Error bars represent 95% confidence intervals. Stage 1 or 2 CKD identifies patients with albuminuria (≥ 30 mg/g) and eGFR ≥ 60 ml/min/1.73m2; Stage 3 to 5 CKD identifies patients with eGFR < 60 ml/min/1.73m2. Abbreviations: CARRS-Center for Cardiometabolic Risk Reduction in South Asia; CKD-Chronic kidney disease; eGFR-estimated glomerular filtration rate.
In a sensitivity analysis, the combined cystatin C and creatinine-based formula for estimated glomerular filtration (eGFR) yielded 182 participants with CKD as having eGFR < 60 ml/min/1.73m2, compared with 187 participants when using the CKD-Epidemiology Collaboration Equation (CKD-EPI) creatinine-based formula (14).
CKD and diabetes mellitus
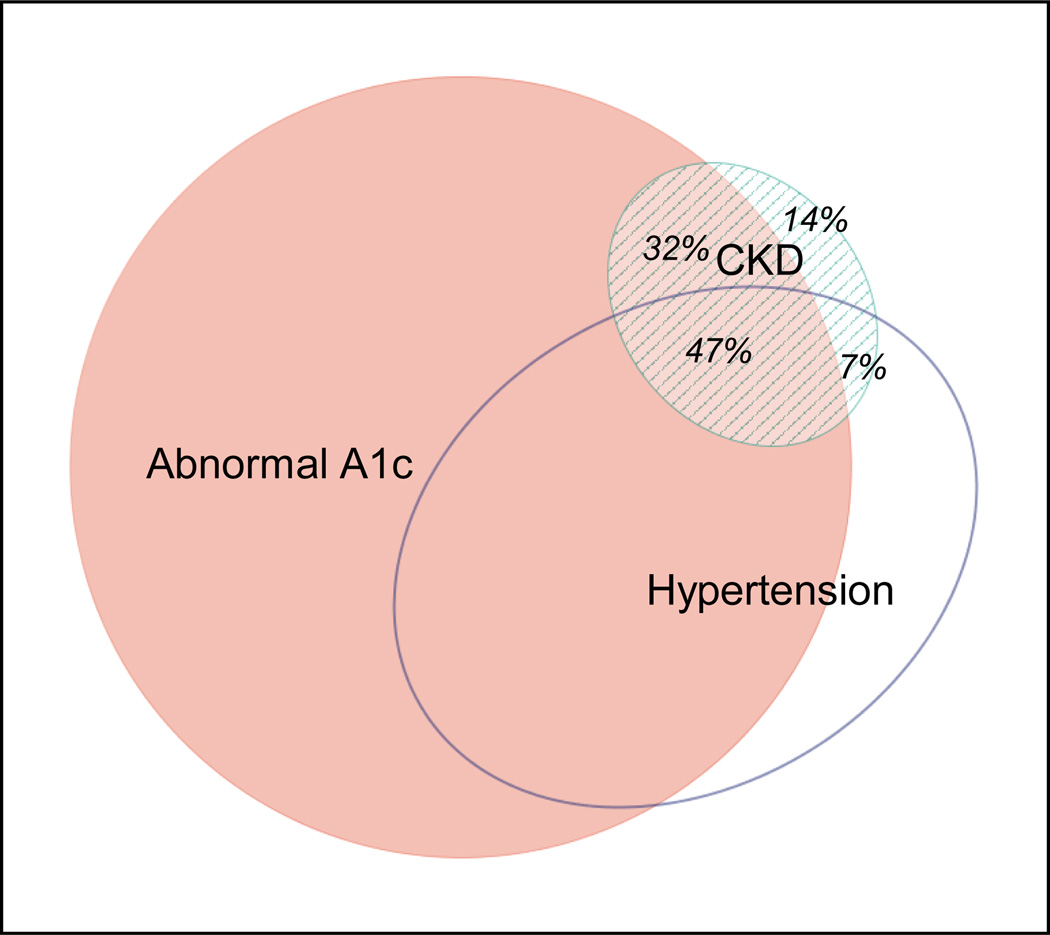
Chronic kidney disease prevalence among participants with diabetes mellitus was 15.4% (95% CI: 13.5 to 17.4%), substantially higher than that of participants without diabetes (prevalence difference: 10.5% [95% CI: 8.4 to 12.6%]). Prevalence was also higher among participants with study-diagnosed diabetes mellitus than among participants without diabetes (prevalence difference: 6.9% [95% CI: 4.6 to 9.2%]). The prevalence difference between diabetes and non-diabetes was of similar magnitude whether diabetes was defined using fasting glucose or HbA1c criteria. Supplemental Figure B provides prevalence data according to whole blood glycated hemoglobin (HbA1c) and fasting glucose categories after stratification by city and sex. Only 14% of participants with CKD did not have an accompanying abnormal A1c (≥ 5.7) and/or hypertension (Figure 2).
Figure 2.
Confluence of abnormally high A1c, hypertension, and CKD in the CARRS study. Eighty-six percent of participants with CKD had either abnormal A1c (≥ 5.7) and/or hypertension. Abbreviations: CKD-Chronic kidney disease; CARRS-Center for Cardiometabolic Risk Reduction in South Asia.
We also found the prevalence of CKD to be modestly higher among participants with obesity by body mass index (BMI) criteria (9.6% [95% CI: 7.8 to 11.4%]) compared with those in the normal BMI category (prevalence difference: 3.0% [95% CI: 1.0–5.1%]). Prevalence differences of similar magnitudes—between 3.8 to 4.8%—were observed among participants with abnormal waist-to-hip ratio, abnormal waist-circumference, and abnormal waist-to-height ratio when compared with participants in the normal category for each measure. Supplemental Figure C provides prevalence data according to several obesity indices after stratification by city and sex. Sensitivity analyses incorporating multiple imputation yielded similar prevalence data.
CKD and association with cardiovascular risk scores
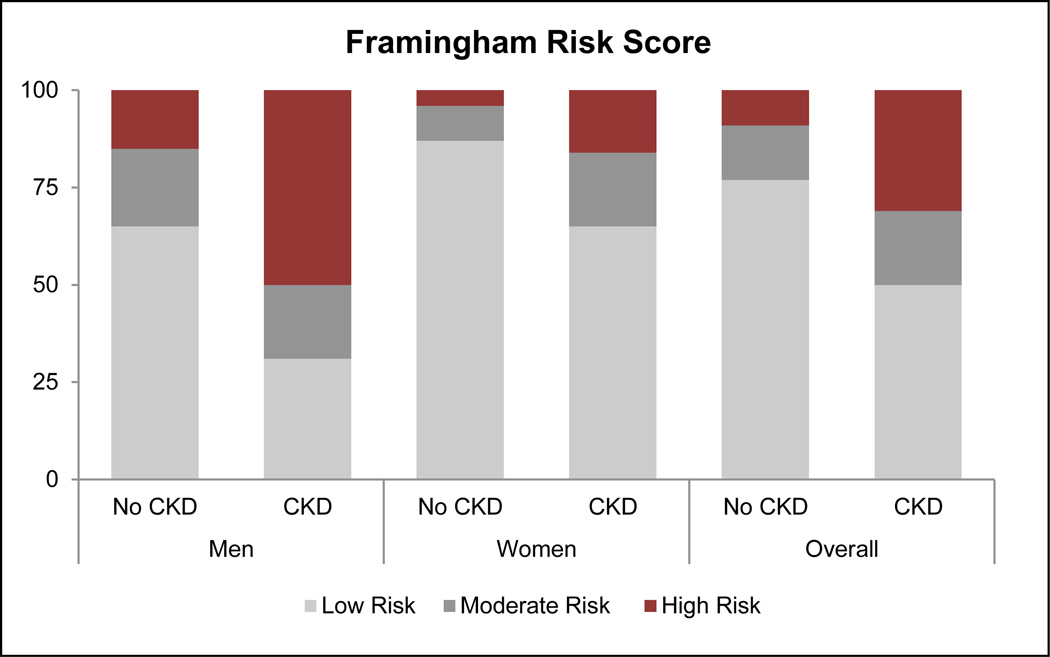
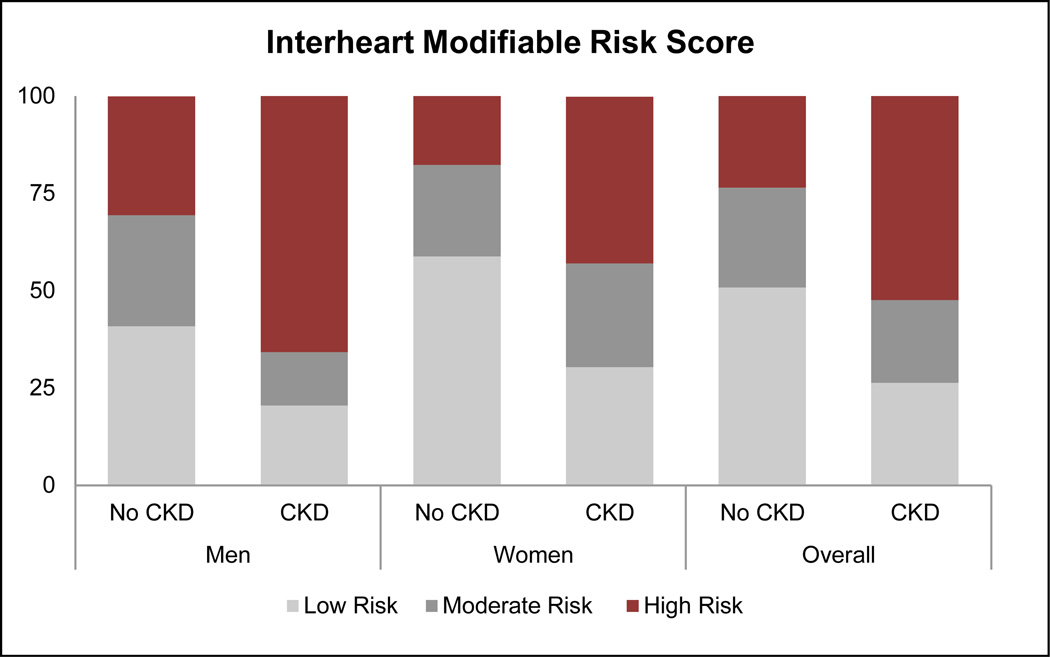
Based on KDIGO criteria, 6.0%, 1.0%, and 0.5% of CARRS participants were at moderate, high, or very high risk, respectively, for experiencing adverse outcomes associated with CKD (Table 3). Thus, 20% of participants with CKD were at high or very high risk of an adverse outcome. The FRS and IHMRS placed a greater proportion of patients with CKD in the high-risk category, when compared with participants without CKD (Figure 3). Among all participants classified as being at moderate-to-high risk for a myocardial infarction using the IHRMS, participants with CKD had a higher mean IHMRS (12.8% [95% CI 12.3 to 13.3%]) than participants without CKD (10.4% [95% 10.2 to 10.6%]), presumably translating to a 30% higher odds of a myocardial infarction over a 3-year period.
Table 3.
Distribution of CARRS participants according to KDIGO CKD classification
| eGFR categories (ml/min/1.73m2) | Albuminuria categories | ||||
|---|---|---|---|---|---|
| A1 (%) | A2 (%) | A3 (%) | |||
| G1 | Normal or high | ≥ 90 | 82.02 | 4.41 | 0.39 |
| G2 | Mildly decreased | 60–89 | 10.44 | 0.98 | 0.15 |
| G3a | Mildly to moderately decreased | 45–59 | 0.64 | 0.20 | 0.11 |
| G3b | Moderately to severely decreased | 30–44 | 0.23 | 0.13 | 0.07 |
| G4 | Severly decreased | 15–29 | 0.01 | 0.04 | 0.03 |
| G5 | Kidney failure | <15 | 0.07 | 0.02 | 0.04 |
Numbers in the boxes are percent of the CARRS analytic group. Albuminuria categories correspond to < 30 mg/g, 30–300mg/g, ≥ 300 mg/g. The colors in the boxes represent a pooling of the risks for 5 CKD related outcomes: all-cause mortality, cardiovascular mortality, acute kidney injury, progressive CKD, and progression to ESRD. Green-no or minimal risk; Yellow-moderate risk; Orange-high risk; Red-very high risk. The KDIGO recommends that participants in the moderate risk category visit a physician once, in the high risk category 2 times, and in the very high risk category 3–4 times per year to monitor CKD progression; pariticipants in the A3 or G4 and G5 should see a nephrologist. Adapted from ref 29. Abbreviations: CARRS-Center for Cardiometabolic Risk Reduction in South Asia; KDIGO-Kidney Disease Improving Global Outcomes; CKD-Chronic kidney disease; eGFR-estimated glomerular filtration rate.
Figure 3.
Distribution of Framingham and Interheart Modifiable Risk Scores according to CKD status. Using the FRS, 30.8% (95% CI: 25.9 to 35.8%) of participants with CKD were placed in the high-risk category (>20% likelihood) for experiencing a cardiovascular event in the next 10 years, with a prevalence difference of 21.8% (95% CI: 17.3 to 26.3%) from the participants without CKD. Using the Interheart Modifiable Risk Score, 49.2% (95% CI: 44.5 to 53.8%) of participants were in the high-risk category (> 5 fold increase in odds of myocardial infarction over the next 3 years), with a prevalence difference of 26.3% (95% CI: 21.9 to 30.6%) from participants without CKD.
Discussion
In this population-based study of two major cities in North and South India, we found that CKD as broadly defined is evident in 8.7% of the adult population. Unlike in high-income countries where stage 3 CKD with eGFR, between 30 and 59 ml/min/1.73m2 predominates, we estimate that albuminuria with normal or near normal eGFR was most common in India. Concordantly, a majority of participants with CKD had impaired glucose tolerance as reflected by abnormally high HbA1c measurements. One in five participants with CKD was in the upper risk categories for adverse events such as mortality or end-stage renal disease. Two commonly used cardiovascular risk scores classified nearly a third to half of participants with CKD as high risk for experiencing a cardiovascular event.
Studies from high income countries such as the U.S.(15), Spain(16), Japan(17), and Norway(18) place the prevalence of CKD generally between 10 and 13% of the adult population. Prevalence studies from low- and middle-income countries are sparse, though more data are being generated as management of non-communicable disease gains higher priority. Variability in the definition of CKD, serum creatinine assays, and ascertainment of proteinuria or albuminuria makes direct comparison of prevalence estimates difficult. However, in order to place our results in context, we compared our data to the most recent U.S. National Health and Nutrition Examination Survey (NHANES) data on prevalence of CKD (defined as CKD-EPI eGFR < 60 ml/min/1.73m2 or albumin-to-creatinine ratio ≥ 30 mg/g on single sample testing)(5) and data from China (defined as Modification of Diet in Renal Disease Study [MDRD] Equation eGFR < 60 ml/min/1.73m2 or albumin to creatinine ratio ≥ 30 mg/g or urine albumin concentration > 20 mg/L on single sample testing) (19). Age-standardized to the World Bank Population structure for 2010 (20), the prevalence of CKD in the U.S. is 11.9% and in China is 9.7%, compared with 8.7% in our study. Thus, the prevalence of CKD in our study is likely close to that of China—particularly since we used a more specific equation to estimate GFR—but slightly lower than that of the U.S.
Most strikingly, we found stage 1 or 2 CKD (i.e., albuminuria alone) predominates: 80% of participants with CKD had albuminuria alone. In a study of a nationally representative sample of 47,204 adults 18 years or older in China, 84% of participants with CKD had stage 1 or 2 CKD(19). While there has been considerable controversy regarding the clinical significance of isolated reduction of eGFR between 45 and 59 ml/min/1.73m2—with some experts have arguing that a majority of such persons have physiologic age-related reductions in solute clearance (21)—albuminuria has been associated with a linear and sizable increase in risk for all-cause mortality and cardiovascular events, starting at urine albumin-to-creatinine ratios above 10 mg/g (4). Risk for end-stage renal disease is 4- to 11 fold higher among persons with albuminuria, compared with persons without albuminuria and eGFR above 60 mL/min/1.73m2 4).
A vast majority of participants with CKD in our study had diabetes mellitus or pre-diabetes. Both conditions are strong risk factors for albuminuria in particular (22). Over half of participants with CKD also had hypertension, potentially further increasing their risk for CKD progression (23). Not surprisingly, given the confluence of these three cardiovascular risk factors—i.e., albuminuria, diabetes, and hypertension—in participants with CKD, risk scores predicting likelihood of a myocardial infarction or cardiovascular event placed a much greater proportion of participants with CKD in the “highest risk” categories compared with participants without CKD. Their risk of other adverse events related to CKD appeared to be on par with persons with CKD in the U.S. (24).
Of note, the higher prevalence of early, rather than moderate to advanced stage CKD presents a potential opportunity for intervention. Observational data in high-income countries make it clear that albuminuria can regress. In follow-up from the Diabetes Complications and Control Trial (DCCT), 40% of participants with persistent micro-albuminuria experienced regression at 10 years(25). Modifiable factors associated with regression included more intensive glycemic and blood pressure control. Randomized control trials evaluating the use of renin-angiotensin-aldosterone system blockers to treat albuminuria in patients with diabetes mellitus (26) and/or hypertension (23) have shown a decrease in rates of progression of kidney disease. Incorporating treatment of hypertension, hyperglycemia, and hyperlipidemia in a step-wise, intensive approach led to a 50% reduction in development of overt nephropathy, cardiovascular disease, and mortality in persons with type 2 diabetes mellitus and albuminuria (27).
In our study, prevalence of CKD was higher than the general population in participants with “study-diagnosed” diabetes—confirming the findings of an earlier report from Chennai (28). This evidence of substantial end-organ effects of diabetes mellitus even among patients without any awareness of their condition highlights the urgency of an integrated non-communicable disease screening program in low- or middle-income countries where routine primary care screening is unavailable.
In addition to the need for primary care screening, we can project that need for specialist care will rise substantially. Based on the recent guidelines from the KDIGO work group—guidelines which aim to more systematically incorporate markers of prognosis, and streamline referral and monitoring—about 20% of CARRS participants with CKD (i.e., those in the high or very high risk categories) would require at least two physician visits annually (11). Thirteen percent require referral to a nephrologist. Extrapolating to the adult population of Delhi and Chennai—which are large metropolitan areas but nonetheless only represent 2% of the total adult Indian population—more than 170,000 people require nephrology care in these cities alone. In 2009, there were 950 practicing nephrologists in all of India (29). Similarly, if we extrapolate using the 95% confidence intervals around the estimate of prevalence of CKD stage V (i.e., eGFR below 15 min/ml/1.73m2) at which point dialysis or transplant therapy often becomes necessary, anywhere from 7,400 to 40,400 adults living in Delhi and Chennai have advanced CKD. In the entire country of India, only about 20,000 people are undergoing maintenance dialysis (30). There is likely a large gap between persons with end-stage renal disease and those receiving renal replacement therapy, with over 90% likely dying without ever accessing therapy.
One major limitation of our analysis is that we did not re-examine participants’ urine or serum so as to exclude persons with transient albuminuria or reduction in eGFR. However, we compared our results to studies with similar “single-sample” estimation of CKD in the U.S. and China. We did not perform the survey in a rural site, where the prevalence of CKD may be lower, in concordance with lower prevalence of diabetes mellitus. The equation we used to calculate eGFR—the CKD-EPI equation—was developed in the U.S. without Asian representation, so its sensitivity and specificity in this population is largely unknown. Using an Asian-specific coefficient did not improve its performance in a multi-ethnic Asian cohort (31). We used the FRS, also developed in a U.S. population, to estimate cardiovascular risk but did not have comorbidity data to exclude patients with peripheral vascular disease or heart failure from the risk calculation. More importantly, no prospective studies have validated this risk score in India, although its performance is felt to be similar to that of a locally-calibrated version (32). Results from the IHRMS, which was derived from a multi-country population including India, are confirmatory.
Our study has several strengths. We used a standard definition of CKD incorporating albuminuria, and obtained a representative sample from cities in North and South India. We obtained detailed data on anthropometric measures of body size and laboratory data on diabetes mellitus. We were able to demonstrate that diabetes mellitus or pre-diabetes are common among persons with CKD—implying a high risk for progression. Because we had collected data on tobacco use, lipids, and blood pressure, we were also able to estimate risk for cardiovascular events.
In conclusion, one in 12 persons in two large cities in India have CKD, and the confluence of albuminuria, diabetes, and hypertension confers a worryingly high risk of cardiovascular disease in a population already experiencing one of the highest cardiovascular disease rates worldwide. At the same time, this is a sub-group of patients with CKD in whom multi-pronged intervention has been definitively shown to improve outcomes. Translating available treatment into action in India and other countries in South Asia will require concerted public health attention.
Methods
The CARRS surveillance study is a study of cardiometabolic diseases and associated risk factors, representative of three major cities of South Asia—namely, Chennai and Delhi, India, and Karachi, Pakistan. We restricted this analysis to Delhi and Chennai as the laboratory in Karachi used different laboratory kits and equipment for serum and urine creatinine assays. The CARRS study used a multistage cluster sampling technique. The sampling frame for Chennai and Delhi was the total number of wards in each municipal corporation, excluding areas that were purely commercial or rural. From each city, we sequentially and randomly sampled wards, census enumeration blocks, and households, as described in detail previously (33). We recruited one eligible man and woman (≥ 20 years of age) pair from each household using the Kish method. We excluded individuals who were pregnant or bed-ridden (and therefore could not perform anthropometry).
Overall, we recruited 5365 participants from Delhi and 6906 participants in Chennai (response rate: 95%) during the baseline survey conducted between October 2010 and December 2011. We interviewed participants in their local languages at their households, and then invited them for standardized clinical examinations and fasting blood sample collection in local camps. If a participant failed to come to these camps, we performed a third home visit (response rate for biospecimens: 84%).
Of the 12,271 participants from Delhi and Chennai, 9797 (80%) who had complete data on serum creatinine and albuminuria comprise the analytic group. In general this group was representative of all participants from Delhi and Chennai, although there were proportionally fewer men (44% in the analytic group versus 48% overall) and women were slightly younger (mean age 40.4 years in analytic group versus 41.8 years overall) (Supplemental Table A).
The study received approval for human subjects’ research from the Ethics Committees of the Public Health Foundation of India and All India Institute of Medical Sciences (Delhi), Madras Diabetes Research Foundation (Chennai), and Emory University (Atlanta).
Demographics, anthropometry, and blood pressure
We obtained data on age, sex, years of schooling, education, income, employment status, and tobacco use using a standardized questionnaire. To characterize household wealth, we used principal components analysis to construct a cumulative asset index based on weighted scores for ownership of different household assets, and divided asset scores into tertiles representing low (score ≤7), middle (8–26), and high (≥27) assets owned. We derived the weighted score from the wealth index used by the National Family Health Survey (34).
Using protocols from the NHANES, we obtained weight, height, waist circumference, and hip circumference. We used standard categories for BMI (in kg/m2) (35), waist circumference (36), waist-to-height ratio (37) and waist-to-hip ratio (38). Trained study staff measured blood pressure twice after five minutes in a seated position using an electronic sphygmomanometer (Omron Dailan Co., Ltd, Dalian, Liaoning, China), obtaining a third measurement if the difference between the first two systolic or diastolic measurements was more than 10 mmHg and 5 mmHg, respectively. We used the mean of the first two measurements, or the second and third measurements if a third measurement was obtained. We defined a participant as having hypertension if mean blood pressure was ≥ 140 mmHg systolic or ≥ 90 mmHg diastolic(39) or the participant self-reported hypertension and was on medications. We defined a participant as diabetes if whole blood glycated hemoglobin (HbA1c) was ≥ 6.5%(40) or the participant self-reported diabetes and was on medications.
Laboratory measures
Accredited site laboratories processed participants’ fasting blood and urine samples. These laboratories participated in the External Quality Assurance program of Randox International Quality Assessment Scheme (RIQAS). We measured venous fasting plasma glucose using hexokinase/kinetic methods and HbA1c using high performance liquid chromatography which is standardized to the National Glycohemoglobin Standardization Program. We used the immunoturbidimetric assay to measure urine albumin, and the kinetic Jaffe method with IDMS traceable assays to measure urine and serum creatinine (Roche Diagnostics GmbH, Manheim, Germany).
With the 2012 KDIGO CKD guidelines as a reference (11), we defined a participant as having CKD if he or she had albuminuria (albumin-to-creatinine ratio ≥ 30 mg/g) or eGFR < 60 ml/min/1.73m2. Stage 1–2 CKD is defined as albuminuria with eGFR between ≥ 90 or 60 to < 90 ml/min/1.73m2 respectively; Stage 3, 4, and 5 CKD is defined as eGFR between 30 to < 60, 15 to < 30, and < 15 ml/min/1.73m2 respectively. We used the CKD-EPI equation to estimate GFR (41).
In a sensitivity analysis of the prevalence estimate, we performed cystatin C measurements (using the particle enhanced immunoturbidimetric assay from Roche Diagnostics) among participants labeled as having CKD. We then used the combined creatinine and cystatin C eGFR equation to estimate eGFR in this subgroup (42).
Statistical analyses
We present continuous data as mean (± standard deviation) and categorical data as proportions. We present CKD prevalence estimates after adjusting for survey sampling technique—i.e., the probability for selection at the individual level—and survey non-response at both the household and individual level. Using sex-specific age distribution of Chennai and Delhi from the 2011 census, we further post-stratified our sampling weights. To allow for comparison to studies from the U.S. and China, we also present a CKD prevalence estimate age-standardized to the World Bank 2010 World population structure (20). We stratified our prevalence estimates by city, sex, age categories, and diabetes status. We compared estimates using prevalence differences and 95% confidence intervals using proc survey procedures in SAS which accounted for sampling probability and non-response. Finally we examined prevalence estimates of CKD according to BMI, waist circumference, waist-to-hip ratio, and waist-to-height ratio categories. Since missing values of waist and height exceeded 10%, we performed a sensitivity analysis employing multiple imputation (using the chained equations method to generate 25 datasets for each obesity measure). To predict the risk of adverse outcomes related to CKD, we describe the distribution of the surveyed population according to the 2012 KDIGO classification of CKD (11). Further, to evaluate the anticipated future burden of cardiovascular disease in participants with and without CKD, we calculated a sex-stratified Framingham Risk Score (FRS), which determines the ten-year likelihood of a cardiovascular event (coronary death, myocardial infarction, stroke, peripheral arterial disease or heart failure) among participants without self-reported heart disease or stroke (12). We entered participants’ age, sex, smoking status, systolic blood pressure, diabetes status, and cholesterol (total and HDL) into the regression equation provided by D'Agostino et al (12). We then categorized participants as being at low (<10%), moderate (10–20%), or high (>20%) risk over a ten-year period, and compared these proportions in participants with and without CKD. We performed a similar procedure for the Interheart Modifiable Risk Score (IHMRS) which uses participants’ age, exposure to second-hand smoke, LDL, HDL, and smoking, diabetes, and hypertension status to predict the relative odds of a myocardial infarction (13, 43). Each one point increase in the IHMRS correlates with a 12% increase in odds of a myocardial infarction over the next 3 year period. We conducted our analyses using SAS version 9.3 (Cary, NC, USA).
Supplementary Material
Acknowledgements
The CARRS study has been funded with Federal funds from the National Heart, Lung, and Blood Institute, National Institutes of Health, under Contract No. HHSN2682009900026C. Dr. Anand was supported by the National Institute of Health Research Training Grant R25 TW009338 funded by the Fogarty International Center/Global Health Equity Scholarship. Dr. Chertow was supported by K24 DK 085446. Dr. Binukumar was supported by grant number 1 D43 HD065249 from the Fogarty International Center and the Eunice Kennedy Shriver National Institute Of Child Health & Human Development at the National Institutes of Health.
Footnotes
Disclosures/Conflict of Interest
The authors have no conflicts of interest to declare.
References
- 1.Prentice AM. The emerging epidemic of obesity in developing countries. International journal of epidemiology. 2006;35(1):93–99. doi: 10.1093/ije/dyi272. [DOI] [PubMed] [Google Scholar]
- 2.Hossain P, Kawar B, El Nahas M. Obesity and diabetes in the developing world--a growing challenge. The New England journal of medicine. 2007;356(3):213–215. doi: 10.1056/NEJMp068177. [DOI] [PubMed] [Google Scholar]
- 3.Barsoum RS. Chronic kidney disease in the developing world. The New England journal of medicine. 2006;354(10):997–999. doi: 10.1056/NEJMp058318. [DOI] [PubMed] [Google Scholar]
- 4.Matsushita K, van der Velde M, Astor BC, Woodward M, Levey AS, et al. Chronic Kidney Disease Prognosis C. Association of estimated glomerular filtration rate and albuminuria with all-cause and cardiovascular mortality in general population cohorts: a collaborative meta-analysis. Lancet. 2010;375(9731):2073–2081. doi: 10.1016/S0140-6736(10)60674-5. [DOI] [PMC free article] [PubMed] [Google Scholar]
- 5.USRDS 2013: Atlas of End-Stage Renal Disease [Internet] Bethesda: National Institutes of Health, National Institute of Diabetes and Digestive and Kidney Diseases; 2013. [cited January 7 2013]. [Google Scholar]
- 6.Ramachandran A, Snehalatha C, Kapur A, Vijay V, Mohan V, Das AK, et al. High prevalence of diabetes and impaired glucose tolerance in India: National Urban Diabetes Survey. Diabetologia. 2001;44(9):1094–1101. doi: 10.1007/s001250100627. [DOI] [PubMed] [Google Scholar]
- 7.Yusuf S, Reddy S, Ounpuu S, Anand S. Global burden of cardiovascular diseases: Part II: variations in cardiovascular disease by specific ethnic groups and geographic regions and prevention strategies. Circulation. 2001;104(23):2855–2864. doi: 10.1161/hc4701.099488. [DOI] [PubMed] [Google Scholar]
- 8.Agarwal SK, Dash SC, Irshad M, Raju S, Singh R, Pandey RM. Prevalence of chronic renal failure in adults in Delhi, India. Nephrology, dialysis, transplantation : official publication of the European Dialysis and Transplant Association - European Renal Association. 2005;20(8):1638–1642. doi: 10.1093/ndt/gfh855. [DOI] [PubMed] [Google Scholar]
- 9.Singh AK, Farag YM, Mittal BV, Subramanian KK, Reddy SR, Acharya VN, et al. Epidemiology and risk factors of chronic kidney disease in India - results from the SEEK (Screening and Early Evaluation of Kidney Disease) study. BMC nephrology. 2013;14:114. doi: 10.1186/1471-2369-14-114. [DOI] [PMC free article] [PubMed] [Google Scholar]
- 10.Singh NP, Ingle GK, Saini VK, Jami A, Beniwal P, Lal M, et al. Prevalence of low glomerular filtration rate, proteinuria and associated risk factors in North India using Cockcroft-Gault and Modification of Diet in Renal Disease equation: an observational, cross-sectional study. BMC nephrology. 2009;10:4. doi: 10.1186/1471-2369-10-4. [DOI] [PMC free article] [PubMed] [Google Scholar]
- 11.Kidney Disease: Improving Global Outcomes Work Group T. KDIGO 2012 Clinical Practice Guideline for the Evaluation and Management of Chronic Kidney Disease. Kidney international Supplement [Internet] 2012;2013(3):1–150. [Google Scholar]
- 12.D'Agostino RB, Sr, Vasan RS, Pencina MJ, Wolf PA, Cobain M, Massaro JM, et al. General cardiovascular risk profile for use in primary care: the Framingham Heart Study. Circulation. 2008;117(6):743–753. doi: 10.1161/CIRCULATIONAHA.107.699579. [DOI] [PubMed] [Google Scholar]
- 13.McGorrian C, Yusuf S, Islam S, Jung H, Rangarajan S, Avezum A, et al. Estimating modifiable coronary heart disease risk in multiple regions of the world: the INTERHEART Modifiable Risk Score. European heart journal. 2011;32(5):581–589. doi: 10.1093/eurheartj/ehq448. [DOI] [PubMed] [Google Scholar]
- 14.Inker LA, Schmid CH, Tighiouart H, Eckfeldt JH, Feldman HI, Greene T, et al. Estimating glomerular filtration rate from serum creatinine and cystatin C. The New England journal of medicine. 2012;367(1):20–29. doi: 10.1056/NEJMoa1114248. [DOI] [PMC free article] [PubMed] [Google Scholar]
- 15.Coresh J, Selvin E, Stevens LA, Manzi J, Kusek JW, Eggers P, et al. Prevalence of chronic kidney disease in the United States. JAMA : the journal of the American Medical Association. 2007;298(17):2038–2047. doi: 10.1001/jama.298.17.2038. [DOI] [PubMed] [Google Scholar]
- 16.Otero A, de Francisco A, Gayoso P, Garcia F, Group ES. Prevalence of chronic renal disease in Spain: results of the EPIRCE study. Nefrologia : publicacion oficial de la Sociedad Espanola Nefrologia. 2010;30(1):78–86. doi: 10.3265/Nefrologia.pre2009.Dic.5732. [DOI] [PubMed] [Google Scholar]
- 17.Imai E, Horio M, Watanabe T, Iseki K, Yamagata K, Hara S, et al. Prevalence of chronic kidney disease in the Japanese general population. Clinical and experimental nephrology. 2009;13(6):621–630. doi: 10.1007/s10157-009-0199-x. [DOI] [PubMed] [Google Scholar]
- 18.Hallan SI, Coresh J, Astor BC, Asberg A, Powe NR, Romundstad S, et al. International comparison of the relationship of chronic kidney disease prevalence and ESRD risk. Journal of the American Society of Nephrology : JASN. 2006;17(8):2275–2284. doi: 10.1681/ASN.2005121273. [DOI] [PubMed] [Google Scholar]
- 19.Zhang L, Wang F, Wang L, Wang W, Liu B, Liu J, et al. Prevalence of chronic kidney disease in China: a cross-sectional survey. Lancet. 2012;379(9818):815–822. doi: 10.1016/S0140-6736(12)60033-6. [DOI] [PubMed] [Google Scholar]
- 20.World DataBank: Health Nutrition and Population Statistics [Internet] [cited June 2013];The World Bank. 2010
- 21.Glassock RJ, Winearls C. Screening for CKD with eGFR: doubts and dangers. Clinical journal of the American Society of Nephrology : CJASN. 2008;3(5):1563–1568. doi: 10.2215/CJN.00960208. [DOI] [PMC free article] [PubMed] [Google Scholar]
- 22.Nelson RG, Kunzelman CL, Pettitt DJ, Saad MF, Bennett PH, Knowler WC. Albuminuria in type 2 (non-insulin-dependent) diabetes mellitus and impaired glucose tolerance in Pima Indians. Diabetologia. 1989;32(12):870–876. doi: 10.1007/BF00297452. [DOI] [PubMed] [Google Scholar]
- 23.Appel LJ, Wright JT, Jr, Greene T, Agodoa LY, Astor BC, Bakris GL, et al. Intensive blood-pressure control in hypertensive chronic kidney disease. The New England journal of medicine. 2010;363(10):918–929. doi: 10.1056/NEJMoa0910975. [DOI] [PMC free article] [PubMed] [Google Scholar]
- 24.Levey AS, Coresh J. Chronic kidney disease. Lancet. 2012;379(9811):165–180. doi: 10.1016/S0140-6736(11)60178-5. [DOI] [PubMed] [Google Scholar]
- 25.de Boer IH, Rue TC, Cleary PA, Lachin JM, Molitch ME, Steffes MW, et al. Long-term renal outcomes of patients with type 1 diabetes mellitus and microalbuminuria: an analysis of the Diabetes Control and Complications Trial/Epidemiology of Diabetes Interventions and Complications cohort. Archives of internal medicine. 2011;171(5):412–420. doi: 10.1001/archinternmed.2011.16. [DOI] [PMC free article] [PubMed] [Google Scholar]
- 26.Parving HH, Lehnert H, Brochner-Mortensen J, Gomis R, Andersen S, Arner P, et al. The effect of irbesartan on the development of diabetic nephropathy in patients with type 2 diabetes. The New England journal of medicine. 2001;345(12):870–878. doi: 10.1056/NEJMoa011489. [DOI] [PubMed] [Google Scholar]
- 27.Gaede P, Lund-Andersen H, Parving HH, Pedersen O. Effect of a multifactorial intervention on mortality in type 2 diabetes. The New England journal of medicine. 2008;358(6):580–591. doi: 10.1056/NEJMoa0706245. [DOI] [PubMed] [Google Scholar]
- 28.Unnikrishnan RI, Rema M, Pradeepa R, Deepa M, Shanthirani CS, Deepa R, et al. Prevalence and risk factors of diabetic nephropathy in an urban South Indian population: the Chennai Urban Rural Epidemiology Study (CURES 45) Diabetes care. 2007;30(8):2019–2024. doi: 10.2337/dc06-2554. [DOI] [PubMed] [Google Scholar]
- 29.Chugh KS. Five decades of Indian nephrology: a personal journey. American journal of kidney diseases : the official journal of the National Kidney Foundation. 2009;54(4):753–763. doi: 10.1053/j.ajkd.2009.06.027. [DOI] [PubMed] [Google Scholar]
- 30.Khanna U. The economics of dialysis in India. Indian journal of nephrology. 2009;19(1):1–4. doi: 10.4103/0971-4065.50671. [DOI] [PMC free article] [PubMed] [Google Scholar]
- 31.Teo BW, Xu H, Wang D, Li J, Sinha AK, Shuter B, et al. GFR estimating equations in a multiethnic Asian population. American journal of kidney diseases : the official journal of the National Kidney Foundation. 2011;58(1):56–63. doi: 10.1053/j.ajkd.2011.02.393. [DOI] [PubMed] [Google Scholar]
- 32.Chow CK, Joshi R, Celermajer DS, Patel A, Neal BC. Recalibration of a Framingham risk equation for a rural population in India. Journal of epidemiology and community health. 2009;63(5):379–385. doi: 10.1136/jech.2008.077057. [DOI] [PubMed] [Google Scholar]
- 33.Nair M, Ali MK, Ajay VS, Shivashankar R, Mohan V, Pradeepa R, et al. CARRS Surveillance study: design and methods to assess burdens from multiple perspectives. BMC Public Health. 2012;12:701. doi: 10.1186/1471-2458-12-701. [DOI] [PMC free article] [PubMed] [Google Scholar]
- 34.National Family Health Survey, India [Internet] [cited March 2014];International Institute for Population Sciences. 2009
- 35.Consultation WHOE. Appropriate body-mass index for Asian populations and its implications for policy and intervention strategies. Lancet. 2004;363(9403):157–163. doi: 10.1016/S0140-6736(03)15268-3. [DOI] [PubMed] [Google Scholar]
- 36.National Cholesterol Education Program Expert Panel on Detection E Treatment of High Blood Cholesterol in A. Third Report of the National Cholesterol Education Program (NCEP) Expert Panel on Detection, Evaluation, and Treatment of High Blood Cholesterol in Adults (Adult Treatment Panel III) final report. Circulation. 2002;106(25):3143–3421. [PubMed] [Google Scholar]
- 37.Browning LM, Hsieh SD, Ashwell M. A systematic review of waist-to-height ratio as a screening tool for the prediction of cardiovascular disease and diabetes, 0.5 could be a suitable global boundary value. Nutrition research reviews. 2010;23(2):247–269. doi: 10.1017/S0954422410000144. [DOI] [PubMed] [Google Scholar]
- 38.World Health Organization T. Waist circumference and waist–hip ratio: Report of a WHO expert consultation. Geneva: World Health Organization, The; 2008. [Google Scholar]
- 39.James PA, Oparil S, Carter BL, Cushman WC, Dennison-Himmelfarb C, Handler J, et al. 2014 evidence-based guideline for the management of high blood pressure in adults: report from the panel members appointed to the Eighth Joint National Committee (JNC 8) JAMA : the journal of the American Medical Association. 2014;311(5):507–520. doi: 10.1001/jama.2013.284427. [DOI] [PubMed] [Google Scholar]
- 40.American Diabetes A. Diagnosis and classification of diabetes mellitus. Diabetes care. 2010;33(Suppl 1):S62–S69. doi: 10.2337/dc10-S062. [DOI] [PMC free article] [PubMed] [Google Scholar]
- 41.Levey AS, Stevens LA, Schmid CH, Zhang YL, Castro AF, 3rd, Feldman HI, et al. A new equation to estimate glomerular filtration rate. Annals of internal medicine. 2009;150(9):604–612. doi: 10.7326/0003-4819-150-9-200905050-00006. [DOI] [PMC free article] [PubMed] [Google Scholar]
- 42.Shlipak MG, Matsushita K, Arnlov J, Inker LA, Katz R, Polkinghorne KR, et al. Cystatin C versus creatinine in determining risk based on kidney function. The New England journal of medicine. 2013;369(10):932–943. doi: 10.1056/NEJMoa1214234. [DOI] [PMC free article] [PubMed] [Google Scholar]
- 43.Yusuf S, Rangarajan S, Teo K, Islam S, Li W, Liu L, et al. Cardiovascular risk and events in 17 low-, middle-, and high-income countries. The New England journal of medicine. 2014;371(9):818–827. doi: 10.1056/NEJMoa1311890. [DOI] [PubMed] [Google Scholar]
Associated Data
This section collects any data citations, data availability statements, or supplementary materials included in this article.


