

Abstract
Objective
Impaired response inhibition is a key executive function deficit of attention-deficit/hyperactivity disorder (ADHD). Still, behavioral response inhibition measures do not consistently differentiate individuals with ADHD from unaffected individuals. We therefore investigated the neural correlates of response inhibition as well as the familial nature of these neural correlates.
Methods
fMRI measurements of neural activation during the stop-signal task along with behavioral measures of response inhibition were obtained in adolescents and young adults with ADHD (N=185), their unaffected siblings (N=111), and healthy controls (N=124).
Results
Stop-signal reaction times were longer in participants with ADHD, but not in their unaffected siblings, while reaction time variability and error rates were higher in both groups than in controls. Neural hypoactivation was observed in frontal-striatal and frontal-parietal networks of participants with ADHD and unaffected siblings compared to controls, whereby activation in inferior frontal and temporal/parietal nodes in unaffected siblings was intermediate between that of participants with ADHD and controls. Furthermore, neural activation in inferior frontal nodes correlated with stop-signal reaction times, and activation in both inferior frontal and temporal/parietal nodes correlated with ADHD severity.
Conclusions
Neural activation alterations in ADHD are more robust than behavioral response inhibition deficits and explain variance in response inhibition and ADHD severity. Although only affected participants with ADHD have deficient response inhibition, hypoactivation in inferior frontal and temporal-parietal nodes in unaffected siblings support the familial nature of the underlying neural process. Hypoactivation in these nodes may be useful as endophenotypes that extend beyond the affected individuals in the family.
Introduction
Response inhibition is assumed to be a key deficit underlying attention-deficit/hyperactivity disorder (ADHD) (1). However, a recent meta-analysis showed only medium effect sizes (g=0.62) for response inhibition deficits in ADHD (2), with large interindividual differences. Indeed, around half of individuals with ADHD have a response inhibition performance overlapping with healthy controls (2). Similar behavioral task outcomes can be due to different neural mechanisms. For example, neural correlates of reversal learning performance differed between participants with severe mood dysregulation and with pediatric bipolar disorder despite similar task performance (3). We therefore postulated that neural measures may be a more robust method than task performance to investigate the nature of response inhibition alterations in individuals with ADHD (4).
Neuroimaging research in healthy subjects has identified a core network of brain regions involved in response inhibition, including a frontal-striatal network (the inferior frontal gyrus, the pre-supplementary motor area, basal ganglia, and suprathalamic nucleus (5; 6)) and a frontal-parietal network (the inferior frontal, superior frontal, and temporal/parietal areas (7–9)). The inferior frontal gyrus, generally linked to salient cue detection (10), is thought to initiate the inhibition process, which is further executed by the pre-supplementary motor area and basal ganglia (11–13). Temporal/parietal and superior frontal nodes are thought to underlie the top-down direction of attentional resources during response inhibition (7; 14). Additionally, anterior cingulate areas are involved in error processing, as indicated by activation following failed response inhibition (15). While attention and error processing are not specific to response inhibition (16), deficits in these processes influence response inhibition performance (e.g. (17)).
Children and adolescents with ADHD, as compared to healthy controls, previously demonstrated hypo-activation in frontal and medial nodes of response inhibition networks (18–24), as well as in frontal-parietal nodes of the attentional networks (25; 26), indicating altered functionality in both inhibition and attentional processes. Literature on adults with ADHD showed inconsistent findings, with both hypoactivation (21; 22; 27) and hyperactivation (28; 29) reported in frontal-striatal and frontal-parietal.
Given these inconsistent previous findings, as well as relatively small sample sizes of earlier studies (4; 26), the first aim of our study was to investigate neural activation patterns underlying response inhibition in a large sample of adolescents and young adults with and without ADHD. Stop-signal task (SST) reaction times were used as behavioral index of response inhibition performance, reaction time variability as measures of attention (16), and error rates as a measure of error processing (15). We expected hypoactivation in the frontal-striatal and frontal-parietal networks during both successful and failed response inhibition in individuals with ADHD (23; 30) and expected the degree of hypoactivation to be associated with ADHD severity. Inhibition related activation in frontal areas was expected to correlate with stop-signal reaction times (5); activation of parietal nodes with reaction time variability (7); and error rates with anterior cingulate activation after failed inhibition (31).
As a second aim, we investigated the suitability of response inhibition as an ADHD endophenotype by comparing neural correlates of response inhibition between adolescents with ADHD, their unaffected siblings, and healthy controls. Endophenotypes are heritable markers more closely related to the genetic underpinnings of a disorder than the disorder itself (32), which may facilitate the search of causal genetic variants of a disorder (33). Assuming neural activation to be causally closer to the genetic factors underlying ADHD than task-outcome measures, we expected unaffected siblings to demonstrate neural hypoactivation in fronto-striatal nodes, intermediate between probands and controls, even in the absence of behavioral deficits (34). Unaffected siblings may further be able to recruit alternative neural mechanisms to compensate for impaired response inhibition, which would show as hyper-activation outside of the response inhibition network, specifically in parietal areas (35–37).
Methods
Participants
Participants were part of NeuroIMAGE (www.neuroimage.nl), the Dutch follow up of the International Multicenter ADHD Genetics (IMAGE) study (38). Three groups were included: participants with ADHD (n=185), their unaffected siblings (n=111), and healthy controls (n=124); for demographics, see Table 1. Participants with ADHD had to have six or more hyperactive/impulsive and/or inattentive symptoms according to DSM-IV criteria; unaffected siblings and unrelated controls had to have less than two symptoms overall, based on a structured psychiatric interview (K-SADS) and Conners questionnaires. Comorbidity with oppositional defiant disorder or conduct disorder was allowed. Among participants with ADHD, 53.5% were currently using stimulant medication. IQ was lower and the proportion of females was smaller in the ADHD group compared to controls. Detailed recruitment and diagnostic information can be found in the main NeuroIMAGE design paper (39); specifics regarding the current sample are available in the Supplementary Information (SI).
Table 1.
Participant characteristics and stop-signal task outcome measures
| ADHD | Siblings | Controls | Wald-χ2 | Cohen’s d | p-value | Between group effects | ||||
|---|---|---|---|---|---|---|---|---|---|---|
| Males | 129 | 48 | 55 | |||||||
| Females | 56 | 63 | 69 | 28.1 | .536 | <.001 | ADHD < Sibs = Controls | |||
|
| ||||||||||
| Mean | SD | Mean | SD | Mean | SD | |||||
|
| ||||||||||
| ADHD Symptomsa | 12.9 | 3.1 | 1.3 | 3.4 | 0.6 | 1.5 | 242.7 | 2.34 | <.001 | ADHD > Sibs = Controls |
| Age (yr) | 17.3 | 3.2 | 17.3 | 4 | 16.5 | 3.3 | 1.6 | .124 | .44 | |
| Estimated IQb | 95.3 | 16.8 | 102.4 | 15.9 | 107.1 | 14.5 | 38.2 | .633 | <.001 | ADHD < Sibs < Controls |
| Education (yr) | 12.82 | 2.14 | 12.82 | 2.22 | 13.52 | 1.91 | 6.387 | .249 | .041 | ADHD = Sibs < Controls |
|
| ||||||||||
| Age range | 8–25 | 8–27 | 9–23 | |||||||
| IQ rangeb | 55–138 | 56–144 | 58–141 | |||||||
|
| ||||||||||
| Mean | SD | Mean | SD | Mean | SD | |||||
|
| ||||||||||
| SSRT (ms)c | 268.1 | 59.4 | 254.1 | 49 | 258.2 | 52.6 | 6.012 | .241 | .046 | ADHD > Sibs = Controls |
| RTV (ms)c | 112 | 38.3 | 93.2 | 36.7 | 82.2 | 30.8 | 30.03 | .555 | <.001 | ADHD > Sibs > Controls |
| Errors (n)c | 6.3 | 7.6 | 4.2 | 5.6 | 3.1 | 3.5 | 13.56 | .365 | <.001 | ADHD > Sibs = Controls |
|
| ||||||||||
| Medication use (%) | 54 | 0 | 0 | 160.64 | 1.571 | <.001 | ADHD > Sibs = Controls | |||
| Comorbid ODDd | 55 | 4 | 0 | 67.68 | .876 | <.001 | ADHD > Sibs = Controls | |||
| Comorbid CDd | 12 | 0 | 0 | 15.62 | .393 | <.001 | ADHD > Sibs = Controls | |||
| Comorbid RDd | 34 | 11 | 11 | 7.33 | .267 | .026 | ADHD > Controls | |||
Note: ADHD = attention deficit/hyperactivity disorder; ODD = oppositional defiant disorder; CD = conduct disorder; RD = Reading disability SSRT = stop-signal reaction time; RTV = reaction time variance; Errors = number of errors on go-trials. Bolded values indicate significant effects.
ADHD diagnosis was based on K-SADS structured psychiatric interviews and Conners’ questionnaires (58).
Estimated IQ was based on the block-design and vocabulary subtests of the Wechsler Intelligence Scale for Children (WISC) or Wechsler Adult Intelligence Scale (WAIS-III) (59).
Task effects for the stop-task derived from generalized estimate equation models, using a significance threshold of p<.05 and correcting for familiality, gender age and IQ.
ODD, CD and RD diagnosis was based on K-SADS structured psychiatric interviews (60).
Stop task acquisition and analysis
The stop-signal task was used to operationalize response inhibition (40). The main outcome measure was the stop-signal reaction time (SSRT). Reaction Time Variability (RTV) and the number of commission and omission errors on go-trials (errors) were other outcome measures (see SI).
Familial relationship between participants with ADHD and their siblings were accounted for using Generalized Estimating Equations models. To test the unique effects of each task outcome measure, we investigated the effects of diagnostic group on SSRT, RTV, and errors in separate models, while correcting for the influence of the other measures. Age, gender, and IQ were added as covariates. Potential confounding effects of medication use or comorbid diagnoses within the probands on the SST measures were tested in separate analyses (see SI).
fMRI group analysis
fMRI data were processed using FSL FEAT (FMRIB’s Software Library, www.fmrib.ox.ac.uk/fsl; fMRI Expert Analysis Tool, version 6.0); information on fMRI acquisition and preprocessing can be found in the SI. For single subject analysis, three first-level contrasts of interests were constructed: (1) successful stop-go and (2) failed stop-go to isolate activation of successful and failed inhibition respectively, using go trial activity as an implicit baseline; and (3) a failed-successful stop contrast to model activation unique to the failed inhibition process.
For the between-group analysis, an F-contrast comparing the three diagnostic groups was subsequently applied to these contrast maps, separately for the successful stop–go, failed stop–go, and failed stop-successful stop contrasts. Age, gender, IQ, and scan site were added as covariates. To ensure robust cluster level statistics, subsequent group level correction for multiple comparisons was performed using thresholds more stringent than FSL standard settings, implementing a z-stat cluster thresholding of 2.6 and a family-wise corrected significance threshold of p<.01 (41).
Post-hoc analysis of between-group differences was done by exporting beta values from all clusters (n=11) that reached significance in the diagnostic group F-test. These were included in separate models, correcting for familial relations between participants. In probands, the relation between ADHD severity and neural activation was investigated by incorporating ADHD symptom count as a predictor in a separate set of analyses (see SI).
Associations between stop-task outcomes and neural activation measures in the clusters showing a group effect were subsequently investigated. We incorporated the exported beta values from significant clusters as dependent variables and added RTV, SSRT, and errors as predictors in the same model. Results of these analyses were assessed using Bonferroni-Holm corrected p-values. Finally, a number of additional sensitivity analyses were run. That is, the probands with ADHD, unaffected siblings, and controls in our study were not a-priori matched on demographic factors. Therefore, the potential confounding effects of several covariates were tested and additional sensitivity analyses were performed to investigate the robustness of the main diagnostic group effects (see SI).
Results
Task Outcome Measures
A main effect of diagnostic group on SSRT (see Table 1) was found, indicating longer SSRTs in participants with ADHD compared to unaffected siblings (B= −15.4, p=.015) and controls (B=−13.8, p=.05). Probands made significantly more errors on the go-trials than unaffected siblings (B=−1.8, p<.013) and controls (B=−2.5, p<.001). SSRT and error rate did not differ between the latter two groups. Regarding RTV, probands performed worse than their unaffected siblings (B=−15.6, p<.001), who performed worse than controls (B=−9.5, p<.021). No influences of age, gender, IQ, medication status, or comorbid diagnoses were found.
fMRI task activation
Activation maps for the successful stop–go, the failed stop–go, and failed stop–successful – stop contrasts across all participants are shown in Figure SI 1. In the successful stop condition we observed relatively higher beta values in the bilateral inferior frontal cortex, as well as in the bilateral insula, right frontal pole and middle frontal gyrus, right thalamus and caudate nucleus, bilateral anterior and posterior cingulate, medial frontal gyrus, bilateral temporal/parietal junction and lateral occipital areas, left hippocampus, and cerebellum. Similar patterns were observed in the failed stop condition, with higher beta-values in left inferior frontal gyrus, insula, and caudate nucleus merged into one cluster. The failed stop condition showed additional activation in the left frontal pole and superior frontal area.
The failed–successful stop condition showed increased betas in the bilateral calcerine occipital cortex, the anterior cingulate, pre-supplementary motor area, and left inferior frontal gyrus (see Table SI 1). Activation maps per diagnostic group as well as difference maps for the go-condition have also been reported in the SI; although control subjects showed relatively higher activation in the medial frontal pole during go-trials, this activation did not overlap with group contrasts of interest, nor did it survive multiple comparison corrections.
Group differences in fMRI task activation
Between group differences in neural activation for the successful stop–go condition were located in the left inferior frontal, superior frontal and anterior cingulate gyrus, left supramarginal gyrus, right postcentral gyrus, and right temporal/parietal junction (see Figure 1). For the failed stop–go condition, between group comparisons showed differences in left inferior and superior frontal, anterior cingulate, left supramarginal, and bilateral temporal/parietal area, as well as left cerebellum and right occipital areas (see Figure 2). An overview of all overall group effects and differences between the three diagnostic groups is shown in Table 2.
Figure 1.
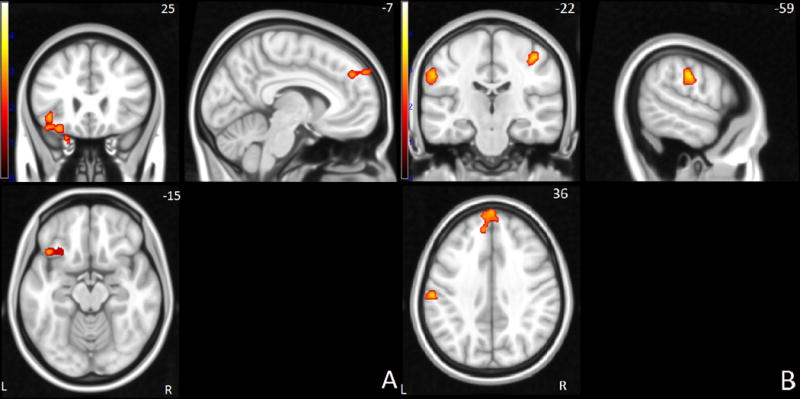
Successful stop > go network: Brain activation differences between controls and siblings or ADHD probands in frontal (A) and parietal areas (B). Yellow hues correspond to higher signal in control subjects. Right side of the image corresponds to the right hemisphere of the brain.
Figure 2.
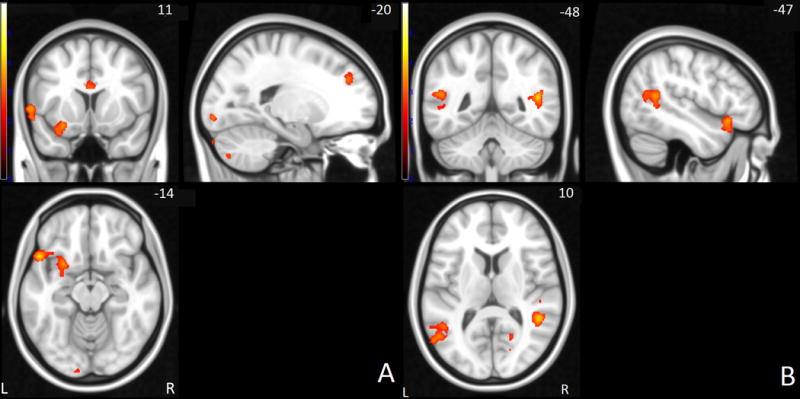
Failed stop > go network: Brain activation differences between controls and siblings or participants with ADHD in frontal (A) and parietal areas (B). Yellow hues correspond to higher signal in control subjects. Right side of the image corresponds to the right hemisphere of the brain.
Table 2.
Brain regions with differential activation between diagnostic groups
| Areaa | side | Mean Ba | SDa | Wald-χ2b | p-valueb | Cohen’s db | peak voxel (MNI) | BA | # voxels | between group effectsb | ||
|---|---|---|---|---|---|---|---|---|---|---|---|---|
|
| ||||||||||||
| Stop-success contrast | x | y | z | |||||||||
| Inferior frontal gyrus | L | 4.91 | 25.46 | 16.34 | <.001 | 0.402 | −38 | 20 | −18 | 44,47 | 371 | Controls = Sibs > ADHD |
| Superior frontal gyrus | L | −2.87 | 37.46 | 16.25 | <.001 | 0.401 | −2 | 60 | 38 | 8 | 245 | Controls = Sibs > ADHD |
| Supramarginal gyrus | L | −7.5 | 31.47 | 9.91 | 0.007 | 0.311 | −58 | −20 | 34 | 2,40 | 189 | Controls > Sibs = ADHD |
| Postcentral gyrus | R | −17.59 | 31.1 | 11.28 | 0.004 | 0.332 | 42 | −24 | 52 | 3,4 | 134 | Controls > Sibs = ADHD |
| Temporal-parietal junction | R | 17.22 | 21.34 | 7.1 | 0.029 | 0.262 | 48 | −42 | 14 | 41 | 95 | Controls > Sibs = ADHD |
|
| ||||||||||||
| Stop-fail contrast | ||||||||||||
|
| ||||||||||||
| Inferior frontal gyrus | L | 14.8 | 23.15 | 35.29 | <.001 | 0.606 | −52 | 18 | −12 | 13,44,47 | 1064 | Controls > Sibs > ADHD |
| Temporal-parietal junction | L | 14.97 | 25.02 | 22.46 | <.001 | 0.475 | −50 | −50 | −12 | 19,22 | 811 | Controls > Sibs > ADHD |
| Temporal-parietal junction | R | 11.81 | 16.12 | 33.5 | <.001 | 0.589 | 48 | −44 | 14 | 13 | 368 | Controls > Sibs > ADHD |
| Superior frontal gyrus | L | 3.34 | 24.51 | 20.55 | <.001 | 0.454 | −18 | 42 | 30 | 9 | 164 | Controls > Sibs = ADHD |
| Anterior cingulate cortex | L/R | 21.64 | 24.59 | 11.24 | 0.004 | 0.332 | −2 | 12 | 22 | 24 | 160 | Controls > Sibs = ADHD |
| Supramarginal gyrus | L | 16.44 | 30.61 | 10.57 | 0.005 | 0.321 | −58 | −24 | 26 | 40 | 151 | Controls = Sibs > ADHD |
Note: ADHD = attention deficit/hyperactivity disorder; BA = Brodmann area.
Activation clusters are derived from the F-contrasts testing differences in task activation as a function of diagnostic group, including gender, IQ, age and scan-site as covariates. Correction for multiple comparisons performed using a cluster threshold of Z > 2.3 and a significance threshold of p < .05 corrected
Between group effects and associated Wald-χ2, p-values and cohen’s d reflect the specific diagnostic group in each region as derived from post-hoc generalized estimating equation analyses, corrected for familial dependency between siblings as well as for covariates age, gender, IQ, and scan site.
# voxels indicates the number of voxels in a cluster
For the successful-stop condition, siblings and probands showed less activation compared to controls in right temporal/parietal, left supramarginal, and right postcentral/supramarginal areas. In the left superior frontal and inferior frontal gyri, probands showed less activation compared to both siblings and controls, while the latter two did not differ (see also SI Figure 2).
In the failed-stop condition, we observed levels of activation for siblings that were in-between the levels observed for probands and controls, in bilateral temporal/parietal areas and the inferior frontal gyrus. In the anterior cingulate and left superior frontal gyri, probands and siblings showed similar levels of hypoactivation compared to controls. In the left supramarginal region, siblings did not differ from controls and showed higher activation compared to probands (see also SI Figure 3).
Additionally, results from post-hoc analyses relating neural activation to ADHD severity in probands (Table 3) indicated significant negative correlations between ADHD symptom count and neural activation in inferior frontal gyrus during both successful and failed stop conditions, as well as in superior frontal and temporal/parietal gyrus during the failed stop condition.
Table 3.
Associations between brain activation and number of behavioral ADHD symptoms in probands
| Area | side | Symptom Count (N) | |||
|---|---|---|---|---|---|
|
| |||||
| Stop-success contrast | Ba | Wald-χ2a | Cohen’s da | p-valuea | |
| Inferior frontal gyrus | L | −.026 | 7.204 | .204 | .007 |
| Superior frontal gyrus | L | .012 | 3.422 | .181 | .064 |
| Supramarginal gyrus | L | .008 | 1.088 | .102 | .297 |
| Postcentral gyrus | R | −.002 | .051 | .022 | .821 |
| Temporal-parietal junction | R | −.02 | 3.329 | .179 | .068 |
|
| |||||
| Stop-fail contrast | |||||
|
| |||||
| Inferior frontal gyrus | L | −.025 | 5.564 | .232 | .018 |
| Temporal-parietal junction | L | −.014 | 2.126 | .143 | .145 |
| Temporal-parietal junction | R | −.027 | 4.142 | .2 | .042 |
| Superior frontal gyrus | L | −.02 | 4.384 | .205 | .036 |
| Anterior cingulate cortex | L/R | .001 | 0.02 | .014 | .887 |
| Supramarginal gyrus | L | −.008 | 1.214 | .108 | .271 |
Note: Bolded values indicate significant effects
Reported statistics indicate the effect of number of ADHD symptoms on the height of neural activation, within ADHD probands only. All measures derived from a single generalized estimating equations model for familial dependency between siblings, as well as for covariates age, gender, IQ, and scan site. A significance threshold of α < 0.05 was used.
The failed stop–successful stop contrast did not reveal any significant differences between diagnostic groups.
Associations of SST outcomes with fMRI task activation
Shorter SSRTs were significantly associated with higher levels of activation in left inferior frontal and left superior frontal gyrus during successful stops (Table SI 2). RTV and errors rates were not associated with activation in any of the nodes. Post-hoc analyses confirmed the significant relation between inferior frontal activation and SSRT when examined in probands with ADHD and healthy controls separately, while the relation between SSRT and superior frontal activation only held in controls (see SI). We further investigated the distribution of task performance and neural activation across the three groups. To this end, we compared the percentage of participants with ADHD and siblings scoring above the 90th percentile of the control scores (see SI). This analysis showed that 12% of probands with ADHD and 7% of siblings showed task outcome (SSRT) above the 90th percentile of controls, while the elevated neural activation values across the different nodes showed on average 22% of probands and 19% of siblings values above the 90th percentile of controls (see table SI 5 for the comparison of individual nodes). This indicates that the within group distributions of scores of probands and siblings differed stronger from that of controls for the neural activation than for the behavioral task-outcome measures.
Covariate effects and sensitivity analyses
No significant effects of age, scanner site, and gender were found in any of the neural nodes, nor were there interaction effects between diagnostic group and these covariates. In the SI we present the outcomes of additional sensitivity analyses, in which we reexamined the main contrasts of interest while strictly correcting for IQ, gender, scan-site, medication status, familial relations, comorbid disorders, SSRT performance, and Conners’ scores. None of these factors significantly affected the reported main group differences in neural activation.
Discussion
This study conferred several new insights into the relation between response inhibition performance, related neural activation, and ADHD. First, we demonstrated slower SSRTs along with hypoactivation in both the frontal-striatal and frontal-parietal networks in adolescents and young adults with ADHD. Second, we showed that the level of hypoactivation in these networks correlated with both SSRT and ADHD severity. Third, we provided novel evidence for similar hypoactivation patterns in unaffected siblings, in the absence of behavioral response inhibition deficits (19). Last, we showed RTV and error rates were lower in both probands with ADHD and unaffected siblings, suggesting a specific response inhibition deficit in ADHD and a broader cognitive impairment in both probands and siblings.
Over all groups, neural activation patterns during both successful and failed stop trials comprised of a network including bilateral inferior frontal and superior frontal gyri, basal ganglia, and supramarginal areas. Activation in the inferior and superior frontal gyrus and basal ganglia nodes are in line with the response inhibition model proposed by Aron (5). On the other hand, activation in temporal and parietal nodes, areas previously linked to attentional redirection and task-set maintenance (42), likely reflect recruitment of attentional processes during response inhibition, in line with the models of Chambers (7) and Simmonds (43). The failed–successful stop contrast further revealed differential activation in visual areas, anterior cingulate, and inferior frontal cortex, consistent with previous findings, including a possible error processing component in anterior cingulate activation (42). Inferior frontal activation in this contrast may reflect recruitment of additional resources to the response inhibition network (5) or reflect more general cue-updating after failed responses (10). These results indicate that response inhibition is realized by activation in a large number of nodes from both frontal-striatal and frontal-parietal networks.
Adolescents and young adults with ADHD and their unaffected siblings showed levels of hypoactivation during both successful and failed stop trials, with unaffected siblings generally showing levels of activation similar to probands or intermediate between controls and probands with ADHD. Hypoactivation patterns were distributed across left superior, inferior, and medial frontal as well as bilateral temporal/parietal nodes, indicating a general and familial neural dysfunction across a large number of nodes attributed to distinct neural networks. Our results thereby confirm many preliminary previous findings in smaller samples of children and adolescents (19–24; 44; 45), which taken together describe very similar hypoactivation patterns in fontal-striatal and frontal-parietal areas (26; 46). However, previous response inhibition studies in adults with ADHD reported both neural hypo- and hyperactivation in the response inhibition networks (21; 22; 26; 46). Our results indicate no evidence for hyperactivation, nor any interaction effects between neural activation and age. This suggests that at least in young adults the neural alterations are qualitatively similar to those in adolescents with ADHD, and resemble alterations reported in children.
Activation in inferior and superior frontal as well as temporal/parietal areas was associated with ADHD severity, suggesting multiple neural mechanisms affected in both ADHD probands, as previously proposed in a meta-analysis (26), but also in unaffected siblings. The hypoactivation in the left inferior and superior frontal gyrus were the only neural measures that correlated significantly with SSRT length. This again fits relatively well with the model proposed by Aron (5) who indicated the inferior frontal area as the central node in the response inhibition process. Both models by Aron (5) and Chambers (7) have additionally indicated the dorsolateral prefrontal cortex as critical for top down executive control, which would be the most likely explanation for the superior frontal hypoactivation in probands with ADHD in this area. However, since there was no condition manipulating attention or top-down control, these speculations cannot be directly derived from our data.
Hypoactivation in supramarginal and temporal/parietal regions of probands with ADHD is also consistent with models by Chambers and Simmonds (7; 43) that implicate these regions in attentional processes, which may influence the response inhibition process indirectly. These models are supported by evidence from transcranial magnetic stimulation studies showing attenuated attentional processing after parietal cortex stimulation (47). However, none of the task-outcome measures were related to neural activation in the parietal nodes. Therefore, more research targeting the temporal/parietal areas is necessary to establish their causal role in response inhibition and ADHD. Lastly, hypoactivation in anterior cingulate areas during the failed inhibition trials in both probands with ADHD and siblings would suggest an additional deficit in response to perceived errors (48). This appears consistent with higher error rates found in probands with ADHD, although we found no direct association between error rates and anterior cingulate activation.
No group differences were found in the failed–successful stop contrast, indicating that there are no qualitative differences underlying inhibition failure between the diagnostic groups. Rather, the neurobiological nature of response inhibition deficits in ADHD is related to distributed hypoactivation in both frontal-striatal and frontal-parietal nodes during both task conditions.
The neural hypoactivation observed in unaffected siblings is largely in line with previous work (19) that showed similar patterns of hypoactivation in inferior frontal and parietal areas in the absence of behavioral deficits in unaffected siblings of probands with ADHD; though this previous work reported atypical activation in the right instead of left inferior frontal gyrus for siblings. The intermediate activation levels in inferior frontal and temporal/parietal nodes specifically fit with previous work addressing the heritable nature of inferior frontal activation (49). However, the predicted pattern of intermediate activation in siblings was present only during the failed stop condition, and was not found in the superior frontal and supramarginal regions. Thus, although no direct evidence was found for differential activation between the successful and failed conditions, activation during the failed stop trials nonetheless appeared most sensitive in distinguishing probands with ADHD, unaffected siblings, and controls.
The absence of behavioral response inhibition deficits in unaffected siblings is in contrast with previous behavioral literature (50), including evidence from our own sample at an earlier time (51). This current finding suggests that developmental factors are important in the investigation of familial patterns of response inhibition deficits, as unaffected siblings possibly show improved response inhibition performance during adolescence, while probands with ADHD do not (52).
Of note is that the effect sizes of behavioral versus neural measures suggest that the differences in neural activation during response inhibition between diagnostic groups are more robust than stop-signal reaction time differences. Comparisons of the distributions of behavioral and neural outcome measures likewise indicate that neural hypoactivation is also more consistently present than response inhibition deficits in probands with ADHD. The strong differences in RTV between probands with ADHD, their unaffected siblings, and healthy controls, with effect sizes comparable to those obtained from the neural measurements. These results confirm earlier studies regarding RTV as an endophenotype for ADHD (53–55). An alternative interpretation of the neural hypoactivation found in probands with ADHD could be that the deficits in RTV in both probands and their siblings are related to a general attentional deficit, mediated by temporal/parietal hypoactivation. However, there was no significant correlation between neural activation in parietal areas and RTV which makes this interpretation less likely.
No direct evidence for compensatory neural activation in either subjects with ADHD or unaffected siblings was found. The finding of hypoactivation in unaffected siblings in the absence of behavioral response inhibition deficits or compensatory neural mechanisms warrants further attention. Additional research is needed to establish if the siblings recruit compensatory resources that could not be detected using the current paradigm, or whether the hypoactivation observed in siblings is unrelated to the response inhibition process or insufficient to cause behavioral deficits. Specifically, functional connectivity measures may offer additional insight into the possible recruitment of alternative neural resources in unaffected siblings.
To summarize the group differences, hypoactivation in inferior frontal, superior frontal, and temporal/parietal regions all independently explained variance in ADHD severity, with unaffected siblings showing intermediate patterns of hypoactivation in these areas during failed but not successful inhibition, and in the absence of behavioral deficits. These findings support the familial nature of the response inhibition process in ADHD and suggest that the neural activation measures in these regions could be useful as possible endophenotypes for ADHD, although only the failed inhibition contrast showed a clear distinction between all three diagnostic groups.
It should further be noted that left rather than right inferior frontal activation distinguished our diagnostic groups. While we showed bilateral inferior activation patterns during response inhibition for all groups, no right sided hypoactivation was observed in probands with ADHD. Previous studies in both healthy controls and participants with ADHD have emphasized involvement of the right inferior frontal gyrus in response inhibition (5; 56), although recent studies also demonstrated functional involvement of the left inferior frontal gyrus in the response inhibition process (57). We postulate that both inferior frontal nodes are involved in response inhibition, and that lateralization may be more variable between individuals than hitherto thought. This study strongly indicates that the left hemisphere should not be neglected and that future studies should be aimed at delineating the specific functional differences in response inhibition nodes between hemispheres.
The current study should be viewed in light of its strengths and limitations. A main strength was the large and well documented sample. The unbalanced distributions of IQ and gender between diagnostic groups and scan-sites were potential weaknesses of the current design.
To conclude, we demonstrated a distinction in neural activation patterns during response inhibition between adolescents with ADHD, their unaffected siblings, and healthy controls, indicating the familial nature of neural activation patterns underlying response inhibition in ADHD. Specifically, neural activation measures in superior frontal, inferior frontal, and temporal/parietal nodes of the response inhibition network showed hypoactivation patterns in line with the endophenotype model during failed but not successful response inhibition.
Supplementary Material
Acknowledgments
The authors thank Roshan Cools for her invaluable input and comments in the preparation of this manuscript. We acknowledge the department of Pediatrics of the VU University Medical Center for having the opportunity to use the mock scanner for preparation of our participants. This work was supported by NIH Grant R01MH62873 (to Stephen V. Faraone), NWO Large Investment Grant 1750102007010 (to Jan Buitelaar) and grants from Radboud University Nijmegen Medical Center, University Medical Center Groningen and Accare, and VU University Amsterdam.
Footnotes
Disclosures: Jan K. Buitelaar has been in the past 3 years a consultant to/member of advisory board of/and/or speaker for Janssen Cilag BV, Eli Lilly, Bristol-Myer Squibb, Shering Plough, UCB, Shire, Novartis, and Servier. He is not an employee of any of these companies and not a stock shareholder of any of these companies. He has received no other financial or material support, including expert testimony, patents, and royalties. Jaap Oosterlaan has received in the past three years an investigator initiated grant from Shire pharmaceuticals.
References
- 1.Alderson RM, Rapport MD, Kofler MJ. Attention-deficit/hyperactivity disorder and behavioral inhibition: a meta-analytic review of the stop-signal paradigm. J Abnorm Child Psychol. 2007;35:745–758. doi: 10.1007/s10802-007-9131-6. [DOI] [PubMed] [Google Scholar]
- 2.Lipszyc J, Schachar R. Inhibitory control and psychopathology: a meta-analysis of studies using the stop signal task. J Int Neuropsychol Soc. 2010;16:1064–1076. doi: 10.1017/S1355617710000895. [DOI] [PubMed] [Google Scholar]
- 3.Adleman N, Kayser R, Dickstein D, Blair RJ, Pine D, Leibenluft E. Neural correlates of reversal learning in severe mood dysregulation and pediatric bipolar disorder. J Am Acad Child Adolesc Psychiatry. 2011;50:1–20. doi: 10.1016/j.jaac.2011.07.011. [DOI] [PMC free article] [PubMed] [Google Scholar]
- 4.Cortese S, Kelly C, Chabernaud C, Proal E, Di Martino A, Milham MP, Castellanos FX. Toward systems neuroscience of ADHD: a meta-analysis of 55 fMRI studies. Am J Psychiatry. 2012;169:1038–1055. doi: 10.1176/appi.ajp.2012.11101521. [DOI] [PMC free article] [PubMed] [Google Scholar]
- 5.Aron AR. From reactive to proactive and selective control: developing a richer model for stopping inappropriate responses. Biol Psychiatry. 2011;69:55–68. doi: 10.1016/j.biopsych.2010.07.024. [DOI] [PMC free article] [PubMed] [Google Scholar]
- 6.Aron AR, Durston S, Eagle DM, Logan GD, Stinear CM, Stuphorn V. Converging evidence for a fronto-basal-ganglia network for inhibitory control of action and cognition. J Neurosci. 2007;27:11860–11864. doi: 10.1523/JNEUROSCI.3644-07.2007. [DOI] [PMC free article] [PubMed] [Google Scholar]
- 7.Chambers CD, Garavan H, Bellgrove MA. Insights into the neural basis of response inhibition from cognitive and clinical neuroscience. Neurosci Biobehav Rev. 2009;33:631–46. doi: 10.1016/j.neubiorev.2008.08.016. [DOI] [PubMed] [Google Scholar]
- 8.Garavan H, Hester R, Murphy K, Fassbender C, Kelly C. Individual differences in the functional neuroanatomy of inhibitory control. Brain Res. 2006;1105:130–142. doi: 10.1016/j.brainres.2006.03.029. [DOI] [PubMed] [Google Scholar]
- 9.Simmonds DJ, Pekar JJ, Mostofsky SH. Meta-analysis of Go / No-go tasks demonstrating that fMRI activation associated with response inhibition is task-dependent. Neuropsychologia. 2008;46:224–232. doi: 10.1016/j.neuropsychologia.2007.07.015. [DOI] [PMC free article] [PubMed] [Google Scholar]
- 10.Hampshire A, Chamberlain SR, Monti MM, Duncan J, Owen AM. The role of the right inferior frontal gyrus: inhibition and attentional control. Neuroimage. 2010;50:1313–1319. doi: 10.1016/j.neuroimage.2009.12.109. [DOI] [PMC free article] [PubMed] [Google Scholar]
- 11.Zandbelt BB, Bloemendaal M, Hoogendam JM, Kahn RS, Vink M. Transcranial magnetic stimulation and functional MRI reveal cortical and subcortical interactions during stop-signal response inhibition. J Cog Neurosci. 2013;25:157–174. doi: 10.1162/jocn_a_00309. [DOI] [PubMed] [Google Scholar]
- 12.Swann NC, Cai W, Conner CR, Pieters TA, Claffey MP, George JS, Aron AR, Tandon N. Roles for the pre-supplementary motor area and the right inferior frontal gyrus in stopping action: electrophysiological responses and functional and structural connectivity. Neuroimage. 2011;59:2860–2870. doi: 10.1016/j.neuroimage.2011.09.049. [DOI] [PMC free article] [PubMed] [Google Scholar]
- 13.Cai W, George JS, Verbruggen F, Chambers CD, Aron AR. The role of the right pre-supplementary motor area in stopping action: two studies with event-related transcranial magnetic stimulation. J Neurophysiol. 2012;108:380–389. doi: 10.1152/jn.00132.2012. [DOI] [PMC free article] [PubMed] [Google Scholar]
- 14.Fassbender C, Murphy K, Hester R, Meaney J, Robertson IH, Garavan H. The role of a right fronto-parietal network in cognitive control: Common activations for “cues-to-attend” and response inhibition. J Psychophysiol. 2006;20:286–296. [Google Scholar]
- 15.Van Meel CS, Heslenfeld DJ, Oosterlaan J, Sergeant JA. Adaptive control deficits in attention-deficit/hyperactivity disorder (ADHD): the role of error processing. Psychiatry Res. 2007;151:211–20. doi: 10.1016/j.psychres.2006.05.011. [DOI] [PubMed] [Google Scholar]
- 16.Esterman M, Rosenberg MD, Noonan SK. Intrinsic fluctuations in sustained attention and distractor processing. J Neurosci. 2014;34:1724–1730. doi: 10.1523/JNEUROSCI.2658-13.2014. [DOI] [PMC free article] [PubMed] [Google Scholar]
- 17.Bekker EM, Overtoom CCE, Kooij JJS, Buitelaar JK, Verbaten MN, Kenemans JL. Disentangling deficits in adults with attention-deficit/hyperactivity disorder. Arch Gen Psychiatry. 2005;62:1129–1136. doi: 10.1001/archpsyc.62.10.1129. [DOI] [PubMed] [Google Scholar]
- 18.Cubillo A, Halari R, Giampietro V, Taylor E, Rubia K. Fronto-striatal underactivation during interference inhibition and attention allocation in grown up children with attention deficit / hyperactivity disorder and persistent symptoms. Psychiatry Res. 2011;193:17–27. doi: 10.1016/j.pscychresns.2010.12.014. [DOI] [PubMed] [Google Scholar]
- 19.Durston S, Mulder M, Casey BJ, Ziermans T, Van Engeland H. Activation in ventral prefrontal cortex is sensitive to genetic vulnerability for attention-deficit hyperactivity disorder. Biol Psychiatry. 2006;60:1062–1070. doi: 10.1016/j.biopsych.2005.12.020. [DOI] [PubMed] [Google Scholar]
- 20.Rubia K, Smith AB, Brammer MJ, Toone B, Taylor E. Abnormal brain activation during inhibition and error detection in medication-naive adolescents with ADHD. Am J Psychiatry. 2005;162:1067–1075. doi: 10.1176/appi.ajp.162.6.1067. [DOI] [PubMed] [Google Scholar]
- 21.Mulligan CR, Knopik VS, Sweet LH, Fisher MS, Seidenberg M, Rao SM. Neural correlates of inhibitory control in adult ADHD: evidence from the Milwaukee longitudinal sample. Psychiatry Res. 2011;194:119–129. doi: 10.1016/j.pscychresns.2011.02.003. [DOI] [PMC free article] [PubMed] [Google Scholar]
- 22.Congdon E, Altshuler LL, Mumford JA, Karlsgodt KH, Sabb FW, Ventura J, McGough JJ, London ED, Cannon TD, Bilder RM, Poldrack RA. Neural activation during response inhibition in adult attention-deficit/hyperactivity disorder: preliminary findings on the effects of medication and symptom severity. Psychiatry Res. 2014;222:17–28. doi: 10.1016/j.pscychresns.2014.02.002. [DOI] [PMC free article] [PubMed] [Google Scholar]
- 23.Pliszka SR, Glahn DC, Semrud-Clikeman M, Franklin C, Perez R, 3rd, Xiong J, Liotti M. Neuroimaging of inhibitory control areas in children with attention deficit/hyperactivity disorder who were treatment naive or in long-term treatment. Am J Psychiatry. 2006;163:1052–1060. doi: 10.1176/ajp.2006.163.6.1052. [DOI] [PubMed] [Google Scholar]
- 24.Epstein JN, Casey BJ, Tonev ST, Davidson MC, Reiss AL, Garrett A, Hinshaw SP, Greenhill LL, Glover G, Shafritz KM, Vitolo A, Kotler LA, Jarrett MA, Spicer J. ADHD- and medication-related brain activation effects in concordantly affected parent-child dyads with ADHD. J Child Psychol Psychiatry. 2007;48:899–913. doi: 10.1111/j.1469-7610.2007.01761.x. [DOI] [PubMed] [Google Scholar]
- 25.Bush G. Cingulate, frontal, and parietal cortical dysfunction in attention-deficit/hyperactivity disorder. Biol Psychiatry. 2011;69:1160–1167. doi: 10.1016/j.biopsych.2011.01.022. [DOI] [PMC free article] [PubMed] [Google Scholar]
- 26.Hart H, Radua J, Nakao T, Mataix-Cols D, Rubia K. Meta-analysis of functional magnetic resonance imaging studies of inhibition and attention in attention-deficit/hyperactivity disorder: exploring task-specific, stimulant medication, and age effects. JAMA Psychiatry. 2013;70:185–198. doi: 10.1001/jamapsychiatry.2013.277. [DOI] [PubMed] [Google Scholar]
- 27.Cubillo A, Halari R, Ecker C, Giampietro V, Taylor E, Rubia K. Reduced activation and inter-regional functional connectivity of fronto-striatal networks in adults with childhood Attention-Deficit Hyperactivity Disorder (ADHD) and persisting symptoms during tasks of motor inhibition and cognitive switching. J Psychiatr Res. 2010;44:629–639. doi: 10.1016/j.jpsychires.2009.11.016. [DOI] [PubMed] [Google Scholar]
- 28.Dibbets P, Evers L, Hurks P, Marchetta N, Jolles J. Differences in feedback- and inhibition-related neural activity in adult ADHD. Brain Cogn. 2009;70:73–83. doi: 10.1016/j.bandc.2009.01.001. [DOI] [PubMed] [Google Scholar]
- 29.Schneider MF, Krick CM, Retz W, Hengesch G, Retz-junginger P, Reith W, Rösler M. Impairment of fronto-striatal and parietal cerebral networks correlates with attention deficit hyperactivity disorder (ADHD) psychopathology in adults — a functional magnetic resonance imaging (fMRI) study. Psychiatry Res. 2010;183:75–84. doi: 10.1016/j.pscychresns.2010.04.005. [DOI] [PubMed] [Google Scholar]
- 30.Rubia K, Cubillo A, Smith AB, Woolley J, Heyman I, Brammer MJ. Disorder-specific dysfunction in right inferior prefrontal cortex during two inhibition tasks in boys with attention-deficit hyperactivity disorder compared to boys with obsessive-compulsive disorder. Hum Brain Mapp. 2010;31:287–299. doi: 10.1002/hbm.20864. [DOI] [PMC free article] [PubMed] [Google Scholar]
- 31.Garavan H, Ross J, Murphy K, Roche RAP, Stein EA. Dissociable executive functions in the dynamic control of behavior: inhibition, error detection, and correction. Neuroimage. 2002;17:1820–1829. doi: 10.1006/nimg.2002.1326. [DOI] [PubMed] [Google Scholar]
- 32.Gottesman II, Gould TD. The endophenotype concept in psychiatry: etymology and strategic intentions. Am J Psychiatry. 2003;160:636–645. doi: 10.1176/appi.ajp.160.4.636. [DOI] [PubMed] [Google Scholar]
- 33.Glahn DC, Knowles EEM, McKay DR, Sprooten E, Raventós H, Blangero J, Gottesman II, Almasy L. Arguments for the sake of endophenotypes: examining common misconceptions about the use of endophenotypes in psychiatric genetics. Am J Med Genet. 2014;165:122–130. doi: 10.1002/ajmg.b.32221. [DOI] [PMC free article] [PubMed] [Google Scholar]
- 34.Cannon TD, Keller MC. Endophenotypes in the genetic analyses of mental disorders. Annu Rev Clin Psychol. 2006;2:267–290. doi: 10.1146/annurev.clinpsy.2.022305.095232. [DOI] [PubMed] [Google Scholar]
- 35.Fassbender C, Schweitzer J. Is there evidence for neural compensation in attention deficit hyperactivity disorder? A review of the functional neuroimaging literature. Clin Psychol Rev. 2006;26:445–465. doi: 10.1016/j.cpr.2006.01.003. [DOI] [PMC free article] [PubMed] [Google Scholar]
- 36.Dillo W, Göke A, Prox-Vagedes V, Szycik GR, Roy M, Donnerstag F, Emrich HM, Ohlmeier MD. Neuronal correlates of ADHD in adults with evidence for compensation strategies–a functional MRI study with a Go/No-Go paradigm. Ger Med Sci. 2010;8:1–8. doi: 10.3205/000098. [DOI] [PMC free article] [PubMed] [Google Scholar]
- 37.Durston S, Tottenham NT, Thomas KM, Davidson MC, Eigsti I-M, Yang Y, Ulug AM, Casey BJ. Differential patterns of striatal activation in young children with and without ADHD. Biol Psychiatry. 2003;53:871–878. doi: 10.1016/s0006-3223(02)01904-2. [DOI] [PubMed] [Google Scholar]
- 38.Müller UC, Asherson P, Banaschewski T, Buitelaar JK, Ebstein RP, Eisenberg J, Gill M, Manor I, Miranda A, Oades RD, Roeyers H, Rothenberger A, Sergeant JA, Sonuga-Barke EJS, Thompson M, Faraone SV, Steinhausen H-C. The impact of study design and diagnostic approach in a large multi-centre ADHD study. Part 1: ADHD symptom patterns. BMC Psychiatry. 2011;11:54. doi: 10.1186/1471-244X-11-54. [DOI] [PMC free article] [PubMed] [Google Scholar]
- 39.Von Rhein D, Mennes M, Van Ewijk H, Groenman AP, Zwiers M, Oosterlaan J, Heslenfeld D, Franke B, Hoekstra PJ, Faraone SV, Hartman C, Buitelaar J. The NeuroIMAGE study: a prospective phenotypic, cognitive, genetic and MRI study in children with attention-deficit hyperactivity disorder. Design and descriptives. Eur Child Adolesc Psychiatry. doi: 10.1007/s00787-014-0573-4. in press. [DOI] [PubMed] [Google Scholar]
- 40.Logan GD, Cowan WB, Davis KA. On the ability to inhibit simple and choice reaction time responses: a model and a method. J Exp Psychol Hum Percept Perform. 1984;10:276–291. doi: 10.1037//0096-1523.10.2.276. [DOI] [PubMed] [Google Scholar]
- 41.Woo C-W, Krishnan A, Wager TD. Cluster-extent based thresholding in fMRI analyses: pitfalls and recommendations. Neuroimage. 2014;91:412–9. doi: 10.1016/j.neuroimage.2013.12.058. [DOI] [PMC free article] [PubMed] [Google Scholar]
- 42.Sharp DJ, Bonnelle V, De Boissezon X, Beckmann CF, James SG, Patel MC, Mehta MA. Distinct frontal systems for response inhibition, attentional capture, and error processing. Proc Natl Acad Sci U S A. 2010;107:6106–6111. doi: 10.1073/pnas.1000175107. [DOI] [PMC free article] [PubMed] [Google Scholar]
- 43.Simmonds DJ, Pekar JJ, Mostofsky SH. Meta-analysis of Go / No-go tasks demonstrating that fMRI activation associated with response inhibition is task-dependent. Neuropsychologia. 2008;46:224–32. doi: 10.1016/j.neuropsychologia.2007.07.015. [DOI] [PMC free article] [PubMed] [Google Scholar]
- 44.Suskauer S, Simmonds D, Fotedar S, Blankner JG, Pekar JJ, Denckla MB, Mostofsky SH. Functional magnetic resonance imaging evidence for abnormalities in response selection in attention deficit hyperactivity disorder: differences in activation associated. J Cog Neurosci. 2008;20:478–493. doi: 10.1162/jocn.2008.20032. [DOI] [PMC free article] [PubMed] [Google Scholar]
- 45.Smith AB, Taylor E, Brammer M, Toone B, Rubia K. Task-specific hypoactivation in prefrontal and and temporoparietal brain regions during motor inhibition and task switching in medication-naive children and adolescents with attention deficit hyperactivity disorder. Am J Psychiatry. 2006;163:1044–1051. doi: 10.1176/ajp.2006.163.6.1044. [DOI] [PubMed] [Google Scholar]
- 46.Cubillo A, Halari R, Smith A, Taylor E, Rubia K. A review of fronto-striatal and fronto-cortical brain abnormalities in children and adults with Attention Deficit Hyperactivity Disorder (ADHD) and new evidence for dysfunction in adults with ADHD during motivation and attention. Cortex. 2011:1–22. doi: 10.1016/j.cortex.2011.04.007. [DOI] [PubMed] [Google Scholar]
- 47.Chambers CD, Stokes MG, Janko NE, Mattingley JB. Enhancement of visual selection during transient disruption of parietal cortex. Brain Res. 2006;1097:149–155. doi: 10.1016/j.brainres.2006.04.084. [DOI] [PubMed] [Google Scholar]
- 48.Schachar RJ, Chen S, Logan GD, Ornstein TJ, Crosbie J, Ickowisz A, Pakulak A. Evidence for an error monitoring deficit in attention deficit hyperactivity disorder. J Abnorm Child Psychol. 2004;32:298–293. doi: 10.1023/b:jacp.0000026142.11217.f2. [DOI] [PubMed] [Google Scholar]
- 49.Koten J, Wood G, Hagoort P, Goebel R. Genetic contribution to variation in cognitive function: an fMRI study in twins. Science. 2009;323:1737–1740. doi: 10.1126/science.1167371. [DOI] [PubMed] [Google Scholar]
- 50.Bidwell LC, Willcutt EG, Defries JC, Pennington BF. Testing for neuropsychological endophenotypes in siblings discordant for attention-deficit/hyperactivity disorder. Biol Psychiatry. 2007;62:991–998. doi: 10.1016/j.biopsych.2007.04.003. [DOI] [PMC free article] [PubMed] [Google Scholar]
- 51.Rommelse NNJ, Altink ME, Oosterlaan J, Buschgens CJM, Buitelaar J, Sergeant JA. Support for an independent familial segregation of executive and intelligence endophenotypes in ADHD families. Psychol Med. 2008:1595–1606. doi: 10.1017/S0033291708002869. [DOI] [PubMed] [Google Scholar]
- 52.Thissen AJ, Luman M, Hartman C, Hoekstra P, Van Lieshout M, Franke B, Oosterlaan J, Rommelse NNJ, Buitelaar JK. Attention-deficit/hyperactivity disorder (ADHD) and motor timing in adolescents and their parents: familial characteristics of reaction time variability vary with age. J Am Acad Child Adolesc Psychiatry. 2014;53:1010–1019. doi: 10.1016/j.jaac.2014.05.015. [DOI] [PubMed] [Google Scholar]
- 53.Castellanos F, Sonuga-Barke E. Varieties of attention-deficit/hyperactivity disorder-related intra-individual variability. Biol Psychiatry. 2005;57:1416–1423. doi: 10.1016/j.biopsych.2004.12.005. [DOI] [PMC free article] [PubMed] [Google Scholar]
- 54.Klein C, Wendling K, Huettner P, Ruder H, Peper M. Intra-subject variability in attention-deficit hyperactivity disorder. Biol Psychiatry. 2006;60:1088–1097. doi: 10.1016/j.biopsych.2006.04.003. [DOI] [PubMed] [Google Scholar]
- 55.Kofler MJ, Rapport MD, Sarver DE, Raiker JS, Orban SA, Friedman LM, Kolomeyer EG. Reaction time variability in ADHD: a meta-analytic review of 319 studies. Clinical psychology review. 2013;33:795–811. doi: 10.1016/j.cpr.2013.06.001. [DOI] [PubMed] [Google Scholar]
- 56.Rubia K, Smith AB, Brammer MJ, Taylor E. Right inferior prefrontal cortex mediates response inhibition while mesial prefrontal cortex is responsible for error detection. Neuroimage. 2003;20:351–358. doi: 10.1016/s1053-8119(03)00275-1. [DOI] [PubMed] [Google Scholar]
- 57.Swick D, Ashley V, Turken U. Left inferior frontal gyrus is critical for response inhibition. BMC Neurosci. 2008;9:1–11. doi: 10.1186/1471-2202-9-102. [DOI] [PMC free article] [PubMed] [Google Scholar]
- 58.Conners CK, S G, P JD, E JN. The revised Conners’ Parent Rating Scale (CPRS-R): factor structure, reliability, and criterion validity. J Abnorm Child Psychol. 1998;26:257–268. doi: 10.1023/a:1022602400621. [DOI] [PubMed] [Google Scholar]
- 59.Wechsler D. Technische handleiding. The Psychological Corporation; London: 2002. WAIS-III Nederlandstalige bewerking. [Google Scholar]
- 60.Kaufman C, Birmaher B, Brent D, Rao U, Flynn C, Moreci P, Williamson D, Ryan N. Schedule for affective disorders and schizophrenia for school-age children-present and lifetime version (K-SADS-PL): initial reliability and validity data. J Am Acad Child Adolesc Psychiatry. 1997;36:980–8. doi: 10.1097/00004583-199707000-00021. [DOI] [PubMed] [Google Scholar]
Associated Data
This section collects any data citations, data availability statements, or supplementary materials included in this article.