

Abstract
Microbubbles bearing plasmonic nanoparticles on their surface provide contrast enhancement for both photoacoustic and ultrasound imaging. In this work, the responses of microbubbles with surface-bound gold nanorods – termed AuMBs – to nanosecond pulsed laser excitation were studied using high-speed microscopy, photoacoustic imaging, and numerical modeling. In response to laser fluences below 5 mJ cm−2, AuMBs produce weak photoacoustic emissions and exhibit negligible microbubble wall motion. However, in reponse to fluences above 5 mJ cm−2, AuMBs undergo dramatically increased thermal expansion and emit nonlinear photoacoustic waves of over 10-fold greater amplitude than would be expected from freely dispersed gold nanorods. Numerical modeling suggests that AuMB photoacoustic responses to low laser fluences result from conductive heat transfer from the surface-bound nanorods to the microbubble gas core, whereas at higher fluences, explosive boiling may occur at the nanorod surface, producing vapor nanobubbles that contribute to rapid AuMB expansion. The results of this study indicate that AuMBs are capable of producing acoustic emissions of significantly higher amplitude than those produced by conventional sources of photoacoustic contrast. In vivo imaging performance of AuMBs in a murine kidney model suggests that AuMBs may be an effective alternative to existing contrast agents for non-invasive photoacoustic and ultrasound imaging applications.
Keywords: photoacoustic imaging, microbubbles, plasmonic nanoparticles, cavitation
Graphical Abstract
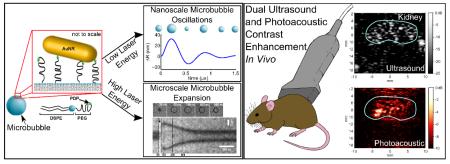
Microbubbles with gold nanorods on their surface exhibit different behaviors when exposed to low and high pulsed laser energy. In response to low energy excitation, the microbubble undergoes nanometer radial oscillations, while in response to higher laser energies, vapor nanobubble formation on the microbubble surface drives rapid microscale expansion. We demonstrate that these agents provide contrast enhancement for both ultrasound and photoacoustic imaging in vivo.
1. Introduction
Photoacoustic imaging is a noninvasive imaging technique that provides high contrast images of optical absorption within living tissue.[1] Photoacoustic signals arise from the conversion of absorbed optical energy to heat, causing transient thermoelastic expansion and subsequent wideband ultrasonic emission.[2,3] While first explored for the detection of endogenous sources of optical contrast (e.g. hemoglobin, melanin), photoacoustic imaging has been extended to molecular imaging applications through the use of exogenous contrast agents, such as dyes and nanoparticles.[4–9] In particular, plasmonic metal nanoparticles exhibit optical absorption cross-sections that are orders of magnitudes higher than those of endogenous tissue chromophores and are effective molecular imaging agents when functionalized with moieties targeted to specific molecules.[6,8,10–12]
The sensitivity, specificity, and imaging depth of photoacoustics are limited by the efficiency with which optical absorbers convert light energy to sound.[1] The origin of biomedical photoacoustic signals has historically been restricted to photothermal expansion of liquid or solid materials that possess relatively small coefficients of thermal expansion. The acoustic transients produced by these materials are weak, which significantly limits the signal-to-noise ratio (SNR) and penetration depth of in vivo photoacoustic imaging.[1,9,13] While the introduction of plasmonic nanoparticles has enhanced the sensitivity of photoacoustic imaging on account of their greatly increased optical absorption, their photoacoustic emissions are still derived from thermoelastic expansion, which fundamentally limits the magnitude of the photoacoustic transient.[14,15] However, new classes of photoacoustic contrast agents that utilize vaporization and gaseous expansion for photoacoustic signal generation have recently demonstrated photoacoustic emissions several orders of magnitude greater than those typically encountered in biomedical photoacoustic imaging.[14–17] Furthermore, some formulations of these new contrast agents enhance photoacoustic emissions at laser fluences below the current safety limits for laser irradiation, thereby enabling optically-guided, deep tissue therapy and imaging.[14,15,18,19]
Photoacoustic signal generation via gaseous expansion is achieved by using either a liquid perfluorocarbon precursor that vaporizes upon laser excitation or a preformed gaseous microbubble.[14–18,20–24] Preformed microbubbles bearing gold nanoparticles on their surface produce significant photoacoustic signal enhancement when compared to freely dispersed gold nanoparticles.[18,21] These agents are referred to as AuMBs, and unlike phase-change perfluorocarbon nanodroplets, increased pressures are not derived from the vaporization of a liquid perfluorocarbon precursor.[14–17] The exact mechanisms underlying photoacoustic signal enhancement from AuMBs are not well characterized. However, Dove et al recently demonstrated that, for AuMBs bearing 5 nm diameter gold nanospheres on their surface, heat transfer from the nanospheres to the gaseous core induces AuMB oscillations that enhance the photoacoustic response by approximately 8-fold relative to freely dispersed gold nanospheres.[22,25]
In this work, we propose two additional mechanisms for the photoacoustic enhancement observed from AuMBs and describe a fluence-dependent nonlinear behavior that has not been previously reported. High-speed video microscopy and numerical modelling results support the findings of Dove et al: specifically, we find that AuMB photoacoustic responses resulting from small increases in nanoparticle temperature are driven by conductive heat transfer from the nanoparticles to the AuMB gas core.[18,22] However, we empirically observed that when the gold nanoparticles are heated to higher temperatures, AuMBs exhibit radial expansion dynamics that scale nonlinearly with laser fluence. In this nonlinear regime, conductive heat transfer cannot confer enough energy to the gaseous core to account for the up to 3-fold increase in AuMB radius that was observed experimentally. Rather, these results suggest that AuMB expansion in response to high laser fluence is driven by vapor-bubble formation on the gold nanoparticle surface and rapid mass-transfer from the vapor bubbles to the expanding AuMB.[26–30] Indeed, altered heat-transfer dynamics at the nanoparticlemicrobubble interface may promote nanobubble formation at lower fluence than is typically required for homogeneous nucleation of vapor bubbles, thereby enabling high-SNR, vaporization-based photoacoustic imaging at safe laser fluence.[15,19,29–32]
2. Results
2.1. Synthesis and Characterization of AuMBs
Microbubbles were comprised of 1,2-distearoyl-sn-glycero-3-phosphocholine (DSPC) and 1,2-distearoyl-sn-glycero-3-phosphoethanolamine-N- [PDP (polyethylene glycol) - 2000] (PDP-PEG2000-DSPE) lipid with a decafluorobutane (DFB) gas core. The presence of the PDP group enabled direct gold-thiol linkage of AuNRs to the surface of the microbubble, as depicted in Figure 1a.[33] After overnight incubation with AuNRs, the microbubble suspension turned from opaque white to dark brown, indicating a change in optical absorption (Figure 1b). Following a series of wash-steps to remove unbound AuNRs, an estimated 4300 ± 710 AuNRs were associated with each microbubble, corresponding to a loading efficiency of 19 ± 3% (see Supporting Information, Figure S1). Direct binding of AuNRs to the microbubble surface was confirmed by transmission electron microscopy (TEM, Figure 1c). AuNRs associated with the microbubble shell as both single AuNRs and AuNR aggregates of varying size and orientation. AuMBs exhibited a statistically significant red-shift in peak absorbance from 749.0 ± 1.9 nm to 757.5 ± 3.1 nm, which may be the result of refractive index change related to the lipid shell or plasmonic coupling between AuNRs (n = 6, p < 0.05, Figure 1e).[34,35] Notably, far fewer AuNRs associated with microbubbles lacking PDP on their surface, suggesting that the presence of PDP was required for association of the AuNRs with the microbubble shell (Figure 1d). The surface zeta-potentials for the AuNRs and microbubbles were 0.10 ± 0.51 and −0.35 ± 0.83 mV, respectively, ruling out a strong electrostatic coupling mechanism.
Figure 1.

(a) Schematic of AuNR linkage to microbubble surface. (b) Suspensions of AuMBs (left) and plain microbubbles (right). (c) Representative TEM image of AuNRs on the microbubble surface. Note the presence of both AuNR clusters and single AuNRs. (d) Significantly reduced AuNR loading on surface of microbubble with no PDP group. (e) Optical absorption spectra of freely dispersed AuNRs and AuNRs bound to AuMBs. Note the red-shift of the longitudinal plasmon resonance observed for AuMBs
2.2. AuMB Responses to Nanosecond Pulsed Laser Excitation
AuMB responses to single 5-ns laser pulses were recorded by high-speed photography and photoacoustic emissions were simultaneously measured by a focused 10 MHz ultrasound transducer. Two distinct behaviors were observed that were dependent upon the laser fluence. Below approximately 5 mJ cm−2, no microbubble wall motion was observable in the microscopy images, although low amplitude photoacoustic emissions were detected.[22] However, above 5 mJ cm−2, single AuMBs rapidly expanded and contracted, producing strong photoacoustic responses.
Figure 2a,d,g show 1-D streak camera images and temporally registered 2-D snap-shots of single AuMB responses to 20, 10, and 5 mJ cm−2 laser fluences, respectively. Each AuMB radial response is marked by a rapid expansion and contraction, although some AuMBs (Figure 2a,d) exhibited a prolonged compressional phase relative to their initial rate of expansion. Rapid AuMB expansion following laser excitation was observed more frequently at higher fluences and resulted in higher AuMB wall velocities and larger amplitude photoacoustic waves. High-speed video recordings of AuMB responses to single laser pulses are provided in Supplementary Movies 1-4.
Figure 2.

(a,d,g) Streak camera and temporally registered 2-D snapshots for single AuMBs exposed to single laser pulses of 20, 10, and 5 mJ/cm2 fluence, respectively. The x-axis of these 2D plots is time (ns), while the y-axis is distance (μm). The black, vertical dotted lines on the streak images indicate when the corresponding 2-D snapshot was acquired, and the black arrows indicate the time at which the laser pulse was applied. (b,e,h) Radius and wall velocity curves as a function of time for each AuMB. (c,f,i) Measured acoustic emission from each AuMB (black curve) along with the calculated acoustic emission derived from Equations 2 and 3 (red curve).
Radius-time and wall-velocity curves for each AuMB are presented in Figure 2b,e,h, and the measured photoacoustic emissions are presented in Figure 2c,f,i. As shown by the radius-time and velocity curves, peak AuMB wall velocities occur within the first 50 ns following the laser pulse or upon AuMB compression. According to potential flow theory, the acoustic pressure emitted by an oscillating bubble may be expressed as a function of its velocity potential:[25]
| (1) |
| (2) |
where φ is the velocity potential, ρw is the density of water, R(t), and are the bubble radius and its time derivatives, and r is the recording distance.[25] The calculated acoustic response for each bubble is presented by red waveforms in Figure 2c,f,i. The agreement between the measured and calculated acoustic signals suggests that the acoustic emission may be accurately described by potential flow theory, even though AuMB expansion was triggered by rapid heat deposition on the AuMB surface rather than an externally applied pressure source.[25,36]
AuMB radial dynamics were investigated further for fluences of 5, 10, and 20 mJ cm−2. Similar to vapor bubble formation around plasmonic nanoparticles, the average relative radial expansion, (Figure 3a), bubble expansion lifetime (Figure 3b), and wall velocities increased with increasing laser fluence.[26,36–38] A strong positive correlation between peak wall velocity and was also observed (r2=0.71, Figure 3e), while the AuMB initial radius did not appear to impact AuMB wall velocities (data not shown). Notably, in all cases, the AuMB remained intact following laser irradiation, however, on average, the final AuMB radius decreased following laser exposure in a fluence-dependent manner (Figure 3d).[22] Also, as predicted by Equations 2 and 3, a positive correlation was observed between the measured photoacoustic signal amplitude and the microbubble wall velocity (r2 = 0.63, Figure 3f).[25,26,39]
Figure 3.

Compiled results of high-speed camera and photoacoustic observation of single AuMB interactions with 5-ns duration laser pulses. (a) Relative AuMB radial expansion, (b) AuMB expansion lifetime, (c) peak wall velocity, and (d) relative change in AuMB radius following laser excitation as a function of laser fluence. (e) Peak AuMB wall velocities as a function Rmax/R0 and (f) peak photoacoustic signal as a function of peak AuMB wall velocity.
2.3. Photoacoustic Emission from AuMBs
Individual AuMBs and freely dispersed AuNRs (1×10¹³ AuNR/ml, OD = 10) were exposed to 5 ns duration laser pulses at fluences between 0.1 and 50 mJ cm−2, and the peak-to-peak amplitude of the photoacoustic signal as a function of fluence was recorded (Figure 4a). This concentration of freely dispersed AuNRs was chosen for comparison with single AuMBs because approximately 3000 – 6000 AuNRs were contained in the optical focus of the 100X objective, which is comparable to the number of AuNRs on a single AuMB. Below approximately 5 mJ cm−2, both AuMBs and freely dispersed AuNRs behave as linear photoacoustic contrast agents, which produce a pressure rise, p0, in response to pulsed laser excitation: , where β(T) is the thermal coefficient of volumetric expansion, ΔT is the local temperature increase, κ is the isothermal compressibility, Γ is the dimensionless Grünesien parameter of the surrounding medium, μα is the absorption coefficient of the nanoparticle, and Φ is the laser fluence.[1,28,39,40] For fluences up to approximately 5 mJ cm−2, the photoacoustic signal from single AuMBs scales linearly with increasing fluence and is 5.4 ± 0.6 fold greater than the signal recorded from the freely dispersed AuNRs (Figure 4a, inset). However, above 5 mJ cm−2, the photoacoustic amplitude scales nonlinearly with increasing laser fluence due to rapid AuMB expansion, as described in Section 2.2.[26,38,39,41,42] At these increased fluences, the relationship between fluence and photoacoustic amplitude is best described by a nonlinear power law relation, y = axk, with k = 3.1. As a result of this nonlinear relationship, the median photoacoustic amplitude at 20 mJ cm−2 is 5.8-fold higher than would be expected if photoacoustic amplitudes continued to scale linearly with fluence above 5 mJ cm−2.
Figure 4.

(a) Peak-to-peak photoacoustic signal amplitudes of single AuMBs and freely dispersed AuNRs (inset) versus laser fluence. (b) Probability of photoacoustic cavitation as a function of fluence for AuMBs and freely dispersed AuNRs. Note the reduction in fluence required to initiate cavitation in AuMBs versus AuNRs (c) Photoacoustic amplitude of a single AuMB exposed to 25 laser pulses at varying fluence. Note that different AuMBs were used at each fluence due to AuNR conversion to gold nanospheres.
In addition, the threshold fluence for homogenous nucleation of vapor nanobubbles on the surfaces of AuNRs was studied. The presence of nanobubble formation within the optical focal region was determined based on the magnitude of the acoustic emission detected from this region (Figure S3). The homogeneous nucleation threshold fluence is defined as the fluence at which nanobubble formation occurs 50% of the time.[41] The probability of nanobubble formation as a function of fluence for single AuMBs and freely dispersed AuNRs is shown in Figure 4b. Association of the AuNRs on the AuMB surface reduced the fluence threshold for nanobubble formation from approximately 42 mJ cm−2 to 8 mJ cm−2, consistent with the results of previous studies on aggregated plasmonic nanoparticles.[26,28,38,43]
Finally, photoacoustic signals were recorded for single AuMBs exposed to multiple laser pulses at fluences of 1, 5, 10, and 20 mJ cm−2 (Figure 2c). The photoacoustic signal of AuMBs exposed to fluences up to 5 mJ cm−2 are relatively stable, but photoacoustic signal enhancement only persists for 1 to 2 laser pulses above 5 mJ cm−2 due to permanent photothermal conversion of AuNRs to gold nanospheres.[44,45] Notably, while the photoacoustic signal decayed rapidly over multiple pulses at high fluence, the AuMBs persisted as intact microbubbles, although with substantially decreased optical absorption at 750 nm and with a decreased radius following laser excitation (Figure 3d).
2.4. Thermal Analysis at the AuMB Surface
The enhanced photoacoustic signal produced by AuMBs and the transition to a nonlinear relationship between laser fluence and photoacoustic amplitudes is hypothesized to result from both thermal-field overlap between closely-spaced AuNRs on the AuMB surface and modified heat transfer dynamics in the vicinity of the liquid-gas interface. The effect of thermal field overlap and plasmonic nanoparticle aggregation has been considered previously.[26,32,46] To determine the impact of the liquid-gas interface, a 3D finite-element model was developed to study the thermal effects of coupling a single AuNR to the microbubble shell.[39,47,48] Given the small length scales involved, the primary mode of heat transfer between the AuNR, water, and the gas core is conduction. This may be verified by consideration of the Grashof number () for this system, which indicates that viscous forces dominate buoyant forces at these dimensions.[29,49] The model geometry and representative two-dimensional heat transfer results from a single plane in the 3D model are shown in Figure 5a, while derivation of the model may be found in the Supporting Information.
Figure 5.

(a) (Top) 3D and 2D computational grid showing AuNR d nm away from gas core (water is invisible in 3D rendering). The dashed green line across the 2D plane denotes where temperature profiles in parts (b-d) are measured. (Bottom) Simulated 2D heat transfer results for two AuNRs (d = 5 nm and d = 50 nm) in the central plane of the model. The 2D temperature data was taken at the peak of the laser pulse, which occurred at t = 7 ns in the model. (b) Simulated temperature profiles between 1 – 11.5 ns for an AuNR placed 10 nm from the liquid-gas interface. (c) Simulated temperature profiles for an AuNR placed 10 nm from the liquid-gas interface and exposed to varying fluence. These profiles were captured at t = 7 ns. (d) Temperature profiles for AuNRs exposed to 10 mJ cm−2 fluence and placed at increasing distances from the liquid-gas interface. (e) (Top) Simulated gas temperatures for two AuMBs of differing radii for the first 200 ns of the model. It is assumed that both AuMBs contain 5000 AuNRs on their surface, each spaced 10 nm from the liquid-gas core. (Bottom) Simulated radial displacements for two AuMBs corresponding to the temperature profiles as computed by the modified Rayleigh-Plesset equation, Equation 3. (f) (Top) Simulated AuMB resonance frequency as a function of initial radius, R0. (Bottom) Simulated maximum radial displacement of a 2.5 μm AuMB containing 5000 AuNRs on its surface as a function of laser fluence.
In the simulations, a Gaussian-shaped laser pulse with 5 ns duration (FWHM) was applied to a single AuNR placed at varying distances, d, from the liquid-gas interface. The laser pulse was centered at 7 ns, and thermal profiles of the AuNR, water, and gas core at varying timesteps are shown in Figure 5b. For an AuNR placed 10 nm from the liquid-gas interface, peak AuNR temperatures occur at approximately 7 ns, while peak gas temperatures occur at 8.5 ns. The effect of increasing the laser fluence applied to an AuNR placed 10 nm from the liquid-gas interface is shown in Figure 5c. As shown, water temperatures in between the gas and AuNR are between 8-12% higher than water temperatures on the opposite side of the AuNR on account of reduce heat transfer into the gas core. Note that water temperatures begin to reach temperatures (80% · Tc) that could result in homogenous nucleation of vapor nanobubbles at fluences above 7.5 mJ cm−2.[26–31,37,50,51]
The effect of increasing the distance of the AuNR from the liquid-gas interface is shown in Figure 5d. The AuNR reaches significantly higher temperatures when placed closer to interface (16% higher at d=5 nm vs d=50 nm), which translates to increased heat transfer into the microbubble core and increased probability of water vaporization at reduced laser fluence. At distances above approximately 30 nm, thermal interactions between the AuNR and the gas core are significantly reduced.[42] Given the lengths of the lipid monolayer and PEG-2000 spacer, the AuNRs on the AuMBs used in the experimental studies are approximately 5 – 15 nm from the liquid-gas interface, depending on whether PEG-2000 exists in the brush-like or mushroom-like conformation.[52,53]
The heat transfer simulations were used to estimate the total amount of energy transferred from the AuNR into the gas core. If the gas core is assumed to heat homogenously such that its time-varying temperature may be written as Tg(t) and the effects of mass transfer and vapor pressure are assumed to be negligible, then AuMB radial wall motions may be estimated by the modified Rayleigh-Plesset equation:[25,54–56]
| (3) |
where the time-varying gas pressure is given by . A description of the parameters and their values is presented in the Supporting Information.[57,58] The total heat transferred from the AuNR into the AuMB was computed at each time step of the heat transfer simulations in order to estimate Tg(t). The simulated gas temperatures and radial perturbations of two AuMBs containing 5000 AuNRs on their respective surfaces are presented in Figure 5e. Regardless of AuMB size, the peak gas temperature is reached at approximately 8.5 ns and decays to T0 over the next 200 ns. The 4 μm diameter AuMB exhibits lower amplitude radial oscillations than the 2 μm diameter AuMB on account of its gas core reaching lower temperatures. Furthermore, the AuMBs oscillate at different frequencies, as is expected based on the difference in their resonance frequencies.[22,56] Finally, a compilation of simulation results at varying fluence and AuMB radii is shown in Figure 5f. As discussed, the AuMBs oscillate according to their resonance frequency (fR), and maximum radial excursions (ΔR) approach 100 nm for a 2.5 μm diameter AuMB exposed to 10 mJ cm−2 laser fluence. The simulation results are in good agreement with the experimental results of Dove et al, who measured up to 10 nm for AuMBs coated with weakly-absorbing 5 - 7 nm diameter gold nanospheres at low laser fluence.[22]
2.5 In vitro Multi-modality Imaging of AuMBs
In vitro photoacoustic and ultrasound pulse inversion imaging performance was assessed by placing AuMBs (10×106 per ml), freely dispersed AuNRs (5×10¹⁰ per ml), or freely dispersed AuNRs (5×10¹⁰ per ml) plus non-PDP microbubbles (10×106 per ml) into separate flow channels molded into a gelatin phantom. The sample of freely dispersed AuNRs and non-PDP microbubbles was prepared by adding the AuNRs to the microbubbles immediately prior to imaging so as to limit any interactions between the two contrast agents. As shown in Figure 6b,c, both channels containing microbubbles provided approximately 31.6 ± 4.7 dB increased contrast in pulse inversion imaging mode, while the center of the channel containing freely dispersed AuNRs provided no contrast above background (Figure 6a). Note that the pulse inversion imaging mode specifically detects microbubbles by canceling out linear acoustic backscatter from tissue and preferentially retaining non-linear acoustic signals produced by microbubble oscillations.[59]
Figure 6.

(a) PA and PI images of freely dispersed AuNRs (5×10¹⁰ per ml) within a gelatin flow phantom. (b) PA and PI images of AuMBs (1×10⁷ per ml) within a gelatin flow phantom. (c) PA and PI images of microbubbles (1×10⁷ per ml) and freely dispersed AuNRs within a gelatin flow phantom. All PA data was taken with the following parameters: λ=750 nm, 5 mJ cm−2 fluence, image comprised of 9 PA averages. PA and PI images are displayed on a linear scale with 20 and 40 dB of dynamic range, respectively.
Conversely, all three samples provided photoacoustic imaging contrast, although with markedly different image characteristics. First, the freely dispersed AuNRs generated a photoacoustic image consistent with illuminating a cylindrical target with homogenous optical absorbance (Figure 6a).[2,60] As shown, no contrast enhancement was observed in the lumen of the channel, but signals from the top (17.3 ± 3.2 dB) and bottom (13.1 ± 2.9 dB) interfaces are clearly distinguishable. The AuMBs also produced a strong photoacoustic signal from the top interface (15.6 ± 2.7 dB) and additionally provided enhanced contrast in the center of the lumen (11.9 ± 3.1 dB) (Figure 6b), implying heterogenous optical and acoustic absorption and scattering conditions within the channel.[2,21] Finally, the sample of freely dispersed AuNRs and non-PDP microbubbles also produced a photoacoustic signal from the top interface (13.7 ± 2.1 dB), but the signal from the lumen was of significantly lower amplitude (4.4 ± 1.7 dB) than the signal produced by the AuMBs (p < 0.01).
2.6. In vivo Multi-modality Imaging of AuMBs
Approximately 50×106 AuMBs were administered to a C57BL/6 mouse via retro-orbital injection to assess the in vivo imaging potential of AuMBs. B-mode, pulse-inversion, and photoacoustic images of AuMBs circulating in the murine kidney vasculature are shown in Figure 7. As shown in Figure 7b, the AuMBs enhance the ultrasound contrast by 16.8 ± 3.7 dB in the kidney vasculature, confirming that the presence of the AuNRs on the AuMB surface does not significantly impact their ability to provide acoustic contrast.[18,21] Additionally, the AuMBs provided an average of 5.7 ± 1.6 dB photoacoustic contrast (skin fluence = 5 mJ cm−2) that was spatially co-registered with the AuMB signal in the pulse inversion image. Ultrasound contrast enhancement persisted for approximately twelve minutes, while photoacoustic contrast enhancement only lasted approximately three minutes. The mouse experienced no short-term adverse effects to heart or respiration rates as a result of AuMB administration.
Figure 7.

(a) 15 MHz B-mode image of murine kidney (outlined in blue) prior to AuMB administration displayed with 60 dB dynamic range. (b) Pulse-inversion image of kidney demonstrating approximately 20 dB peak-ultrasound contrast enhancement by AuMBs in the renal vasculature. (c) Simultaneously acquired photoacoustic image of AuMBs circulating in kidney demonstrating approximately 5.7 dB average photoacoustic contrast enhancement (λ=750 nm, 5 mJ cm−2 skin fluence, image comprised of 9 photoacoustic averages).
3. Discussion
3.1. AuMB Response in the Linear Regime
In the linear regime, the amplitude of AuMB photoacoustic emissions scales linearly with increasing laser fluence (Figure 4a). This behavior mimics that of AuNRs, with the exception that the AuMBs studied in this work produced photoacoustic emissions of 5.4-fold greater amplitude than highly concentrated AuNRs (1×10¹³ ml−1, OD≅10). A similar result was first reported by Dove et al, who measured an 8-fold increase in photoacoustic signal amplitude from AuMBs templated with 5 – 7 nm gold nanospheres.[18] Photoacoustic signal enhancement from AuMBs is probably due to a combination of factors, not least of which is the reduced inter-particle spacing when AuNRs are attached to the microbubble surface. As an example, the freely dispersed AuNRs studied in Section 2.3 have an approximate inter-particle spacing of 570 nm (1×10¹³ ml−1). The TEM results presented in Figure 1c indicate that AuNRs are spaced much more closely on the AuMB surface (average inter-particle distance ≪ 100 nm). Therefore, the microbubble acts as a scaffold for preferentially arranging AuNRs at significantly reduced inter-particle distances, which is known to permit thermal field overlap and produce enhanced photoacoustic emissions.[26,32,46] Furthermore, the simulation results indicate that significant increases in water temperatures may be realized by reducing the distance between the AuNR and the gas core of the AuMB, thereby providing another source of photoacoustic enhancement unique to AuMBs (Figure 5d). This result, in particular, provides motivation for nanoscale-level design of AuMBs and suggests that heat transfer and photoacoustic amplitudes may be modified by altering the length of the PEG spacer.
Another possible mechanism for photoacoustic enhancement is AuMB expansion and oscillation in response to laser excitation.[22,61,62] Dove et al empirically demonstrated that, in response to low-fluence excitation, AuMBs bearing 5 – 7 nm diameter gold nanospheres on their surface oscillated at or near the resonance frequency of the microbubble.[22] In their study, AuMB radial oscillations ranged between 2 – 10 nm, and the AuMB response from several hundred thousand consecutive laser pulses was averaged to enable the measurement. The requirement for stability over this many laser pulses limited the maximum fluence that each AuMB could be exposed to before new nonlinear behaviors, such as those reported in the present study, adversely affected the measurement. However, their experimental findings validate our simulation results, which indicate that conductive heat transfer across the liquid-gas boundary is sufficient to drive nanometer-scale AuMB oscillations at the AuMB resonance frequency.
3.2. AuMB Response in the Non-Linear Regime
At fluences above approximately 5 mJ cm−2, AuMB photoacoustic amplitudes and radial dynamics begin to scale nonlinearly with increasing laser fluence (Figure 4a). However, simulation results indicate that heat conduction into the AuMB gas core cannot account for the up to 3-fold increase in AuMB radius that was observed experimentally (Figure 5e). Instead, rapid AuMB expansion in this nonlinear regime may be driven by a combination of microbubble gas core expansion and vapor nanobubble formation on the surface of the AuNRs. In this scenario, as the wall of the microbubble core rapidly expands due to conductive heating, it envelopes vapor nanobubbles as they form in response to heating above the homogenous nucleation temperature. Homogeneous nucleation begins to occur at temperatures around 80% · Tc and produces vapor nanobubbles of diameters between 10 – 1000 nm.[26–31,37,50,51] The simulation results of this study indicate that water temperatures at the AuNR surface approach 80% at laser fluences of 7.5 mJ cm−2 and higher, which is in good agreement with our experimental observations. Indeed, large AuMB expansion at fluences below 7.5 mJ cm−2 may result from the presence of AuNR clusters on the AuMB surface (Figure 1c), which are known to reduce the fluence required for vapor nanobubble formation.[26,31,32,43,46]
Interestingly, AuMB expansion in this nonlinear regime resulted in approximately spherically symmetric expansion and compression in close to 70% of AuMBs studied. This is in contrast to polymeric microcapsules recently described by Lajoinie et al, which exhibited discrete gas nucleation sites located within a dye-loaded, thick polymer shell.[36] Symmetric AuMB expansion may suggest relatively uniform AuNR loading on the AuMB surface, and observed departures from this behavior (Supplementary Movie 5) may indicate the presence of large AuNR clusters acting as discrete nucleation sites on the AuMB surface.[26,31,32,43,46] In any case, the formation of a large secondary vapor nanobubble of ≈1 μm diameter on the surface of an AuMB (Supplementary Movie 5), provides direct evidence in support of our hypothesis that vapor nanobubble formation plays a role in the rapid AuMB expansion observed in the nonlinear regime.
While AuMB expansion and compression is a violent process, with wall velocities up to 94 m s−1, it was not observed to cause fragmentation of the AuMBs at fluences up to 20 mJ cm−2. Chomas et al conducted detailed studies on the acoustic destruction threshold of microbubble contrast agents and determined that wall speeds up to several hundred meters per second and relative radial expansions exceeding 3-fold were required for consistent destruction of lipid-shelled microbubbles.[63–65] In this study, no AuMBs exposed to fluences below 20 mJ cm−2 reached these limits, and as a result, remained intact following laser excitation. However, these walls speeds are probably sufficient to temporarily permeabilize cell membranes via sonoporation and mobilize small particles via acoustic radiation force, enabling the delivery of membrane impermeable drugs to cells with fine spatiotemporal control.[66–69]
3.3. In Vitro and In Vivo Imaging with AuMBs
Deploying optical contrast agents on the surface of microbubbles preserves the concomitant advantages that microbubbles afford to ultrasound imaging, primarily: contrast enhancement, therapeutic enhancement via sonoporation, manipulation by acoustic radiation force, and endothelial-cell specific molecular imaging.[52,67,69–73] Both acoustic and photoacoustic contrast enhancement was observed from AuMBs in vitro (Figure 6), with AuMBs providing significantly more contrast enhancement within the lumen than either freely dispersed AuNRs or a suspension of unbound AuNRs with microbubbles. In addition, AuMBs provided approximately 7.5 ± 2.6 dB enhanced contrast when compared to the suspension of freely dispersed AuNRs and microbubbles, providing further evidence of photoacoustic signal enhancement derived from AuNR aggregation on the microbubble shell.[18]
The in vivo pulse inversion images (Figure 7b) confirm that AuMBs provide 16.8 ± 3.7 dB ultrasound contrast enhancement, and individual vessels within the murine kidney are easily resolved. Photoacoustic signal enhancement of 5.7 ± 1.6 dB by AuMBs up to an imaging depth of 10 mm (Figure 7c) demonstrates suitable photoacoustic imaging signal for in vivo applications. Individual blood vessels are not resolvable in the photoacoustic images, primarily due averaging data across multiple photoacoustic acquisions to achieve suitable SNR. Ultrasound contrast enhancement persisted for approximately twelve minutes, while photoacoustic contrast enhancement only lasted approximately three minutes. Reduced photoacoustic contrast duration may be a result of the lower sensitivity inherent to photoacoustic imaging and photothermal conversion of AuNRs to nanospheres, which reduces the magnitude of the longitudinal plasmon resonance at λ = 75 nm.[44,45] However, it should be noted that photothermal conversion is a limitation that may be overcome by coating AuNRs in a rigid, melt resistant, silica shell, as described by Chen et al.[45]
A total of 50×106 AuMBs carrying approximately 2×10¹¹ AuNRs (0.5 nM) were injected, which is considerably fewer AuNRs than was required to provide photoacoustic contrast in comparable in vivo imaging settings.[6,7] Increased photoacoustic contrast at lower AuNR concentrations may result from a combination of enhancement inherent to AuMBs, differing biodistribution patterns, and altered clearance mechanisms from the blood stream.[74–76] The optical power output of the linear-array photoacoustic imaging system (5 mJ cm−2 skin fluence at λ = 75 nm) was probably insufficient to cause widespread vapor nanobubble formation on the surface of AuMBs in the murine kidney, however, these results are the first demonstration of simultaneous in vivo ultrasound and photoacoustic imaging with AuMBs, confirming the feasibility of the multimodality imaging technique.
3.4 Limitations
The magnitude of the photoacoustic emission was observed to increase with increasing laser fluence, AuMB wall velocity, and relative AuMB expansion (Figure 3a,b). However, the acoustic emission during rapid expansion or compression cycles is broadband, and neither the 10 MHz single-element transducer nor the CL15-7 linear array transducer were able to adequately sample the entire waveform generated by the AuMBs.[25] Thus, the reported increase in photoacoustic amplitude may be an underestimation due to the bandwidth limitations of the ultrasound instrumentation.
The AuMBs studied in this report utilize AuNRs to confer optical absorbance at near-infrared wavelengths and permit deep tissue in vivo imaging.[6,7,12] Relative to gold nanospheres, AuNRs exhibit enhanced optical absorption and improved heat transfer properties, which permits enhanced photoacoustic signal generation and nanobubble formation on the AuNR surface at lower fluence.[12,49] Therefore, the laser fluence required for a transition into the nonlinear regime may have been significantly higher if small gold nanospheres were used instead of AuNRs. However, the inverse is also true, in that the transition to nonlinear AuMB behavior may be achieved at even lower fluence by replacing AuNRs with nanoparticles that exhibit enhanced optical absorption (e.g. gold nanocages, golden carbon nanotubes).[28]
4. Conclusion
AuMBs exhibited two distinct behaviors that were a function of laser fluence. In the linear regime, individual AuMBs produced photoacoustic waves with 5.4-fold increased amplitude relative to highly concentrated freely dispersed AuNRs, although no AuMB oscillations were detected microscopically. Above fluences of approximately 5 mJ cm−2, AuMBs rapidly expanded and produced large amplitude photoacoustic waves that scaled nonlinearly with laser fluence. The increase in photoacoustic amplitude may be explained by a combination of properties inherent to AuMBs. First, the AuMB surface provides a scaffold for AuNR aggregation at small inter-particle spacing that permits thermal field overlap and increased water temperatures.[42,46] Second, heat transfer into the AuMB gaseous core causes thermal expansion of the gas phase, giving rise to large amplitude photoacoustic emissions due to an increase coefficient of thermal expansion.[18,22] Third, close placement of AuNRs to the liquid-gas interface on the AuMB surface increases local water temperatures to the point that homogeneous nucleation occurs, resulting in the formation of vapor nanobubbles that contribute to AuMB expansion. Finally, a pilot in vivo imaging study with a linear-array photoacoustic imaging system achieved 16.8 ± 3.7 dB ultrasound and 5.7 ± 1.6 dB photoacoustic contrast enhancement from AuMBs, demonstrating their potential as effective multimodality contrast agents for deep tissue ultrasound and photoacoustic imaging.
5. Experimental Section
Synthesis and Characterization of AuMBs
PDP-microbubbles were comprised of DSPC (2 mg ml−1) and PDP-PEG2000-DSPE (1 mg ml−1) (Avanti Polar Lipids) in aqueous saline and were fabricated by dispersing decafluorobutane (DFB) gas in the lipid micellar aqueous media. Following fabrication, the microbubbles were subjected to centrifugal flotation to remove excess free lipid not associated with the microbubble shell. AuNRs (10 nm × 35 nm, Nanopartz, Inc) with 750 nm peak optical absorption and a neutral surface charge were centrifuged three times in fresh saline at 12000×g for 10 min to remove excess stabilizing ligands from solution.[33] To complete the conjugation, approximately 9×10¹² AuNRs were incubated with 5×10⁸ microbubbles under a DFB gas headspace for 24 hr under gentle agitation. Unattached AuNRs were removed by a final series of gravitational floatation steps (see Supporting Information). Floatation separation was performed until the optical density of the supernatant was less than 0.05, indicating the removal of freely dispersed AuNRs.[33] The surface charges of microbubbles, AuMBs, and AuNRs in 0.9% NaCl were measured by a Zetasizer Nano S (Malvern). Transmission electron microscopy (JEOL 2000-FX) was performed on a dilute suspension of AuMBs. Prior to placement in the TEM sample chamber, the AuMBs were incubated with 2% uranyl acetate for 30 s to provide a negative stain.
High-speed microscopic and photoacoustic observation of AuMB Dynamics
The experimental configuration is shown in Figure S2. Excitation light produced by a pulsed optical parametric oscillator (OPO) laser (Spectra Physics, Newport Corp.) operating at 750 nm wavelength, 20 Hz pulse repetition frequency, and 5 ns pulse width was passed through the back lightport of an inverted microscope (IX51, Olympus) and focused through a 100X water-immersion objective (NA=1.0) to a spot size of 9 μm radius. A 200 μm diameter cellulose tube (Spectrum Labs) was positioned in the optical focus and contained a dilute suspension of AuMBs. The acoustic focus of a 10 MHz, 0.5 inch diameter ultrasound transducer (V303, Panametrics, Olympus) was co-aligned with the optical focus, and photoacoustic waveforms were received and amplified (40 dB) by a 5900PR pulser-receiver (Panametrics, Olympus) and digitized by an oscilloscope at a 200 MHz sampling frequency (LC334AL, LeCroy). Optical energy density incident on the cellulose tube was measured by a pulsed optical power meter (918D, Newport Corp). Pulse-to-pulse variation in laser output was approximately 11% and did not vary with fluence. The pulsed laser triggered the acquisition of 24 two-dimensional high-speed camera images (SIMD24, Specialised Imaging) and a single one-dimensional streak camera image (OptoScope, Optronis GmbH). The 2-dimensional images had user-selected interframe times of 10-50 ns and the streak camera had a user-selected temporal resolution of between 200 and 600 ps. A xenon flash-lamp was used to provide high-intensity illumination for the short exposure, high-speed imaging. Microbubble radii were measured manually in MATLAB from streak images and automatically on the 2D images using a snake-based image segmentation algorithm in MATLAB.[77]
In Vivo Imaging of AuMBs
For the in vivo imaging study, a female C57BL/6 mouse was anesthetized using 1.5% isofluorane and 98.5% room air following proper animal care and use protocols (approved by University of Virginia Animal Care and Use Committee [ACUC]). The kidney was located on the imaging system using B-Mode ultrasound, and 50 million AuMBs in a volume of 100 μl were administered via retro-orbital injection. B-Mode, pulse-inversion, and photoacoustic (5 mJ cm−2 skin fluence, 9 averages per image) radiofrequency data were acquired immediately following AuMB injection. Raw radiofrequency data was beamformed, IQ-demodulated, logarithmically compressed, and normalized to the maximum value in each image prior to being displayed on an image grid with isotropic resolution. Images are presented on a dB scale with linear color maps. The kidney was manually segmented and its outline was overlaid on the pulse-inversion and photoacoustic images for reference.
Supplementary Material
Acknowledgements
Partial support for this research is provided by the National Institutes of Health under grants NIH HL090700 and NIH S10 RR025594 to JAH and by NSF GRFP, Virginia Space Grant Consortium, and Virginia Commonwealth Fellowships to AJD. The authors would like to thank Dr. Stacey Guillot for assistance with TEM measurements. The content is solely the responsibility of the authors and does not necessarily represent the official views of the NIH, NSF, or VGSC.
Contributor Information
Adam J Dixon, Department of Biomedical Engineering, University of Virginia, PO Box 800759, Charlottesville, VA USA 22908.
Dr. Song Hu, Department of Biomedical Engineering, University of Virginia, PO Box 800759, Charlottesville, VA USA 22908
Dr. Alexander L Klibanov, School of Medicine - Cardiovascular Division, University of Virginia, PO Box 800500, Charlottesville, VA USA 22908
Dr. John A Hossack, Department of Biomedical Engineering, University of Virginia, PO Box 800759, Charlottesville, VA USA 22908.
References
- [1].Wang LV, Hu S. Science. 2012;335:1458. doi: 10.1126/science.1216210. [DOI] [PMC free article] [PubMed] [Google Scholar]
- [2].Diebold G, Sun T, Khan M. Phys. Rev. Lett. 1991;67:3384. doi: 10.1103/PhysRevLett.67.3384. [DOI] [PubMed] [Google Scholar]
- [3].Bell AG. Science. 1881;2:242. doi: 10.1126/science.os-2.49.242. [DOI] [PubMed] [Google Scholar]
- [4].Laufer J, Elwell C, Delpy D, Beard P. Phys. Med. Biol. 2005;50:4409. doi: 10.1088/0031-9155/50/18/011. [DOI] [PubMed] [Google Scholar]
- [5].Wang X, Pang Y, Ku G, Xie X, Stoica G, Wang LV. Nat. Biotechnol. 2003;21:803. doi: 10.1038/nbt839. [DOI] [PubMed] [Google Scholar]
- [6].Li P-C, Wang C-RC, Shieh D-B, Wei C-W, Liao C-K, Poe C, Jhan S, Ding A-A, Wu Y-N. Opt. Express. 2008;16:18605. doi: 10.1364/oe.16.018605. [DOI] [PubMed] [Google Scholar]
- [7].Mallidi S, Larson T, Tam J, Joshi PP, Karpiouk A, Sokolov K, Emelianov S. Nano Lett. 2009;9:2825. doi: 10.1021/nl802929u. [DOI] [PMC free article] [PubMed] [Google Scholar]
- [8].Homan KA, Souza M, Truby R, Luke GP, Green C, Vreeland E, Emelianov S. ACS Nano. 2012;6:641. doi: 10.1021/nn204100n. [DOI] [PMC free article] [PubMed] [Google Scholar]
- [9].Erpelding TN, Kim C, Pramanik M, Jankovic L, Maslov K, Guo Z, Margenthaler JA, Pashley MD, Wang LV. Radiology. 2010;256:102. doi: 10.1148/radiol.10091772. [DOI] [PMC free article] [PubMed] [Google Scholar]
- [10].Pan D, Pramanik M, Senpan A, Allen JS, Zhang H, Wickline SA, Wang LV, Lanza GM. FASEB J. 2011;25:875. doi: 10.1096/fj.10-171728. [DOI] [PMC free article] [PubMed] [Google Scholar]
- [11].Jokerst JV, Cole AJ, Van de Sompel D, Gambhir SS. ACS Nano. 2012;6:10366. doi: 10.1021/nn304347g. [DOI] [PMC free article] [PubMed] [Google Scholar]
- [12].Link S, El-Sayed MA. J. Phys. Chem. B. 1999;103:8410. [Google Scholar]
- [13].Razansky D, Distel M, Vinegoni C, Ma R, Perrimon N, Köster RW, Ntziachristos V. Nat. Photonics. 2009;3:412. [Google Scholar]
- [14].Wilson K, Homan K, Emelianov S. Nat. Commun. 2012;3:618. doi: 10.1038/ncomms1627. [DOI] [PubMed] [Google Scholar]
- [15].Wei C, Lombardo M, Larson-Smith K, Pelivanov I, Perez C, Xia J, Matula T, Pozzo D, O’Donnell M. Appl. Phys. Lett. 2014;104:033701. doi: 10.1063/1.4862461. [DOI] [PMC free article] [PubMed] [Google Scholar]
- [16].Hannah A, Luke G, Wilson K, Homan K, Emelianov S. ACS Nano. 2014;8:250. doi: 10.1021/nn403527r. [DOI] [PMC free article] [PubMed] [Google Scholar]
- [17].Strohm E, Rui M, Gorelikov I, Matsuura N, Kolios M. Biomed. Opt. Express. 2011;2:1432. doi: 10.1364/BOE.2.001432. [DOI] [PMC free article] [PubMed] [Google Scholar]
- [18].Dove JD, Murray TW, Borden MA. Soft Matter. 2013;9:7743. [Google Scholar]
- [19].Winkler J. American National Standard for Safe Use of Lasers (ANSI) 2007 [Google Scholar]
- [20].Xu RX. Contrast Media Mol. Imaging. 2011;6:401. doi: 10.1002/cmmi.442. [DOI] [PubMed] [Google Scholar]
- [21].Wang Y-H, Liao A-H, Chen J-H, Wang C-RC, Li P-C. J. Biomed. Opt. 2012;17:045001. doi: 10.1117/1.JBO.17.4.045001. [DOI] [PubMed] [Google Scholar]
- [22].Dove JD, Borden MA, Murray TW. Opt. Lett. 2014;39:3732. doi: 10.1364/OL.39.003732. [DOI] [PubMed] [Google Scholar]
- [23].Huynh E, Lovell JF, Helfield BL, Jeon M, Kim C, Goertz DE, Wilson BC, Zheng G. J. Am. Chem. Soc. 2012;134:16464. doi: 10.1021/ja305988f. [DOI] [PubMed] [Google Scholar]
- [24].Wang Y-H, Chen S-P, Liao A-H, Yang Y-C, Lee C-R, Wu C-H, Wu P-C, Liu T-M, Wang C-RC, Li P-C. Sci. Rep. 2014;4 doi: 10.1038/srep05685. [DOI] [PMC free article] [PubMed] [Google Scholar]
- [25].Leighton TG. The Acoustic Bubble. Elsevier; 1994. [Google Scholar]
- [26].Lapotko D. Opt. Express. 2009;17:2538. doi: 10.1364/oe.17.002538. [DOI] [PubMed] [Google Scholar]
- [27].Lukianova-Hleb E, Hu Y, Latterini L, Tarpani L, Lee S, Drezek RA, Hafner JH, Lapotko DO. ACS Nano. 2010;4:2109. doi: 10.1021/nn1000222. [DOI] [PMC free article] [PubMed] [Google Scholar]
- [28].Kim J-W, Galanzha EI, Shashkov EV, Moon H-M, Zharov VP. Nat. Nanotechnol. 2009;4:688. doi: 10.1038/nnano.2009.231. [DOI] [PMC free article] [PubMed] [Google Scholar]
- [29].Kotaidis V, Plech A. Appl. Phys. Lett. 2005;87:213102. [Google Scholar]
- [30].Kotaidis V, Dahmen C, von Plessen G, Springer F, Plech A. J. Chem. Phys. 2006;124:184702. doi: 10.1063/1.2187476. [DOI] [PubMed] [Google Scholar]
- [31].Zharov VP, Letfullin RR, Galitovskaya EN. J. Phys. Appl. Phys. 2005;38:2571. [Google Scholar]
- [32].Zharov VP, Galitovskaya EN, Johnson C, Kelly T. Lasers Surg. Med. 2005;37:219. doi: 10.1002/lsm.20223. [DOI] [PubMed] [Google Scholar]
- [33].Niidome T, Yamagata M, Okamoto Y, Akiyama Y, Takahashi H, Kawano T, Katayama Y, Niidome Y. J. Controlled Release. 2006;114:343. doi: 10.1016/j.jconrel.2006.06.017. [DOI] [PubMed] [Google Scholar]
- [34].Jain PK, Eustis S, El-Sayed MA. J. Phys. Chem. B. 2006;110:18243. doi: 10.1021/jp063879z. [DOI] [PubMed] [Google Scholar]
- [35].Ghosh SK, Pal T. Chem. Rev. 2007;107:4797. doi: 10.1021/cr0680282. [DOI] [PubMed] [Google Scholar]
- [36].Lajoinie G, Gelderblom E, Chlon C, Böhmer M, Steenbergen W, de Jong N, Manohar S, Versluis M. Nat. Commun. 2014;5 doi: 10.1038/ncomms4671. DOI 10.1038/ncomms4671. [DOI] [PubMed] [Google Scholar]
- [37].Lukianova-Hleb EY, Volkov AN, Wu X, Lapotko DO. Adv. Mater. 2013;25:772. doi: 10.1002/adma.201204083. [DOI] [PMC free article] [PubMed] [Google Scholar]
- [38].Lapotko DO, Lukianova E, Oraevsky AA. Lasers Surg. Med. 2006;38:631. doi: 10.1002/lsm.20359. [DOI] [PubMed] [Google Scholar]
- [39].Egerev S, Ermilov S, Ovchinnikov O, Fokin A, Guzatov D, Klimov V, Kanavin A, Oraevsky A. Appl. Opt. 2009;48:C38. doi: 10.1364/ao.48.000c38. [DOI] [PubMed] [Google Scholar]
- [40].Chen Y-S, Frey W, Aglyamov S, Emelianov S. Small. 2012;8:47. doi: 10.1002/smll.201101140. [DOI] [PMC free article] [PubMed] [Google Scholar]
- [41].Ju H, Roy RA, Murray TW. Biomed. Opt. Express. 2013;4:66. doi: 10.1364/BOE.4.000066. [DOI] [PMC free article] [PubMed] [Google Scholar]
- [42].Pitsillides CM, Joe EK, Wei X, Anderson RR, Lin CP. Biophys. J. 2003;84:4023. doi: 10.1016/S0006-3495(03)75128-5. [DOI] [PMC free article] [PubMed] [Google Scholar]
- [43].Hleb EY, Hafner JH, Myers JN, Hanna EY, Rostro BC, Zhdanok SA, Lapotko DO. Nanomed. 2008;3:647. doi: 10.2217/17435889.3.5.647. [DOI] [PubMed] [Google Scholar]
- [44].Link S, Burda C, Mohamed MB, Nikoobakht B, El-Sayed MA. J. Phys. Chem. A. 1999;103:1165. [Google Scholar]
- [45].Chen Y-S, Frey W, Kim S, Homan K, Kruizinga P, Sokolov K, Emelianov S. Opt. Express. 2010;18:8867. doi: 10.1364/OE.18.008867. [DOI] [PMC free article] [PubMed] [Google Scholar]
- [46].Zeng N, Murphy AB. Nanotechnology. 2009;20:375702. doi: 10.1088/0957-4484/20/37/375702. [DOI] [PubMed] [Google Scholar]
- [47].Sassaroli E, Li KCP, O’Neill BE. Phys. Med. Biol. 2009;54:5541. doi: 10.1088/0031-9155/54/18/013. [DOI] [PubMed] [Google Scholar]
- [48].Pustovalov VK. Chem. Phys. 2005;308:103. [Google Scholar]
- [49].Ekici O, Harrison RK, Durr NJ, Eversole DS, Lee M, Ben-Yakar A. J. Phys. Appl. Phys. 2008;41:185501. doi: 10.1088/0022-3727/41/18/185501. [DOI] [PMC free article] [PubMed] [Google Scholar]
- [50].Plech A, Kotaidis V, Grésillon S, Dahmen C, von Plessen G. Phys. Rev. B. 2004;70:195423. [Google Scholar]
- [51].Dou Y, Zhigilei LV, Winograd N, Garrison BJ. J. Phys. Chem. A. 2001;105:2748. [Google Scholar]
- [52].Klibanov AL. Invest. Radiol. 2006;41:354. doi: 10.1097/01.rli.0000199292.88189.0f. [DOI] [PubMed] [Google Scholar]
- [53].de Gennes PG. Adv. Colloid Interface Sci. 1987;27:189. [Google Scholar]
- [54].Brennen CE. Fundamentals of Multiphase Flow. Cambridge University Press; Cambridge, United Kingdom: 2005. [Google Scholar]
- [55].C. E. Brennen, Cavitation and Bubble Dynamics. Oxford University Press; New York: 1995. [Google Scholar]
- [56].Plesset MS, Prosperetti A. Annu. Rev. Fluid Mech. 1977;9:145. [Google Scholar]
- [57].Overvelde M, Garbin V, Sijl J, Dollet B, de Jong N, Lohse D, Versluis M. Ultrasound Med. Biol. 2010;36:2080. doi: 10.1016/j.ultrasmedbio.2010.08.015. [DOI] [PubMed] [Google Scholar]
- [58].Gorce J, Arditi M, Schneider M. Invest. Radiol. 2000;35:661. doi: 10.1097/00004424-200011000-00003. [DOI] [PubMed] [Google Scholar]
- [59].Chapman CS, Lazenby JC. Ultrasound Imaging System Employing Phase Inversion Subtraction to Enhance the Image. 1997 US5632277 A. [Google Scholar]
- [60].Guo Z, Li L, Wang LV. Med. Phys. 2009;36:4084. doi: 10.1118/1.3187231. [DOI] [PMC free article] [PubMed] [Google Scholar]
- [61].Firouzi K, Stride E, Saffari N. J. Acoust. Soc. Am. 2013;133:3853. doi: 10.1121/1.4802939. [DOI] [PubMed] [Google Scholar]
- [62].Sassaroli E, Li KCP, O’Neill BE. J. Acoust. Soc. Am. 2009;126:2802. doi: 10.1121/1.3238262. [DOI] [PubMed] [Google Scholar]
- [63].Chomas JE, Dayton P, May D, Ferrara K. J. Biomed. Opt. 2001;6:141. doi: 10.1117/1.1352752. [DOI] [PubMed] [Google Scholar]
- [64].Chomas JE, Dayton PA, May D, Allen J, Klibanov A, Ferrara K. Appl. Phys. Lett. 2000;77:1056. [Google Scholar]
- [65].Chomas JE, Dayton P, Allen J, Morgan K, Ferrara KW. IEEE Trans. Ultrason. Ferroelectr. Freq. Control. 2001;48:232. doi: 10.1109/58.896136. [DOI] [PubMed] [Google Scholar]
- [66].Chakravarty P, Qian W, El-Sayed MA, Prausnitz MR. Nat. Nanotechnol. 2010;5:607. doi: 10.1038/nnano.2010.126. [DOI] [PMC free article] [PubMed] [Google Scholar]
- [67].Fan Z, Liu H, Mayer M, Deng CX. Proc. Natl. Acad. Sci. U. S. A. 2012;109:1. doi: 10.1073/pnas.1208198109. [DOI] [PMC free article] [PubMed] [Google Scholar]
- [68].Zharov V, Malinsky T, Alekhnovich V. Rev. Sci. Instrum. 2003;74:779. [Google Scholar]
- [69].van Wamel A, Kooiman K, Harteveld M, Emmer M, ten Cate FJ, Versluis M, de Jong N. J. Control. Release Off. J. Control. Release Soc. 2006;112:149. doi: 10.1016/j.jconrel.2006.02.007. [DOI] [PubMed] [Google Scholar]
- [70].Hynynen K, McDannold N, Sheikov NA, Jolesz FA, Vykhodtseva N. NeuroImage. 2005;24:12. doi: 10.1016/j.neuroimage.2004.06.046. [DOI] [PubMed] [Google Scholar]
- [71].Dayton PA, Allen JS, Ferrara KW. J. Acoust. Soc. Am. 2002;112:2183. doi: 10.1121/1.1509428. [DOI] [PubMed] [Google Scholar]
- [72].Kaufmann BA, Sanders JM, Davis C, Xie A, Aldred P, Sarembock IJ, Lindner JR. Circulation. 2007;116:276. doi: 10.1161/CIRCULATIONAHA.106.684738. [DOI] [PubMed] [Google Scholar]
- [73].Prentice P, Cuschieri A, Dholakia K, Prausnitz M, Campbell P. Nat. Phys. 2005;1:107. [Google Scholar]
- [74].Sadauskas E, Wallin H, Stoltenberg M, Vogel U, Doering P, Larsen A, Danscher G. Part. Fibre Toxicol. 2007;4:10. doi: 10.1186/1743-8977-4-10. [DOI] [PMC free article] [PubMed] [Google Scholar]
- [75].Longmire M, Choyke PL, Kobayashi H. Nanomed. 2008;3:703. doi: 10.2217/17435889.3.5.703. [DOI] [PMC free article] [PubMed] [Google Scholar]
- [76].Kindberg GM, Tolleshaug H, Roos N, Skotland T. Cell Tissue Res. 2003;312:49. doi: 10.1007/s00441-003-0698-0. [DOI] [PubMed] [Google Scholar]
- [77].Kass M, Witkin A, Terzopoulos D. Int. J. Comput. Vis. 1988;1:321. [Google Scholar]
Associated Data
This section collects any data citations, data availability statements, or supplementary materials included in this article.