

Abstract
Background
Data on large scale community-level interventions on fruit and vegetable consumption targeting minority communities are lacking. This study examined whether a multicommunity intervention decreased disparities in fruit and vegetable consumption.
Materials and Methods
The Racial and Ethnic Approaches to Community Health (REACH) 2010 program was conducted among 16 black communities. Five-year trends (2001–2006) in self-reported fruit and vegetable consumption among the target population were compared with trends among white and black populations in 14 states where communities were located.
Results
The geometric mean of combined fruit and vegetable consumption in the REACH communities increased 7.4 % (P0.001) but did not change among white and black populations in comparison states (P0.05). Increased consumption in REACH communities was higher in the lower quintiles of consumptions. The disparity in fruits and vegetables consumption between comparison white population and blacks in REACH communities decreased by 33 %—from 0.66 to 0.44 times per day. The target population of 1.2 million people consumed fruits and vegetables about 21.9 million additional times per year as a result of the REACH program.
Conclusion
This large community-based participatory intervention successfully reduced isparities in fruit and vegetable consumption between comparison white population and 16 disadvantaged black communities.
Keywords: Community intervention, Blacks, Fruits, Vegetables, Health disparities
Introduction
Lower consumption of fruits and vegetables is associated with the risk of many chronic diseases, including hypertension, heart disease, stroke, diabetes, and some cancers [1]. Consumption of fruits and vegetables is significantly lower among blacks than whites [2–4], and the disparity persists over three decades [3]. Although focused interventions have been shown to increase fruit and vegetable consumption in the short term (e.g., <1 year) at the local level [5, 6], the long-term effectiveness of broader-based interventions has not been determined. Data on large scale community-level interventions targeting minority communities outside a controlled research setting are lacking.
The Racial and Ethnic Approaches to Community Health (REACH) 2010 project was an effort of the US Centers for Disease Control and Prevention (CDC) to eliminate racial and ethnic health disparities in disadvantaged communities [7].
Previous studies have shown that REACH 2010 interventions targeting cardiovascular risk factors in 16 black communities, conducted from 2002 through 2006, increased physical activity and cholesterol screening in the target populations and reduced disparities with respect to the overall US population [8, 9]. The purpose of this study was to examine whether REACH 2010 interventions also increased fruit and vegetable consumption among blacks in these 16 disadvantaged communities.
Methods
In 1999, CDC launched the REACH 2010 program to help the communities eliminate the health disparities in 42 minority communities [7]. Each REACH community targeted at least one racial/ethnic group—blacks, Hispanics, Asians/Pacific Islanders, and American Indians/Alaska Natives—and focused on one or more of the following health priority areas: cardiovascular disease (CVD), diabetes, breast and cervical cancer screening, infant mortality, immunizations, and HIV/AIDS. Sixteen of the 42 REACH 2010 communities chose to focus their efforts on CVD among blacks. These 16 communities list in the Acknowledgments are the subject of the current study.
REACH 2010 Interventions
Local strategies varied according to local needs; however, interventions in all communities followed a logic model that included capacity building, targeted action, and community and system change [8, 10]. Community-based coalitions were formed, which included community-based organizations, local or state health department, universities, and organizations or groups with primary missions unrelated to health such as faith-based groups, YMCA, volunteer groups, or groups focused on senior citizens. Various health education and promotion programs, community-wide 5-A-Day campaigns [11], and social marketing interventions were launched. One key strategy was creating change among “change agents”, i.e., changing the knowledge, attitudes, beliefs, and behaviors of influential people or groups with the goal of spreading similar changes throughout a community [12]. Change agents included community health advocates, community advisors, lay health workers, ministers, retailers, supermarket and restaurant owners or managers, policy makers, and legislators. Lack of healthy food options and “food deserts” was identified in these disadvantaged communities [13, 14]. Community coalitions advocated environmental and policy changes to encourage the retailers to sell healthy foods in disadvantaged areas [13]. Neighborhood farmers’ markets, mini-markets, produce stands, and community gardens were set up to increase access to and affordability of produce, including fruits and vegetables [15, 16].
Data Sources
REACH 2010 Risk Factor Survey
To evaluate REACH 2010 interventions, CDC conducted annual Risk Factor Surveys in each of the five intervention years: 2001–2002, 2002–2003, 2003–2004, 2004–2005, and 2006 [17]. Of the 16 communities included in our study, five did not conduct the first-year survey (2001–2002) because they were not funded until the second year and one did not conduct the fifth-year survey (2006) because of administrative difficulties. The 16 communities were located in 14 states (see Acknowledgements). Surveys were conducted by telephone, with sampling frame matched to the geography of the intervention area. In each community, a sample of eligible households was drawn and an average of 900 (1000 for the first year) black residents 18 years or older were interviewed. Among households contacted, an average 71 % cooperated with the screening interview to determine the geographic, racial/ethnic, and age eligibility of the household and its members. Among eligible household members, the interview completion rate was 57 %.
A uniform questionnaire was used in all communities and in all survey years. Consumption of fruits and vegetables was assessed by six questions. Interviewers began with the statement: “These next questions are about the foods you usually eat or drink. Please tell me how often you eat or drink each one, for example, twice a week, three times a month, and so forth.” Respondents were then asked the questions (1) How often do you drink fruit juices such as orange, grapefruit, or tomato? (2) Not counting juice, how often do you eat fruit? (3) How often do you eat green salad? (4) How often do you eat potatoes not including French fries, fried potatoes, or potato chips? (5) How often do you eat carrots? (6) Not counting carrots, potatoes, or salad, how many servings of vegetables do you usually eat?
The study was approved by the Office of Management and Budget (OMB 0920–0502) and the Institutional Review Board of the Centers for Disease Control and Prevention (#3112).
Behavioral Risk Factor Surveillance System
Data from the REACH 2010 Risk Factor Survey were compared with data from 14 states where the communities were located in the Behavioral Risk Factor Surveillance System (BRFSS) [18]. Questions about fruit and vegetable consumption are identical to those used in the REACH Risk Factor Survey. BRFSS data were available for 2000, 2002, 2003, 2005, and 2007. During 2000–2007, the BRFSS’s median screening completion rate for known households ranged from 63 to 73 %; the interview completion rate for selected respondents ranged from 75 to 81 %.
Data Analysis
We calculated the consumption in times per day for fruit juice, fruits, and vegetables from the six questions. People (0.24 % of total sample) who did not answer all six questions were excluded from the analysis. The final study samples were 7984 respondents for 2001–2002, 11,536 for 2002–2003, 11,594 for 2003–2004, 11,772 for 2004–2005, and 10,584 for 2006. All measures of fruit and vegetable consumption were age and sex standardized to the population distribution in the 2000 US Census for both REACH 2010 and BRFSS data.
Temporal Trends, Dichotomized Data
Consistent with the previous studies, dietary recommendations, and goals [11, 19, 20], we dichotomized fruit and vegetable consumption to examine temporal change in the percentage of people who reported consuming fruit two or more times per day, vegetables three or more times per day, and combined fruits and vegetables five or more times per day. Fruit juice was considered part of total fruit consumption, consistent with the approach used in the previous studies [2, 20, 21].
Temporal Trends, Geometric Mean
Because dichotomizing a continuous variable has many drawbacks [22], we also analyzed fruit and vegetable consumption as continuous variables. The frequency of daily consumption was skewed, so we calculated the geometric mean, using natural log transformation to normalize the distribution. To avoid taking the logarithm of 0, we added 0.01 to each valid value before transformation. Values were back transformed to original units for ease of interpretation.
For analysis with continuous variables, we did not include fruit juice as part of fruit consumption. We did this for two reasons. First, the survey question did not specifically refer to 100 % fruit juice, so respondents might have included fruit-flavored drinks or other fruit drinks with added sugar or artificial sweetener as fruit juice consumption. Second, the Dietary Guidelines for Americans, 2010, recommended consumption of fruits rather than fruit juice for the majority of a person’s total daily fruit consumption to ensure adequate dietary fiber [1].
Testing Statistical Significance of Trends in Geometric Means
We performed linear regression analyses on individual-level data with log transformation of the continuous dependent variable (consumption) to test the statistical significance of temporal trends, adjusting for age and sex. We obtained the regression coefficient (β) for the time variable (year) and calculated the percentage change in the average consumption during 5 years as 100*(e5β- 1) [23].
Trend by Quintile of Consumption
We also calculated the age- and sex-standardized quintile of consumption distributions for each year and then calculated the five-year temporal trend (i.e., percentage change) for each quintile by regression analysis (as described above). The purpose of this analysis was to determine whether changes in fruit and vegetable consumption were higher at either the upper or lower end of the consumption distribution.
Effect of Trends in Consumption on Disparities
As described earlier, the survey years for REACH 2010 and the BRFSS overlapped but did not match exactly. Based on available data on the age- and sex-standardized geometric mean of fruit and vegetable consumption during the period 2000 through 2007, we used linear regression models to estimate the expected geometric mean at year 2001–2002, 2002–2003, 2003–3004, 2004–2005, and 2006 for REACH 2010 and BRFSS, respectively. We defined disparity between the overall US population and blacks in REACH 2010 communities as the absolute difference between the geometric means of fruit and vegetable consumption at the same year. A positive value indicated a disparity, i.e., higher consumption in the comparison population than in the REACH communities. Linear regression was used to calculate the annual percent change in disparity.
Estimated Population Effect
Among the 16 black REACH communities, we estimated the annual population effect resulting from the increase in fruit and vegetable consumption as follows: (average additional times fruits and vegetables were consumed per person per day) × (total estimated adult population of the 16 communities) × (365 days/year). The average additional times of consumption was calculated as the slope (β coefficient) of the geometric mean in the linear regression model.
There was no significant interaction between sex and year. Analyses for this report were conducted in 2013 with SUDAAN software (Version 11, Research Triangle Institute, NC) to account for the complex sampling designs in the REACH 2010 and BRFSS surveys.
Results
Baseline Characteristics
Blacks in REACH communities had similar age distribution as the white population, but were in general older than the black population in the 14 states where REACH communities were located (Table 1). The prevalence of obesity among blacks in either REACH communities or the 14 states was higher than the white population. Educational attainment and annual family income were markedly lower among blacks in REACH communities than the white population and to a lesser extent lower than the black population in the comparison states, illustrating that these 16 REACH communities were disadvantaged black communities.
Table 1.
Characteristics of adults in 16 black REACH 2010 communities, 2001–2002, and in white and black populations in 14 comparison states, 2000 and 2002a
| Characteristic |
|
14 Comparison states |
||||
|---|---|---|---|---|---|---|
| REACH 2010 black communities |
Whites |
Blacks |
||||
| % | 95 % CI | % | 95 % CI | % | 95 % CI | |
| Age group (year) | ||||||
| 18–34 | 30.2 | 28.7–31.8 | 30.3 | 29.7–30.8 | 36.3 | 35.0–37.7 |
| 35–44 | 21.1 | 19.8–22.5 | 21.0 | 20.6–21.5 | 22.2 | 21.1–23.3 |
| 45–54 | 18.2 | 17.1–19.4 | 18.5 | 18.1–18.9 | 18.1 | 17.1–19.2 |
| 55–64 | 12.3 | 11.4–13.2 | 12.6 | 12.3–13.0 | 10.9 | 10.0–11.8 |
| ≥65 | 18.1 | 16.9–19.4 | 17.6 | 17.2–18.0 | 12.5 | 11.6–13.5 |
| Sex | ||||||
| Male | 40.0 | 38.4–41.6 | 48.4 | 47.9–49.0 | 44.3 | 42.9–45.7 |
| Female | 60.0 | 58.4–61.6 | 51.6 | 51.0–52.1 | 55.7 | 54.3–57.1 |
| Education level | ||||||
| Less than high school | 20.3 | 19.1–21.6 | 13.3 | 12.9–13.8 | 17.6 | 16.6–18.8 |
| High school graduate | 36.1 | 34.5–37.6 | 29.0 | 28.6–29.5 | 35.3 | 34.0–36.6 |
| Some college | 26.5 | 25.1–28.0 | 28.1 | 27.6–28.6 | 28.7 | 27.4–30.0 |
| College graduate | 17.1 | 15.8–18.5 | 29.5 | 29.1–30.0 | 18.4 | 17.4–19.5 |
| Annual family income | ||||||
| <15,000 | 19.1 | 17.8–20.3 | 9.6 | 9.2–10.0 | 16.3 | 15.3–17.3 |
| 15,000<25,000 | 27.7 | 26.4–29.1 | 14.1 | 13.7–14.5 | 22.3 | 21.2–23.5 |
| 25,000<50,000 | 31.1 | 29.6–32.6 | 27.8 | 27.3–28.3 | 29.1 | 27.9–30.4 |
| ≥50,000 | 13.3 | 12.2–14.5 | 36.0 | 35.5–36.5 | 19.0 | 17.9–20.2 |
| Unknown | 8.8 | 8.0–9.8 | 12.6 | 12.2–12.9 | 13.3 | 12.4–14.3 |
| Weight categories | ||||||
| Normal | 32.5 | 30.9–34.1 | 42.5 | 42.0–43.1 | 31.4 | 30.1–32.7 |
| Overweight | 34.8 | 33.2–36.4 | 37.2 | 36.7–37.8 | 37.1 | 35.8–38.6 |
| Obese | 32.7 | 31.2–34.3 | 20.2 | 19.8–20.7 | 31.5 | 30.2–32.8 |
Abbreviation: REACH Racial and Ethnic Approaches to Community Health; CI confidence interval
Data for REACH populations are from the REACH 2010 Risk Factor Survey. Data for the comparison states are from the Behavioral Risk Factor Surveillance System
Temporal Trends, Dichotomized Data
A small decline was found in the age- and sex-standardized prevalence of daily consumption of two or more fruits (including fruit juice) in 5 years among blacks in REACH 2010 communities (−2.2 percentage points), the comparison white population (−1.2 percentage points), and black population (−0.2 percentage points). A slight increase in the percentage of people who met the vegetable target (three or more per day) was observed in all three of these populations (+2.8, −1.1, and +0.7 percentage points, respectively). The percentage of people who consumed fruits and vegetables five or more times per day changed little (range −0.3 to +1.6 percentage points) in all three populations.
Temporal Trends, Geometric Mean
Fruit juice consumption was higher among blacks in REACH 2010 communities than in the two comparison populations (Fig. 1a); the geometric mean decreased in all three populations. Level of fruit consumption (excluding fruit juice) in REACH communities was between the two comparison groups (Fig. 1b); there was an upward trend in the geometric mean in all three populations.
Fig. 1.

Trends of geometric means of daily fruit and vegetable consumption among blacks in REACH 2010 communities and among the white and black populations in the 14 states where the REACH communities were located. a Consumption of fruit juice, b consumption of fruits, c consumption of vegetables, and d consumption of combined fruits and vegetables. Geometric means were age- and sex-standardized to the population distribution in the 2000 US Census
Vegetable consumption was lower among blacks in REACH communities than in the comparison populations in the early 2000s (Fig. 1c). However, it increased in REACH communities but not in the comparison populations. A similar pattern was seen for combined fruit and vegetable consumption (Fig. 1d).
Testing Statistical Significance of Trends in Geometric Means
The 5-year decrease in fruit juice consumption ranged from −14.3 % in REACH 2010 communities to −25.5 % in comparison white population (P<0.001 for β coefficients) (Table 2). Daily fruit consumption (excluding fruit juice) increased a similar amount in all three populations (range + 6.8 % to +10.0 %; all P<0.01). Vegetable consumption increased in REACH communities (+7.9 %; P<0.001), but not in whites (−1.0 %; P=0.059) and blacks (−2.6 %; P=0.136) in the comparison states. Combined fruit and vegetable consumption increased in REACH communities (+7.4 %; P<0.001); little change was observed in the comparison white (+0.6 %; P=0.247) and black population (+0.4 %; P=0.784).
Table 2.
Change in average daily fruit juice, fruit, and vegetable consumption (times/day) over 5 years in 16 black REACH 2010 communities, and in white and black populations in 14 comparison statesa
| Consumption item |
|
14 Comparison states |
||||||||||
|---|---|---|---|---|---|---|---|---|---|---|---|---|
| REACH 2010 black communities |
Whites |
Blacks |
||||||||||
| β b | SE | p value | % changec | β | SE | p value | % change | β | SE | p value | % change | |
| Fruit juice | −0.031 | 0.005 | <0.001 | −14.3 | −0.059 | 0.002 | <0.001 | −25.5 | −0.046 | 0.006 | <0.001 | −20.4 |
| Fruits | 0.015 | 0.005 | 0.006 | +7.7 | 0.013 | 0.002 | <0.001 | +6.8 | 0.019 | 0.005 | <0.001 | +10.0 |
| Vegetables | 0.015 | 0.003 | <0.001 | +7.9 | −0.002 | 0.001 | 0.059 | −1.0 | −0.005 | 0.003 | 0.136 | −2.6 |
| Fruits and vegetables | 0.014 | 0.003 | <0.001 | +7.4 | 0.001 | 0.001 | 0.247 | +0.6 | 0.001 | 0.003 | 0.784 | +0.4 |
Abbreviation: REACH Racial and ethnic approaches to community health
Data for REACH populations are from the REACH 2010 Risk Factor Survey. Data for comparison states are from the Behavioral Risk Factor Surveillance System
Linear regression coefficient (β) for the time variable (year)
Estimated percentage change in average consumption during a 5-year period as 100*(e5b- 1)
Trend by Quintile of Consumption
To study whether overall increase in the consumptions of fruits and vegetables among REACH communities resulted from increased consumption by people at the lower or higher consumption levels, we examined trends by quintile (Fig. 2). During 2001–2006, combined fruit and vegetable consumptions increased 21 % in REACH communities among those who ate the fewest number of vegetables (lowest quintile), but increased only 4 % among those in the highest quintile. In contrast, among white and black population in the 14 comparison states, decreasing consumption was observed in the lower quintiles. When measured in absolute terms, combined fruit and vegetable consumptions among the lowest (first and second) quintiles increased in REACH communities (+0.12 and +0.20 times/day, respectively), whereas consumption in the comparison populations decreased (ranged −0.01 to −0.08 times/day) (data not shown).
Fig. 2.
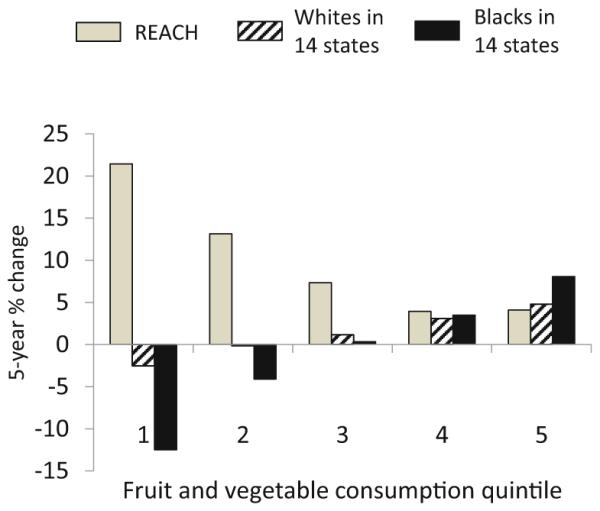
Average 5-year percentage change in consumption of combined fruits and vegetables by consumption quintile among blacks in REACH 2010 communities and among white and black populations in the 14 states where the REACH communities were located. The value for each quintile was age- and sex-standardized to the population distribution in the 2000 US Census
Effect of Trends in Consumption on Disparities
The difference in the geometric mean of fruit consumption between whites in the 14 states and blacks in REACH communities was +0.08 times/day in 2001–2002 (Fig. 1b). This disparity decreased to +0.03 times/day in 2006. The large disparity in vegetable consumption decreased sharply, from +0.51 f="times per day to +0.33 times per day (Fig. 1c)—a 35 % decrease in disparity for the study period and an average annual decrease of 9 %, according to regression model estimates. Likewise, the disparity in the geometric mean of combined fruit and vegetable consumption decreased sharply—a 33 % decrease (from +0.66 times per day to 0.44 times per day) with an average annual decrease of 8 % (Fig. 1d).
Estimated Population Effect
We estimated from the linear regression models that the age- and sex-standardized geometric mean of vegetable consumption in the 16 black REACH communities increased an average of 0.04 times per person per day each year. Consumption of fruits and vegetables combined increased an average of 0.05 times per person per day. We used an estimated total target population of about 1.2 million people in the 16 black REACH communities to estimate that the REACH 2010 intervention resulted in about 17.5 million additional times that vegetables were consumed per year:
(1.2 million people) × (0:04 increased times vegetables consumedper person per day) × (365 days per year) = 17:5 million additional times vegetables consumed per year
We also estimated 21.9 million additional times that fruits and vegetables were consumed per year:
(1.2 million people) × (0.05 increased times fruits and vegetables consumed per person per day) × (365 days per year) = 21.9 million additional times fruits and vegetables consumed per year
Discussion
During the 5-year REACH 2010 program, daily consumption of fruits, vegetables, and combined fruits and vegetables increased among 16 black communities. Consumption of fruits among white and black populations in the 14 comparison states also increased, but vegetable consumption decreased and combined fruit and vegetable consumption did not change. Disparities in fruit and vegetable consumptions between white population in the comparison states and blacks in REACH communities decreased substantially.
The increase in the average daily frequency of fruit and vegetable consumption at the individual level in the REACH communities was modest—just 0.05 times per day. However, because the REACH 2010 program was implemented simultaneously in multiple communities, the amount of change at the population level was substantial. We estimated that black residents in 16 REACH communities consumed fruits and vegetables 21.9 million additional times per year. These findings are consistent with the theory that a small improvement in a large population can make a bigger impact in public health than a larger improvement in a small portion of the population [24]. When considered in conjunction with the previous studies that have documented improvements in cholesterol screening and physical activity in some of the same REACH communities [8, 9], the current study provides evidence that a multi-component community and system change intervention can promote broad-based improvements in multiple health behaviors simultaneously, the health benefits of which could be additive. This finding is consistent with the view that interventions that might have small or moderate effects when assessed in isolation may not be fully appreciated until they are considered as one component of an overall strategy [24].
The increase in fruit and vegetable consumption among REACH communities was larger at the lower end of the distribution, indicating that positive changes occurred primarily among people with lower levels of consumption. This result indicates that REACH 2010 program has reached the most disadvantaged segments of the communities.
REACH 2010 program emphasized on ensuring that health improvements could long-lasting and community activities and programs are self-sustaining [16]. Building capacity by forming a wide-mix of community-based coalition was the first step of program [10]. Successful collaborations created cross-sector partnerships and engaged leaders from different sectors, including “non-traditional” partners. Establishing a collaborative infrastructure is important to the long-term success of a community health effort. The community-based intervention worked across a socioecological model to include changes in policy, community environments, and institutions which are more effective and sustainable than those focused only on personal level change. Environmental change made healthy eating the easier choice and a behavior norm. Thus, healthy lifestyles are likely to sustain.
This study has several limitations. First, the data were based on respondent self-report, which might have led to underestimates or overestimates of fruit and vegetable consumption. We assume that any bias resulting from the methodological limitations did not change considerably across the study period. Second, the survey included only six questions on fruit and vegetable consumption. Estimates from this type of abbreviated questionnaire are likely to be lower than those from other methods of dietary assessment [25]. Finally, the REACH project did not use a uniform intervention protocol, but was sufficiently flexible to allow community choices based on available resources and local realities. It is difficult to assess the impact of a specific approach.
This study demonstrates the success of a large-scale intervention in reducing disparities in fruit and vegetable consumption between the US overall and a group of disadvantaged communities, outside a controlled research context. This success makes a case for working with communities to promote healthy behaviors in minority communities. We can reduce health disparities through a multifaceted community-based approach that includes building community partnerships, leveraging resources, creating sustainable and culturally tailored programs, and empowering individuals and communities.
Acknowledgments
Racial and Ethnic Approaches to Community Health (REACH) 2010 Risk Factor Survey Participating Communities:
African American Health Coalition, Portland, Oregon
California Black Health Network, San Diego, California
Charlotte Mecklenburg Hospital System, Charlotte, North Carolina
Chicago Department of Health, Chicago, Illinois
Community Health Councils of Los Angeles, Los Angeles, California
Community Health and Social Services, Detroit, Michigan
Fulton County Health Department, Atlanta, Georgia
Institute of Urban Family Health, New York, New York
Matthew Walker Comprehensive Health, Nashville, Tennessee
Medical University of South Carolina, Charleston and Georgetown Counties, South Carolina
Missouri Coalition for Primary Care, Kansas City, Missouri
National Black Women’s Health Imperative, New Orleans, Louisiana
New Hampshire Minority Health Coalition, Hillsborough County, New Hampshire
Seattle-King County Department of Public Health, Seattle, Washington
University of Illinois at Chicago, Chicago, Illinois
University of Nevada at Reno—College of Cooperative Extension, Southern Area at Las Vegas, Nevada
Footnotes
The findings and conclusions in this report are those of the authors and do not necessarily represent the official position of the Centers for Disease Control and Prevention.
Conflict of Interest Liao, Siegel, Zhou, Grimm, Njai, Kent, and Giles declare that they have no conflict of interest.
Informed Consent All procedures followed were in accordance with the ethical standards of the responsible committee on human experimentation (institutional and national) and with the Helsinki Declaration of 1975, as revised in 2000 (5). Informed consent was obtained from all respondents for being included in the study.
No animal studies were carried out by the authors for this article.
References
- 1.U.S. Department of Agriculture and U.S. Department of Health and Human Services . Dietary Guidelines for Americans. 7th. U.S. Government Printing Office; Washington, DC: 2010. [DOI] [PMC free article] [PubMed] [Google Scholar]
- 2.Serdula MK, Gillespie C, Kettel-Khan L, Farris R, Seymour J, Denny C. Trends in fruit and vegetable consumption among adults in the United States: Behavioral risk factor surveillance system, 1994–2000. Am J Public Health. 2004;94:1014–8. doi: 10.2105/ajph.94.6.1014. [DOI] [PMC free article] [PubMed] [Google Scholar]
- 3.Kant AK, Graubard BI, Kumanyika SK. Trends in black-white differentials in dietary intakes of U.S. adults, 1971–2002. Am J Prev Med. 2007;32:264–72. doi: 10.1016/j.amepre.2006.12.011. [DOI] [PMC free article] [PubMed] [Google Scholar]
- 4.Dubowitz T, Heron M, Bird CE, Lurie N, Finch BK, Basurto-Davila R, et al. Neighborhood socioeconomic status and fruit and vegetable intake among whites, blacks, and Mexican Americans in the United States. Am J Clin Nutr. 2008;87:1883–91. doi: 10.1093/ajcn/87.6.1883. [DOI] [PMC free article] [PubMed] [Google Scholar]
- 5.Pomerleau J, Lock K, Knai C, McKee M. Interventions designed to increase adult fruit and vegetable intake can be effective: a systematic review of the literature. J Nutr. 2005;135:2486–95. doi: 10.1093/jn/135.10.2486. [DOI] [PubMed] [Google Scholar]
- 6.Thomson CA, Ravia J. A systematic review of behavioral interventions to promote intake of fruit and vegetables. J Am Diet Assoc. 2011;111:1523–35. doi: 10.1016/j.jada.2011.07.013. [DOI] [PubMed] [Google Scholar]
- 7.Giles WH, Tucker P, Brown L, Crocker C, Jack N, Latimer A, et al. Racial and ethnic approaches to community health (REACH 2010): an overview. Ethn Dis. 2004;14:S5–8. [PubMed] [Google Scholar]
- 8.Liao Y, Tucker P, Siegel P, Liburd L, Giles WH. Decreasing disparity in cholesterol screening in minority communities—Findings from the racial and ethnic approaches to community health 2010. J Epidemiol Community Health. 2010;64:292–9. doi: 10.1136/jech.2008.084061. [DOI] [PubMed] [Google Scholar]
- 9.Miles IW, Kruger J, Liao Y, Carlson SA, Fulton JE. Walking increases among African American adults following a community-based physical activity intervention: Racial and Ethnic Approaches to Community Health, 2002–2005. J Health Disparities Research Practice. 2012;5:43–54. [Google Scholar]
- 10.Tucker P, Liao Y, Giles WH, Liburd L. The REACH 2010 logic model: an illustration of expected performance. Prev Chronic Dis. 2006;3(1):A21. http://www.cdc.gov/pcd/issues/2006/jan/05_0131.htm. Accessed 25 July 2014. [PMC free article] [PubMed] [Google Scholar]
- 11.Heimendinger J, Van Duyn MA, Chapelsky D, Foerster S, Stables G. The national 5 a day for better health program: a large-scale nutrition intervention. J Public Health Manag Pract. 1996;2:27–35. [PubMed] [Google Scholar]
- 12.Plescia M, Groblewski M, Chavis L. A lay health advisor program to promote community capacity and change among change agents. Health Promot Pract. 2008;9:434–9. doi: 10.1177/1524839906289670. [DOI] [PubMed] [Google Scholar]
- 13.Lewis LB, Galloway-Gilliam L, Flynn G, Nomachi J, Keener LC, Sloane DC. Transforming the urban food desert from the grassroots up: a model for community change. Fam Community Health. 2011;34:S92–101. doi: 10.1097/FCH.0b013e318202a87f. [DOI] [PubMed] [Google Scholar]
- 14.Sloane D, Nascimento L, Flynn G, Lewis L, Guinyard JJ, Galloway-Gilliam L, et al. Assessing resource environments to target prevention interventions in community chronic disease control. J Health Care Poor Underserved. 2006;17(Suppl 2):146–58. doi: 10.1353/hpu.2006.0094. [DOI] [PubMed] [Google Scholar]
- 15.Plescia M, Herrick H, Chavis L. Improving health behaviors in an African American community: the Charlotte Racial and Ethnic Approaches to Community Health project. Am J Public Health. 2008;98:1678–84. doi: 10.2105/AJPH.2007.125062. [DOI] [PMC free article] [PubMed] [Google Scholar]
- 16.Centers for Disease Control and Prevention . REACHing Across the Divide: Finding Solutions to Health Disparities. US Department of Health and Human Services, Centers for Disease Control and Prevention; Atlanta, GA: 2007. [Google Scholar]
- 17.Liao Y, Tucker P, Okoro CA, Giles WH, Mokdad AH, Harris VB, et al. REACH 2010 Surveillance for Health Status in Minority Communities—United States, 2001–2002. MMWR Surveill Summ. 2004;53(6):1–36. [PubMed] [Google Scholar]
- 18.Mokdad AH, Stroup DF, Giles WH. Behavioral risk factor surveillance team. public health surveillance for behavioral risk factors in a changing environment. Recommendations from the behavioral risk factor surveillance team. MMWR Recomm Rep. 2003;52(RR-9):1–12. [PubMed] [Google Scholar]
- 19.U.S. Department of Health and Human Services . Healthy People 2010. 2nd U.S. Government Printing Office; Washington, DC: 2000. [Google Scholar]
- 20.Centers for Disease Contol and Prevention State-specific trends in fruit and vegetable consumption among adults — United States, 2000–2009. MMWR Morb Mortal Wkly Rep. 2010;59(35):1125–30. [PubMed] [Google Scholar]
- 21.Blanck HM, Gillespie C, Kimmons JE, Seymour JD, Serdula MK. Trends in fruit and vegetable consumption among U.S. men and women, 1994–2005. Prev Chronic Dis. 2008;5(2):A35. http://www.cdc.gov/pcd/issues/2008/apr/07_0049.htm. Accessed 25 July 2014. [PMC free article] [PubMed] [Google Scholar]
- 22.Turner EL, Dobson JE, Pocock SJ. Categorisation of continuous risk factors in epidemiological publications: a survey of current practice. Epidemiol Perspect Innov. 2010;7:9. doi: 10.1186/1742-5573-7-9. [DOI] [PMC free article] [PubMed] [Google Scholar]
- 23.Vittinghoff E, Glidden DV, Shiboski SC, McCulloch CE. Regression Methods in Biostatistics: Linear, Logistic, Survival, and Repeated Measures Models. Nashville: Springer Science; 2005 [Google Scholar]
- 24.Rose G. Sick individuals and sick populations. Int J Epidemiol. 2001;30:427–32. doi: 10.1093/ije/30.3.427. discussion 433–4. [DOI] [PubMed] [Google Scholar]
- 25.Thompson F, Subar A. Dietary assessment methodology. In: Coulston A, Rock C, Monsen E, editors. Nutrition in the prevention and treatment of disease. Academic; San Diego, CA: 2001. pp. 3–30. [Google Scholar]