

Abstract
Objective
The primary purpose of this study was to test a relatively efficient strategy for enhancing the capacity of juvenile drug courts (JDC) to reduce youth substance use and criminal behavior by incorporating components of evidence-based treatments into their existing services.
Method
Six JDCs were randomized to a condition in which therapists were trained to deliver contingency management in combination with family engagement strategies (CM-FAM) or to continue their usual services (US). Participants included 104 juvenile offenders with an average age of 15.4 years; 83% were male; and 57% were white, 40% African-American, and 3% biracial. Eighty-six percent of the youths met criteria for at least one substance use disorder, and co-occurring psychiatric diagnoses were highly prevalent. Biological and self-report measures of substance use and self-reported delinquency were assessed from baseline through 9 months post recruitment.
Results
CM-FAM was significantly more effective than US at reducing marijuana use, based on urine drug screens, and at reducing both crimes against persons and property offenses. Such favorable outcomes, however, were not observed for the self-report measure of substance use. Although some variation in outcomes was observed between courts, the outcomes were not moderated by demographic characteristics or co-occurring psychiatric disorders.
Conclusions
The findings suggest that JDC practices can be enhanced to improve outcomes for participating juvenile offenders. A vehicle for promoting such enhancements might pertain to the development and implementation of program certification standards that support the use of evidence-based interventions by JDCs. Such standards have been fundamental to the successful transport of evidence-based treatments of juvenile offenders.
Keywords: juvenile drug court, contingency management, substance abuse, adolescents
Juvenile drug courts (JDC) have proliferated in spite of mixed evidence of their effectiveness in treating substance abusing juvenile offenders. The spread of JDCs across more than 500 sites in the nation (Bureau of Justice Assistance Drug Court Clearing House, 2009) has been furthered by stakeholder concern for the well-established treatment needs of substance abusing youths in the juvenile justice system (Chassin, 2008), considerable federal support (“Record funding for drug court!!!,” 2009), and favorable outcomes in the adult drug court literature (General Accountability Office [GAO], 2005). Yet, results of JDC evaluations have been decidedly mixed. For example, while both Aos, Miller, and Drake (2006) and Shaffer (2006) reported a modest average effect size of .05 favoring JDC in their meta analyses, the range of variability was considerable.
In light of the national commitment to the establishment of JDCs and the fact that some courts are effective at reducing crime and substance use while others are not, research aiming to enhance the effectiveness of JDCs should be a priority. Several reviewers (e.g., Belenko & Logan, 2003; Chassin, 2008; Henggeler, 2007; Hills, Shufelt, & Cocozza, 2009) have suggested that the effectiveness of JDCs has been attenuated by their general difficulty in involving parents and caregivers in the treatment process and by a failure to adopt and integrate evidence-based substance abuse treatments. The importance of caregiver involvement has been established in the broader adolescent substance abuse treatment literature (Waldron & Turner, 2008) as well as in several studies of JDCs. In one clinical trial, for example, substance abusing juvenile offenders who received a family-based intervention in JDC had better substance use outcomes than JDC counterparts who received usual substance abuse treatment in the community (Henggeler et al., 2006). Within this same study, improved caregiver supervision was an important determinant of favorable outcomes in JDC (Schaeffer et al., 2010), and caregiver substance use was the key predictor of youth nonresponse to JDC interventions (Halliday-Boykins et al., 2010). Similarly, investigators (Salvatore, Henderson, Hiller, White, & Samuelson, 2010) observed that family involvement in JDC was associated with more favorable youth outcomes, but family members were present for only 50% of JDC status hearings. Thus, consistent with findings in the child mental health treatment literature (Dowell & Ogles, 2010), one promising avenue for improving outcomes pertains to increasing caregiver engagement in the JDC treatment process.
A second promising avenue for improving JDC outcomes pertains to the integration of evidence-based adolescent substance abuse treatment into JDC services. Contingency management (CM) is a viable choice in this regard for two primary reasons. First, CM and its variations have strong empirical support in the adult substance abuse literature (Higgins, Silverman, & Heil, 2008) and very promising outcomes in the adolescent substance abuse literature (Stanger & Budney, 2010); and CM has enhanced youth substance use outcomes in a JDC study (Henggeler et al., 2006). Second, due to its relative simplicity, low cost, and compatibility with current JDC practice (Rogers, 1995); CM is more likely amenable to adoption by JDC professionals than are other evidence-based treatments of adolescent substance abuse such as multisystemic therapy, multidimensional family therapy, and brief strategic family therapy. Indeed, Henggeler, Chapman et al., (2008) demonstrated widespread adoption of CM by public sector practitioners in substance abuse and mental health when provided appropriate training and support.
The primary purpose of this study, therefore, is to test a relatively efficient strategy for enhancing the performance (i.e., capacity to reduce youth substance use and criminal behavior) of JDCs by incorporating components of evidence-based treatments into their existing services. This strategy integrates the caregiver engagement interventions used within multisystemic therapy (MST; Henggeler, Schoenwald, Borduin, Rowland, & Cunningham, 2009), interventions that have been very effective at engaging caregivers of substance abusing youths in the juvenile justice system (e.g., Henggeler, Pickrel, Brondino, & Couch, 1996), with a CM protocol (Henggeler et al., in press) that is both clinically promising (Henggeler et al., 2006) and likely adoptable by JDC service providers (Henggeler, Chapman et al., 2008). We hypothesize that JDCs that receive training and support to implement the evidence-based family engagement and CM interventions will be more effective than counterparts providing usual JDC services at reducing the substance use and criminal behavior of the juvenile offenders enrolled in their respective courts. In addition, moderating analyses are conducted to determine whether the interventions are differentially effective for youths as a function of age, race, gender, or co-occurrence of psychiatric problems.
Method
Design and Procedures
A randomized design with intent-to-treat analyses was used to evaluate the effectiveness of the CM-family engagement (CM-FAM) intervention for JDC-involved youths. The research team partnered with six JDCs and their respective substance abuse treatment provider agencies. Three of the JDCs were randomly selected to receive training and ongoing support to implement CM-FAM for an 18-month period, while the other three courts were randomized to deliver their usual treatment services (US). Of note, two JDC programs in the US condition were terminated due to a loss of funding -- one at 8 months following randomization and the other at 13 months post-randomization. In both cases, a replacement JDC was recruited for the US condition. Data from all courts were included in the analyses.
Youth outcomes were measured using a multimethod assessment battery. Self-report measures of youth substance use and delinquent behavior were administered at four time points: within 5 days of recruitment into the study (baseline) and at 3, 6, and 9 months post-recruitment. Research assistants administered the assessment battery to youths at the JDC site, in their homes, or in detention facilities for youths in juvenile justice custody. Biological (i.e., urine drug screens) measures of youth substance use were collected by JDC staff at each weekly court appearance and at random times throughout the week. In addition, a research assistant contacted youths and their primary caregivers monthly by phone to complete measures of therapist implementation of the CM-FAM intervention. Research assistants were not blind to intervention assignment during the assessment of youth outcomes. To compensate for their time, families were paid $25 for each quarterly interview and $10 for each monthly telephone assessment.
Participating JDCs
The National Association of Drug Court Professionals (1997) has specified several guidelines for the conduct of JDC programs with the aim of integrating judicial and therapeutic interventions to comprehensively address the needs of substance-abusing juvenile offenders. The participating JDCs all followed these guidelines. For example, each court was administered by a broad-based team of professionals that included a judge and representatives from other disciplines (e.g., treatment providers, probation officers, prosecution, and defense attorneys). The treatment provider in each court worked closely with youths and their families to target youth substance use and related behaviors. Each court required frequent urine drug testing of program participants and provided close oversight of each case through regular (often weekly) status hearings. Rewards or sanctions were dispensed quickly to youths based on the results of their drug screens and behavior in other key domains (e.g., family and school).
Youth Participants and Recruitment
Youths enter JDC primarily through referral from juvenile justice authorities, but also from family court and county departments of mental health and social services. Inclusion criteria for the study were (a) age of 12–17 years, (b) formal or informal probationary status, and (c) fluency in English. To enhance generalizability of the findings, no youths were excluded based on preexisting mental health, physical, or intellectual difficulties.
Figure 1 depicts the flow from youth referral through data analyses. All youths entering drug court as new referrals (October 2008 to March 2010, N = 115) were screened by research staff for study eligibility. Inclusion criteria were met by all youths. Following the screening, research staff met with the youths and families to describe the study and obtain informed consent and assent. One hundred and eleven families agreed to participate (97% recruitment rate). As depicted in Figure 1, seven families (six in the CM-FAM condition and one in the US condition) were lost to follow-up immediately after recruitment, but prior to any data collection. Thus, 104 families provided data, and all were included in the analyses. Recruitment procedures were approved by the institutional review board at the Medical University of South Carolina.
Figure 1.

Study Enrollment Flow Diagram
Intervention Conditions
As noted previously, all participating JDCs followed national guidelines for the conduct of drug court. The key distinction between intervention conditions pertained to whether the JDCs attempted to integrate CM-FAM into the substance abuse treatment component of drug court or delivered substance abuse treatment as usually provided for youths in the community. Youths in the CM-FAM condition received this intervention for 4 months on average.
CM-FAM
The CM portion of this intervention was based on our work implementing CM with substance abusing juvenile offenders (e.g., Henggeler et al., 2006) and training community-based practitioners (e.g., Henggeler, Chapman et al., 2008) in CM. As specified by Henggeler et al. (in press), the intervention includes the following components. (a) Validated assessment instruments and clinical interviews are used to determine whether the youth’s substance use is largely experimental in nature or reflects abuse or dependence. (b) If the substance use is problematic, the therapist introduces CM to the youth and caregivers and attempts to engage them in treatment. (c) The therapist conducts a functional analysis of the youth’s substance use in collaboration with the youth and caregivers. (d) Based on the results of the functional analysis, self-management planning and drug refusal skills training are implemented by the therapist in collaboration with the caregivers. (e) Concurrently, a contingency contract, described more extensively next, is developed by the youth and caregivers and provides desired rewards and privileges for negative drug and alcohol tests and disincentives (e.g., extra chores, reduced curfew) for positive drug and alcohol screens. Components “c” through “e” are implemented in a recursive process until continued abstinence is achieved. (f) Finally, the therapist collaborates with caregivers and youths to develop plans for sustaining abstinence after treatment ends.
The contingency contract used in CM-FAM follows a well-specified protocol. The therapist and family first generate a menu of rewards that can compete with the youth’s substance use. The therapist ensures the menu includes a balance between natural incentives that the caregiver can provide (e.g., access to cell phone, later curfew, a friend spending the night over) and items that can be purchased with gift cards (i.e., therapists had access to $150 per adolescent to use toward the purchase of gift cards from a list of 11 stores and restaurants that are national chains, and $135 per youth were provided on average throughout the study). From this reward menu, the youth and caregiver choose the youth’s “most valued privilege” (or MVP), which is almost always a natural incentive. Each remaining menu item is assigned a point value by the caregiver and therapist, with each point equivalent to approximately one dollar in value. Once the menu is finalized, a point-and-level system is implemented and the youth receives a starting balance of 50 points. Each week, the youth earns or loses access to the MVP depending on the results of the drug screens. During the first month, youths keep their points if they test negative, but lose 12 points for each week that they test positive. Regardless of the screen results, youths are not able to redeem their points during this initial 4-week period. From the fifth week on, however, negative screens result in youths being able to earn additional points and also to use their points to “purchase” items on the reward menu. The number of points youths can earn each week starts at 12 and increases to 24 after eight consecutive weeks of negative screens. When making a purchase, youths have the freedom to cash-in as many points as they would like from their available balance. Importantly, therapists are taught to have gift cards on-hand that are listed on a youth’s menu so they can be provided immediately at the time of purchase. If a youth tests positive from the fifth week on, he/she does not earn points and cannot cash in points until the next negative screen. As treatment progresses, emphasis shifts to using natural incentives provided by caregivers to sustain abstinence.
The family engagement portion of CM-FAM is based on engagement strategies used in MST (Henggeler et al., 2009) – strategies that have helped achieve high rates of treatment completion in MST clinical trials and in MST programs transported to community settings (Henggeler, 2011). The underlying assumption of these strategies, which are certainly not unique to MST, is that successful treatment best progresses when key family members are engaged and actively participating in the treatment process -- helping to define problems, setting goals, and implementing interventions to meet those goals. Key strategies in the context of JDC include focusing on youth and family strengths when conceptualizing interventions, collaborating in the development of treatment goals and specification of therapeutic interventions, maintaining a non-blaming stance, and incorporating core clinical skills such as empathy, reflective listening, flexibility, and reframing.
Usual JDC substance abuse treatment services
US substance abuse interventions were consistent with those provided in JDCs nationally, with service intensity varying over the course of participants’ JDC involvement. Initially, youths were generally required to attend adolescent group treatment 1–2 days a week. The groups focused on promoting abstinence, anger/stress management, conflict resolution, and decision-making skills. At several JDCs, youths concurrently participated in family group treatment for 1 day a week, with an emphasis on improving family communication. The theoretical orientations of the adolescent and family groups were cognitive-behavioral and system theory. The interventions were not manual driven, and selection of group material was often left to the therapist’s discretion. Youths were typically transitioned to less intensive treatment schedules (e.g., attendance at only two adolescent groups per month, periodic telephone check-ins with caregivers) 16–24 weeks after enrollment. The timing of this transition was determined by the JDC team and depended on the youth’s number of negative urine drug screens and behavior in other areas. The less intensive services were maintained until participants graduated from the JDC program. Treatment services were office-based with little community outreach.
Therapists
Therapists were employed by the community-based provider agencies with formal contracts to serve youths in the JDCs. Twenty-six therapists delivered CM-FAM at the sites randomized to the experimental intervention condition. Usual substance abuse services were provided by 25 therapists working at the comparison sites. Between-groups comparisons indicated that therapists in the two intervention conditions did not differ with regard to demographic characteristics or professional experience (all ps > .05). Thus, these characteristics are reported for the total sample. The mean age of therapists was 41.7 years (SD = 11.8 years), 76% were male, 61% were white, and 39% were African American. Professionally, 29% had bachelor’s degrees only, 69% had master’s degrees, and 2% had doctorate degrees. The practitioners had an average of 11 years of professional clinical experience, and 44% were certified addictions counselors.
Training, Sustaining, and Measuring CM-FAM Treatment Fidelity
Therapists in the CM-FAM condition received CM-FAM training and ongoing quality assurance support. An initial 1.5 day workshop focused on orienting clinicians, supervisors, and JDC stakeholders (i.e., judges, drug court coordinators, probation officers, prosecutors, defense attorneys) to program philosophy and intervention methods. In addition, quarterly half- or 1-day booster trainings were provided for therapists and supervisors in areas identified as presenting difficulties in adherence or achieving clinical outcomes. The clinical team at each CM-FAM intervention site also received brief telephone consultation from a doctoral-level expert approximately twice per month. These calls focused on promoting adherence to intervention principles, developing solutions to difficult clinical problems, and developing strategies for communicating treatment recommendations to the court.
A second manuscript from this study (McCart, Henggeler, Chapman, & Cunningham, 2011) describes the favorable effects of the CM-FAM condition on system-level outcomes in the JDCs including therapist implementation behavior, therapist and stakeholder (e.g., judges, prosecutors, defense attorneys) attitudes, and key aspects of JDC organizational functioning. Briefly, the measurement of CM-FAM implementation fidelity was based on monthly caregiver and youth ratings on revised versions of the CM-Therapist Adherence Measure (CM-TAM; Chapman, Sheidow, Henggeler, Halliday-Boykins, & Cunningham, 2008; Henggeler et al., 2006) and the Family Engagement-Therapist Adherence Measure (FAM-TAM; Henggeler et al., 2006). The 34-item CM-TAM used 4-point scales to assess therapists’ use of the two major components of CM: Cognitive behavioral interventions (19 items) such as functional analysis of substance use, self-management planning, and drug refusal skills training; and monitoring interventions (15 items) such as regular drug screening and development of the contingency contract. The 30-item FAM-TAM used 4-point scales to assess therapists’ use of family engagement strategies and included items such as, “The therapist communicated with us in a respectful way.” Cronbach’s coefficient alphas for these scales averaged .82 across respondents. As described more extensively by McCart et al. (2011), CM-FAM implementation by therapists in the CM-FAM condition increased over time at a level that deviated significantly from the US condition for use of the CM cognitive behavioral (based on youth and caregiver reports), CM monitoring (based on caregiver report only), and family engagement (based on youth and caregiver reports) interventions. These results support the fidelity of the CM-FAM implementation.
Youth Outcome Measures
Key outcomes pertained to youth substance use and delinquent behavior.
Substance use
Adolescent substance use was assessed through two well validated methods: youth biological indices and self-reports. Court staff administered instant urine drug screens to youths before each weekly court appearance and also at random times throughout the week generally following the Department of Health and Human Services (DHHS) Mandatory Guidelines for Federal Workplace Drug Testing Programs http://workplace.samhsa.gov. Minimally, all youths were screened for marijuana, amphetamine, and cocaine use. Following standard protocols for the JDC, youths with unexcused absences (e.g., runaway, did not show) were counted as having positive urine screens for marijuana. Likewise, youths with excused absences (e.g., a GED class) were counted as having negative drug screens. In light of the low base rate of positive drug screens for amphetamines (1.6% of screens) and cocaine (0.21% of screens), analyses of the 2,902 collected screens focused solely on marijuana use.
Self-reported substance use was examined using a variation of the Form 90 (Miller, 1991), which is an interview based on the time line follow back (TLFB) methodology of quantifying specific amounts of substances consumed by individuals during the previous 90 days. The current study focused on the number of reported days of marijuana use only, due to infrequent reports of use of other drugs (i.e., only 25% of youths reported using a substance other than marijuana across all measurement occasions). Research with adolescents indicates that the TLFB method is reliable (Waldron, Slesnick, Brody, Turner, & Peterson, 2001) and yields data that correspond with biological markers (Waldron et al., 2001) and collateral reports (Donohue et al., 2004) of youth substance use.
Delinquent activity
The 47-item Self-Report Delinquency Scale (SRD) from the National Youth Survey (Elliott, Ageton, Huizinga, Knowles, & Canter, 1983) was used to assess youth involvement in delinquent acts during the past 90 days. The SRD includes an overall general delinquency scale as well as subscales that pertain to person offenses (e.g., assault) and property offenses (e.g., vandalism). The SRD is regarded as one of the best validated of the self-report delinquency measures, with support for good test-retest reliability and multiple forms of validity (Thornberry & Krohn, 2000).
Data Analytic Approach for Youth Outcome Measures
Analyses were performed using mixed-effects regression models (MRMs; Raudenbush & Bryk, 2002). MRMs were specified in HLM software (version 6.08; Raudenbush, Bryk, & Congdon, 2004), with t repeated measurements (level-1; urine drug screens nti = 3 [max.], TLFB nti = 4 [max.], and SRD nti = 4 [max.]) nested within i youths (level-2; n·i = 104). The urine drug screen outcome was modeled using a binomial trial with a logit link function where the number of positive marijuana results was adjusted for the number of drug screens administered in a given three-month time interval. Because there was not a consistent baseline measurement for the urine drug screens, the model intercept for this outcome represents the interval of months 1–3. The key distinction on the TLFB was between those who reported none versus any marijuana use. Thus, the TLFB data were modeled according to a Bernoulli distribution with a logit link function. The delinquency data represented the sum of the number of SRD items endorsed. Therefore, this outcome was modeled according to a Poisson distribution with a log link function.
The research questions focused on change in the outcomes over time. Visual inspection of individual trajectories did not suggest a constant rate of change; therefore, the level of the outcome at each measurement occasion was compared to the baseline level of the outcome. The level-1 model was specified using a dummy-coded indicator for each post-baseline measurement occasion. The level-2 model was specified with a dummy-coded condition indicator (US = 0, CM-FAM = 1), and cross-level interactions were entered between the condition indicator and each of the level-1 terms. This specification yields statistical tests for whether the baseline score for a given outcome (a) differed significantly from zero for the US group and (b) differed significantly for the CM-FAM group versus the US group, as well as tests for whether the change between baseline and each measurement occasion (c) differed significantly from zero for the US group and (d) differed significantly for the CM-FAM group versus the US group. Additionally, the multivariate hypothesis testing option in HLM was used to determine whether the change between each measurement occasion and the previous measurement occasion (e.g., months 4–6 versus months 7–9) differed significantly for CM-FAM versus US.
Results
Participant Characteristics
Between-groups comparisons indicated that the youths in the CM-FAM (n = 63) and US (n = 41) conditions did not differ with regard to demographic or diagnostic characteristics (all ps > .05). Thus, these characteristics are reported for the total sample. The 104 youth participants averaged 15.4 years of age (SD = .97 years, range = 12–17 years), and 83% were male. The racial breakdown of the adolescent sample was 57% white, 40% African American, and 3% biracial. Only 14% of the youths lived with both biological parents, whereas 16% lived with a biological parent and another adult, 53% with a single biological parent, and 17% with other relatives. Socioeconomically, median annual household income was in the $20,000-$30,000 range, 47% of families were receiving some sort of financial assistance, and the median educational attainment of the primary caregivers was 12th grade. Overall, these data indicate that the participating families were economically disadvantaged.
The presence of past-year substance use disorders and co-occurring psychiatric disorders were assessed at baseline using parallel caregiver and youth versions of the Diagnostic Interview Schedule for Children-IV (DISC-IV), which is a well-validated structured diagnostic interview that conforms to the DSM-IV (Shaffer, Fisher, Lucas, Dulcan, & Schwab-Stone, 2000). Research staff administered the DISC-IV to caregivers via computer, and adolescents self-administered the interview using a computer program that presented prerecorded questions via headphones. Endorsement of a disorder by either informant was used to determine “caseness.” Results indicated that 86% of the adolescents met diagnostic criteria for at least one substance use disorder: 80% met criteria for cannabis abuse (24%) or dependence (56%), 38% met criteria for alcohol abuse (25%) or dependence (13%), and 16% met criteria for abuse (8%) or dependence (8%) of some other illegal substance (e.g., cocaine, barbiturates, amphetamines). Thirty-eight percent met criteria for poly substance abuse or dependence. Sixty-five percent of the youths met diagnostic criteria for at least one co-occurring psychiatric disorder. The most prevalent co-occurring externalizing disorders were conduct disorder (50%), oppositional defiant disorder (35%), and attention deficit/hyperactivity disorder (13%). The most prevalent internalizing disorders were major depression (10%), dysthymic disorder (9%), generalized anxiety disorder (6%), and posttraumatic stress disorder (4%). Consistent with these high rates of mental health and substance use problems, approximately 80% of the adolescents had a history of mental health or substance abuse treatment prior to entering JDC.
Missing Data
Missing data varied with the nature of the outcome. For the self-report measures (i.e., SRD and TLFB), 100% of eligible youths were assessed at baseline, 96% at the 3-month assessment, 96% at the 6-month assessment, and 100% at the 9-month assessment. The primary reason for missing self-report data was a lack of family responsiveness when researchers attempted to schedule assessment visits. As described previously, there was no baseline measurement for the urine drug screen outcomes (i.e., screens were not administered during the 3 months prior to referral to JDC). Because this study utilized court-administered drug screens, these data were available only for the duration of a youth’s JDC involvement. In contrast with self-report assessments, urine drug testing was not conducted after a youth graduated from or was terminated from JDC. Regular drug testing was conducted, however, regardless of a youth’s level of participation in substance abuse treatment. For youth who were eligible to complete a drug screen during months 1–3, 4–6, and 7–9, the completion rates were 97%, 94%, and 100%, respectively. All available data were included in the analyses.
Substance Use Outcomes
Table 1 provides descriptive statistics for each of the outcome measures by treatment condition and assessment occasion. Of note, the urine drug screen data in Table 1 reflect the mean probability of providing at least one positive screen for marijuana, after adjusting for the number of screens administered to each youth. (McCall, 2001). Results from the MRMs testing change between baseline and the subsequent measurement occasions (i.e., baseline vs. months 1–3, 4–6, and 7–9) and between the other sequential measurement occasions (i.e., months 1–3 vs. 4–6; months 4–6 vs. 7–9) are presented in Table 2.
Table 1.
Descriptive Statistics for Dichotomous (Percent Positive) and Count (Mean and Standard Deviation) Outcomes
| Outcome | Month 0 | Months 1–3 | Months 4–6 | Months 7–9 |
|---|---|---|---|---|
| Urine Drug Screens-Marijuana | ||||
| CM-FAM | 28% | 19% | 20% | |
| US | 25% | 26% | 34% | |
| Timeline Follow-Back-Marijuana | ||||
| CM-FAM | 92% | 30% | 28% | 30% |
| US | 88% | 32% | 21% | 30% |
| SRD General Delinquency | ||||
| CM-FAM | 3.90 (4.45) | 1.42 (2.82) | 1.69 (2.82) | 0.76 (1.28) |
| US | 4.24 (5.49) | 1.64 (2.11) | 1.42 (2.29) | 1.70 (2.63) |
| SRD Person Offenses | ||||
| CM-FAM | 0.97 (1.38) | 0.42 (0.99) | 0.53 (0.84) | 0.15 (0.36) |
| US | 0.88 (1.40) | 0.39 (0.57) | 0.32 (0.48) | 0.60 (1.07) |
| SRD Property Offenses | ||||
| CM-FAM | 1.67 (2.04) | 0.60 (1.54) | 0.40 (1.07) | 0.18 (0.73) |
| US | 2.07 (2.93) | 0.57 (1.10) | 0.37 (1.38) | 0.90 (1.52) |
Note. N = 104. CM-FAM = Contingency Management-Family Engagement Intervention; US = Usual Services; SRD = Self-report Delinquency Scale.
Table 2.
Mixed-Effect Regression Models for Treatment Outcome Measures
| Urine Drug Screens-Marijuana | β | SE | df | P | OR | 95% CI |
|---|---|---|---|---|---|---|
| Months 1–3 | ||||||
| US | −2.663 | 0.274 | 96 | 0.000 | 0.070 | 0.04, 0.12 |
| CM-FAM vs. US | −0.228 | 0.304 | 96 | 0.455 | 0.800 | 0.44, 1.46 |
| Months 4–6 vs. Months 1–3 | ||||||
| US | 0.303 | 0.245 | 210 | 0.217 | 1.354 | 0.84, 2.19 |
| CM-FAM vs. US | −0.642 | 0.321 | 210 | 0.047 | 0.527 | 0.28, 0.99 |
| Months 7–9 vs. Months 1–3 | ||||||
| US | 0.662 | 0.361 | 210 | 0.068 | 1.938 | 0.95, 3.94 |
| CM-FAM vs. US | −0.865 | 0.423 | 210 | 0.042 | 0.421 | 0.18, 0.97 |
|
|
||||||
| χ2 | df | P | ORa | |||
|
|
||||||
| Months 7–9 vs. Months 4–6 | ||||||
| CM-FAM vs. US | 0.277 | 1 | > 0.500 | 0.800 | ||
| Timeline Follow-Back-Marijuana | β | SE | df | P | OR | 95% CI |
|---|---|---|---|---|---|---|
| Month 0 | ||||||
| US | 2.612 | 0.635 | 102 | 0.000 | 13.626 | 3.93, 47.30 |
| CM-FAM vs. US | 0.510 | 0.818 | 102 | 0.534 | 1.666 | 0.34, 8.28 |
| Months 1–3 vs. Month 0 | ||||||
| US | −3.680 | 0.770 | 285 | 0.000 | 0.025 | 0.01, 0.11 |
| CM-FAM vs. US | −0.626 | 0.939 | 285 | 0.505 | 0.535 | 0.08, 3.37 |
| Months 4–6 vs. Month 0 | ||||||
| US | −4.258 | 0.927 | 285 | 0.000 | 0.014 | 0.00, 0.09 |
| CM-FAM vs. US | −0.187 | 1.047 | 285 | 0.859 | 0.829 | 0.11, 6.46 |
| Months 7–9 vs. Month 0 | ||||||
| US | −3.591 | 1.271 | 285 | 0.005 | 0.028 | 0.00, 0.33 |
| CM-FAM vs. US | −0.785 | 1.473 | 285 | 0.594 | 0.456 | 0.03, 8.18 |
|
|
||||||
| χ2 | df | P | ORa | |||
|
|
||||||
| Months 4–6 vs. Months 1–3 | ||||||
| CM-FAM vs. US | 0.219 | 1 | >0.500 | 1.551 | ||
| Months 7–9 vs. Months 4–6 | ||||||
| CM-FAM vs. US | 0.189 | 1 | >0.500 | 0.550 | ||
| SRD General Delinquency | β | SE | df | P | ERR | 95% CI |
|---|---|---|---|---|---|---|
| Month 0 | ||||||
| US | 1.446 | 0.166 | 102 | 0.000 | 4.245 | 3.05, 5.90 |
| CM-FAM vs. US | −0.083 | 0.215 | 102 | 0.699 | 0.920 | 0.60, 1.41 |
| Months 1–3 vs. Month 0 | ||||||
| US | −0.952 | 0.169 | 284 | 0.000 | 0.386 | 0.28, 0.54 |
| CM-FAM vs. US | 0.015 | 0.212 | 284 | 0.944 | 1.015 | 0.67, 1.54 |
| Months 4–6 vs. Month 0 | ||||||
| US | −1.149 | 0.217 | 284 | 0.000 | 0.317 | 0.21, 0.49 |
| CM-FAM vs. US | 0.378 | 0.253 | 284 | 0.136 | 1.459 | 0.89, 2.39 |
| Months 7–9 vs. Month 0 | ||||||
| US | −1.014 | 0.277 | 284 | 0.001 | 0.363 | 0.21, 0.63 |
| CM-FAM vs. US | −0.514 | 0.343 | 284 | 0.135 | 0.598 | 0.30, 1.17 |
|
|
||||||
| χ2 | df | P | ERRa | |||
|
|
||||||
| Months 4–6 vs. Months 1–3 | ||||||
| CM-FAM vs. US | 1.527 | 1 | 0.214 | 1.437 | ||
| Months 7–9 vs. Months 4–6 | ||||||
| CM-FAM vs. US | 5.241 | 1 | 0.021 | 0.523 | ||
| SRD Person Offenses | β | SE | df | P | ERR | 95% CI |
|---|---|---|---|---|---|---|
| Month 0 | ||||||
| US | −0.476 | 0.250 | 102 | 0.060 | 0.621 | 0.38, 1.01 |
| CM-FAM vs. US | 0.059 | 0.299 | 102 | 0.844 | 1.061 | 0.59, 1.91 |
| Months 1–3 vs. Month 0 | ||||||
| US | −0.876 | 0.384 | 284 | 0.023 | 0.416 | 0.20, 0.88 |
| CM-FAM vs. US | 0.061 | 0.504 | 284 | 0.905 | 1.062 | 0.40, 2.85 |
| Months 4–6 vs. Month 0 | ||||||
| US | −1.091 | 0.665 | 284 | 0.102 | 0.336 | 0.09, 1.24 |
| CM-FAM vs. US | 0.478 | 0.709 | 284 | 0.500 | 1.614 | 0.40, 6.47 |
| Months 7–9 vs. Month 0 | ||||||
| US | −0.423 | 0.471 | 284 | 0.371 | 0.655 | 0.26, 1.65 |
| CM-FAM vs. US | −1.502 | 0.707 | 284 | 0.034 | 0.223 | 0.06, 0.89 |
|
|
||||||
| χ2 | df | P | ERRa | |||
|
|
||||||
| Months 4–6 vs. Months 1–3 | ||||||
| CM-FAM vs. US | 0.225 | 1 | >0.500 | 1.517 | ||
| Months 7–9 vs. Months 4–6 | ||||||
| CM-FAM vs. US | 4.218 | 1 | 0.038 | 0.138 | ||
| SRD Property Offenses | β | SE | df | P | ERR | 95% CI |
|---|---|---|---|---|---|---|
| Month 0 | ||||||
| US | 0.198 | 0.218 | 102 | 0.368 | 1.218 | 0.80, 1.87 |
| CM-FAM vs. US | −0.250 | 0.286 | 102 | 0.384 | 0.778 | 0.05, 0.14 |
| Months 1–3 vs. Month 0 | ||||||
| US | −1.299 | 0.181 | 284 | 0.000 | 0.273 | 0.19, 0.39 |
| CM-FAM vs. US | 0.329 | 0.262 | 284 | 0.210 | 1.390 | 0.83, 2.32 |
| Months 4–6 vs. Month 0 | ||||||
| US | −1.729 | 0.189 | 284 | 0.000 | 0.177 | 0.12, 0.26 |
| CM-FAM vs. US | 0.326 | 0.320 | 284 | 0.309 | 1.386 | 0.74, 2.59 |
| Months 7–9 vs. Month 0 | ||||||
| US | −1.085 | 0.267 | 284 | 0.000 | 0.338 | 0.20, 0.57 |
| CM-FAM vs. US | −1.041 | 0.375 | 284 | 0.006 | 0.353 | 0.17, 0.74 |
|
|
||||||
| χ2 | df | P | ERRa | |||
|
|
||||||
| Months 4–6 vs. Months 1–3 | ||||||
| CM-FAM vs. US | 0.000 | 1 | >0.500 | 0.997 | ||
| Months 7–9 vs. Months 4–6 | ||||||
| CM-FAM vs. US | 9.194 | 1 | 0.003 | 0.255 | ||
Note. N = 104. CM-FAM = Contingency Management-Family Engagement Intervention; US = Usual Services; SRD = Self-report Delinquency Scale; OR = Odds Ratio; ERR = Event Rate Ratio; CI = Confidence Interval.
Calculated from model coefficients.
Urine drug screens
During the first 3 months of the study (see Table 1), 28% and 25% of youths in the CM-FAM and US conditions, respectively, tested positive for marijuana at least once. During the next 6 months (i.e., months 7–9 vs. 1–3), youths in the US condition showed a marginally significant increase in marijuana use. Importantly, treatment effects emerged during this time (i.e., months 4–6 vs. 1–3; months 7–9 vs. 1–3), with youths in the CM-FAM condition showing a significantly greater reduction in marijuana use in comparison with US counterparts. From months 1–3 to months 7–9, the odds of a positive marijuana result per drug screen for US youths increased 94% (odds ratio = 1.94). During the same time, for CM-FAM youths, the odds of a positive marijuana result per drug screen decreased 18% (odds ratio = 0.82 [calculated from coefficients in Table 2]).
Timeline follow back
At baseline, approximately 90% of youths in both conditions reported marijuana use. Upon entry into JDC (i.e., months 1–3 vs. the 3 months prior to recruitment), however, significant and rapid decreases in marijuana use were reported by youths across both conditions, and no treatment effects were observed. During the final 3 months (i.e., months 7–9), 30% of youths reported using marijuana in the CM-FAM and US conditions.
Delinquency Outcomes
General delinquency
Across intervention conditions, youths reported similar rates of general delinquency at baseline. Significant and similar decreases in general delinquency were reported from baseline through the first 6 months of the study for youths in both treatment conditions. The comparison of reports during months 4–6 to months 7–9, however, revealed a significant treatment effect favoring the CM-FAM condition. During this time, the rate of general delinquency increased 14% for US youths (event rate ratio = 1.14 [calculated]) and decreased 53% for CM-FAM youths (event rate ratio = 0.47 [calculated]).
Person offenses
As observed for general delinquency, youths in the CM-FAM and US conditions reported similar rates of crimes against persons at baseline. Significant and similar decreases in crimes against persons were reported from baseline through the first 3 months of the study for youths in both treatment conditions. A significant between-groups difference favoring the CM-FAM condition, however, was observed in the change occurring from baseline to the final assessment (i.e., months 7–9). During this time, the rate of person offenses decreased 34% for US youths (event rate ratio = 0.66) and 85% for CM-FAM youths (event rate ratio = 0.15 [calculated]). This significant effect was due primarily to changes that occurred from months 4–6 to months 7–9, where a significant treatment effect favored the CM-FAM condition. Specifically, during this time the rate of person offenses for US youths increased 95% (event rate ratio = 1.95 [calculated]), whereas the rate of person offenses decreased 73% (event rate ratio = 0.27 [calculated]) for CM-FAM youths.
Property offenses
The pattern of results for property offenses was similar to that of the other delinquency measures. Across treatment conditions, youths reported similar rates of property crimes at baseline, and analyses revealed significant reductions through the first 6 months of the study. Outcomes then diverged significantly. From months 4–6 to months 7–9, the rate of property offenses for US youths increased 91% (event rate ratio = 1.91 [calculated]), whereas the rate of property offenses decreased 52% (event rate ratio = 0.48 [calculated]) for CM-FAM youths. Moreover, the between-groups comparison also significantly favored the CM-FAM condition from baseline to 7–9 months. Here, the rate of property offenses decreased 66% for US youths (event rate ratio = 0.34) and 88% for CM-FAM youths (event rate ratio = 0.12 [calculated]).
Moderator Effects
Moderator analyses examined whether the interventions were differentially effective for youths as a function of demographic characteristics or psychiatric problems. For these analyses, dichotomous moderator variables were created for youth age (< 16 years versus ≥ 16 years), gender (male versus female), ethnicity (white versus non-white), co-occurrence of externalizing disorder, and co-occurrence of internalizing disorder. To test for moderation, the level-2 model for each timepoint indicator was modified to include a main effect for the putative moderator variable and an interaction effect between the moderator variable and the condition indicator. Significant moderation was not observed above the levels expected by chance.
Adjustment for Nesting
Youth were nested within drug courts; however, there were too few courts to support a random effect for formal significance testing (Maas & Hox, 2005). As a follow-up to the results presented above, however, exploratory GEE-based models were performed with a random effect for drug court membership. The goal of the models was to evaluate whether conclusions changed when controlling for differences in outcomes across courts. All SRD findings were maintained with the exception of the Property Offenses effect for months 7–9 versus baseline (p = .073). This supports the view that the variance in the delinquency outcomes attributable to courts was relatively small. For the urine drug screen outcome, however, the two significant between-groups differences were not maintained after adjusting for nesting. The fixed effects estimates evidenced similar, or even larger, between-groups differences. However, the standard errors were larger, and the test statistics were non-significant (months 4–6 versus months 1–3, p = .205; months 7–9 versus months 1–3, p = .167). This finding suggests that a larger portion of the variance in drug screen results was attributable to the particular JDCs.
To further explore potential court differences on the urine drug screen outcome, the mean probability of a positive screen at each time point was plotted for the US courts and separately for each of the three CM-FAM courts (see Figure 2). As shown, from months 1–3 to months 7–9, the probability of a positive screen decreased for two of the CM-FAM courts whereas the probability of a positive screen increased slightly for the US courts. For the third CM-FAM court, an initial decrease in the probability of a positive screen from months 1–3 to months 4–6 was followed by a slight increase between months 4–6 and months 7–9. These results, as one might anticipate in light of the aforementioned variability in JDC outcomes in the literature and as experienced when conducting research in real-world settings, show that the introduction of evidence-based practices did not have uniform effects across organizational contexts.
Figure 2.
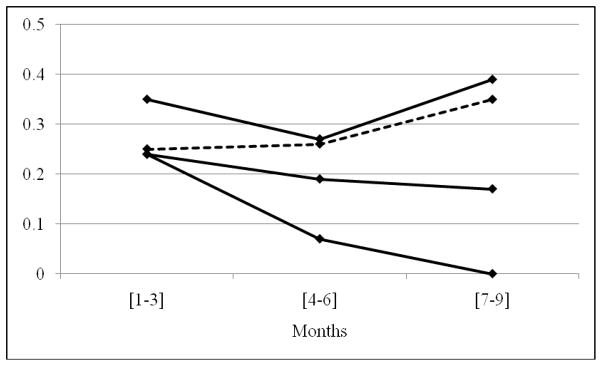
Mean probability of a positive urine drug screen for marijuana at each research time point for the usual services courts (dotted line) and for each of the three Contingency-Management-Family Engagement courts (solid lines).
Discussion
The context of this study is one in which JDCs have been widely transported across the nation (Bureau of Justice Assistance Drug Court Clearing House, 2009), results from controlled evaluations of the effectiveness of JDCs have been mixed (e.g., Aos et al., 2006), and reviewers (e.g., Hills et al., 2009) have emphasized the need for JDCs to improve their engagement of families and integrate evidence based treatments of adolescent substance abuse. Results from the biological indices of substance use supported the effectiveness of the CM-FAM interventions as integrated into JDCs. Based on urine drug screens, marijuana use by youths in the CM-FAM condition decreased significantly over time, whereas counterparts in the US condition showed a marginally significant increase. An exploratory examination of nesting effects, however, showed that these effects were due primarily to the favorable outcomes achieved by two of the three JDCs in the CM-FAM condition. Between-groups differences did not emerge for the self-report TLFB measure of marijuana use, though significant time effects were observed for both treatment conditions. The general effectiveness of CM-FAM in decreasing marijuana use in adolescents, as measured by the biological index, is not surprising in light of the well demonstrated effectiveness of CM (Higgins et al., 2008) and compatibility of CM with JDC procedures (e.g., monitoring substance use and providing rewards or sanctions based on results). Yet, the findings are noteworthy in demonstrating the capacity of a well specified and implemented (i.e., intervention fidelity measures favored the CM-FAM condition) intervention protocol to enhance the functioning of JDCs. Moreover, this is one of the few studies in the drug court literature, either adult (see GAO, 2005) or juvenile (e.g., Belenko & Logan, 2003), to measure or demonstrate reductions in participant substance use.
Given the discrepancy in the results for the biological and self-report marijuana use outcomes, the correspondence between these two measurements was evaluated. In light of the different assessment schedules for the urine drug screen and TLFB outcomes described previously (i.e., drug screens were not collected during the 3 months before referral to JDC, whereas the TLFB assessment at baseline examines substance use retrospectively during those 3 months), a dataset was created with the cases containing both TLFB and drug screen measurements from months 1 through 9 in 3-month increments. In this dataset, the two substance use outcomes concurred 85% of the time, and the group means at each time point for each outcome were generally consistent. Most (i.e., 70%) of the discrepancies in the data were in the direction of the TLFB indicating no marijuana use despite a positive screen. Thus, although it is difficult to identify a specific reason for the different results observed in the current study, one hypothesis is that despite the high degree of correspondence, the greater measurement error associated with TLFB relative to urine drug screen measurement methods might have attenuated detection of between-groups effects. Nevertheless, there is little reason to believe that the self-report measure was invalid and, therefore, the effectiveness of CM-FAM in attenuating offender substance use is only supported in part.
Results also favored the CM-FAM condition in the reduction of criminal activity. For both person and property offenses, CM-FAM was significantly more effective than US at decreasing the criminal behavior of the juvenile offenders participating in this study. Indeed, following an initial decrease, youths in the US condition reported increased property offenses from months 4–6 to months 7–9. One hypothesis for the timing of this result is that drug court itself might serve initially as a relatively powerful intervention. Over time, however, effective behavioral treatment techniques (such as those implemented in CM-FAM) might be needed to sustain improvements. Significantly, these findings are consistent with the Henggeler et al. (2006) JDC study where an evidence-based family treatment (i.e., MST) that integrated CM in collaboration with JDC was more effective at reducing self-reported offending than was JDC with usual community-based substance abuse treatment. Importantly, however, the present study included only the family engagement strategies used in MST (and in other evidence-based family therapies [Elliott & Mihalic, 2004; Waldron & Turner, 2008]), not the full MST protocol (e.g., home-based service delivery, comprehensive approach to youth and family difficulties).
Together, the biological measure of substance use and the delinquency findings support the promise of CM-FAM in addressing key treatment needs of substance abusing youths in the juvenile justice system. Such youths present a myriad of challenging psychosocial and clinical problems, and their long-term outcomes are often problematic (Chassin, 2008). The present sample reflects a challenging subset of juvenile justice youths (i.e., economically disadvantaged, 70% living with single parents or other relatives, 86% with substance use disorders, and 65% with at least one co-occurring psychiatric disorder). Yet, CM-FAM delivered within a juvenile justice program was relatively effective in achieving key youth outcomes. Such results contrast with the vast majority of interventions delivered by or provided within the juvenile justice system (e.g., Greenwood, 2006; Petrosino, Turpin-Petrosino, & Guckenburg, 2010). Moreover, consistent with findings for evidence-based treatments of delinquency (Henggeler & Sheidow, in press), few significant moderators of treatment effectiveness were observed.
Limitations
The study includes several limitations. First, arrest data were not examined due to the brief duration of follow-up and study design (i.e., in order to facilitate the recruitment and sustain the participation of the juvenile drug courts in the research, we agreed to provide CM-FAM training to those courts initially randomized to the US condition 18 months later), and it is entirely possible that the findings favoring CM-FAM for self-reported offending would not be reflected in long-term arrest data. A second limitation pertains to the lack of follow-up data. Favorable findings in the treatment of adolescent substance use often dissipate at follow-up. Yet, at least the initial results here are promising. Third, in light of the modest sample size, type 2 error was likely inflated for both the outcome and moderator analyses. Fourth, with regard to the transport of CM-FAM to other JDC sites, issues concerning incremental cost (e.g., for training and vouchers), acceptability among stakeholders (e.g., judge, prosecutors, therapists) for interventions that “pay” youths for negative screens, and sustainability of interventions were not examined in this article, but are the focus of forthcoming manuscripts.
Policy and Clinical Implications
In light of the dearth of effective services for youths with substance abuse problems in the juvenile justice system, the present results are promising in several ways. First, as evidenced by the adherence indices across several JDC sites, CM-FAM seems amenable to adoption by a variety of treatment providers working in collaboration with the juvenile justice system (also see McCart et al., 2011). Consistent with other recent findings regarding CM (Henggeler, Chapman et al., 2008), such amenability has favorable implications for transport. Second, likely in light of the compatibility of CM-FAM with JDC interventions and emphasis on youth accountability, the results demonstrate that an evidence-based substance abuse treatment can be integrated effectively into the juvenile justice system. With only 5% of serious juvenile offenders currently receiving evidence-based treatments (Greenwood, 2008; Henggeler & Schoenwald, 2011), such a possibility is noteworthy. Third, and perhaps most importantly, the findings suggest that JDC practices can be enhanced to achieve better outcomes for participating juvenile offenders. The vehicle for promoting such enhancements might pertain to the development and implementation of program certification standards that support the use of evidence-based interventions by JDCs (Marlowe, 2010). Such standards have been fundamental to the transport of evidence-based treatments of juvenile offenders (Elliott & Mihalic, 2004).
The primary aim of this study was to evaluate whether the effectiveness of JDCs could be enhanced by integrating compatible and relatively efficient evidence-based practices. Though not uniformly positive, the results were encouraging. Future research aimed at further bolstering the effectiveness of JDCs might focus on avenues that have been associated with increased effectiveness in adult drug courts (Rossman, Roman, Zweig, Rempel, & Lindquist, 2011). These pertain to the role of the judge (e.g., a positive and respectful demeanor was linked with better outcomes) and court policies (e.g., more frequent drug testing and higher judicial supervision were associated with better outcomes).
Acknowledgments
This research was supported by grant DA019892 from the National Institute on Drug Abuse awarded to the first author. The trial is registered at ClinicalTrials.gov, registration number NCT01266109. The authors sincerely thank the coordinators at the participating drug courts, including Jeff Phillips, Mark Manning, Jamila Lockhart, Denise Stinson, Judge Bobbie Reaves, Donna Fair, Jessica Modra, Calvin Settles, and John Graham for their support in facilitating this project. We also thank members of the research team, including Jennifer Shackelford, Michelle Lanier, Jennifer Browder, and Kevin Armstrong.
References
- Aos S, Miller M, Drake E. Evidence-based public policy options to reduce future prison construction, criminal justice costs, and crime rates. Olympia: Washington State Institute for Public Policy; 2006. [Google Scholar]
- Belenko S, Logan TK. Delivering more effective treatment to adolescents: Improving the juvenile drug court model. Journal of Substance Abuse Treatment. 2003;25(3):189–211. doi: 10.1016/s0740-5472(03)00123-5. [DOI] [PubMed] [Google Scholar]
- Bureau of Justice Assistance Drug Court Clearing House. Summary of juvenile/family drug court activity by state and county. 2009 Available from http://www1.spa.american.edu/justice/documents/2153.pdf.
- Chapman JE, Sheidow AJ, Henggeler SW, Halliday-Boykins C, Cunningham PB. Developing a measure of therapist adherence to contingency management: An application of the Many-Facet Rasch model. Journal of Child and Adolescent Substance Abuse. 2008;17:47–68. doi: 10.1080/15470650802071655. [DOI] [PMC free article] [PubMed] [Google Scholar]
- Chassin L. Juvenile justice and substance use. The Future of Children. 2008;18(2):165–183. doi: 10.1353/foc.0.0017. [DOI] [PubMed] [Google Scholar]
- Donohue B, Azrin NH, Strada MJ, Silver NC, Teichner G, Murphy H. Psychometric evaluation of self- and collateral timeline follow-back reports of drug and alcohol use in a sample of drug-abusing and conduct-disordered adolescents and their parents. Psychology of Addictive Behaviors. 2004;18:184–189. doi: 10.1037/0893-164X.18.2.184. [DOI] [PubMed] [Google Scholar]
- Dowell KA, Ogles BM. The effects of parent participation on child psychotherapy outcome: A meta-analytic review. Journal of Clinical Child and Adolescent Psychology. 2010;39:151–162. doi: 10.1080/15374410903532585. [DOI] [PubMed] [Google Scholar]
- Elliott DS, Ageton SS, Huizinga D, Knowles BA, Canter RJ. Tech Rep No 26. Boulder, CO: Behavioral Research Institute; 1983. The prevalence and incidence of delinquent behavior: 1976–1980. [Google Scholar]
- Elliott DS, Mihalic S. Issues in disseminating and replicating effective prevention programs. Prevention Science. 2004 Mar;5:47–52. doi: 10.1023/b:prev.0000013981.28071.52. [DOI] [PubMed] [Google Scholar]
- General Accountability Office. Adult drug courts: Evidence indicates recidivism reductions and mixed results for other outcomes. Washington, DC: US Government Accountability Office; 2005. GAO-05–219. [Google Scholar]
- Greenwood PW. Changing lives: Delinquency prevention as crime-control policy. Chicago, IL: The University of Chicago Press; 2006. [Google Scholar]
- Halliday-Boykins CA, Schaeffer CM, Henggeler SW, Chapman JE, Cunningham PB, Randall J, Shapiro SB. Predicting nonresponse to juvenile drug court interventions. Journal of Substance Abuse Treatment. 2010;39:318–328. doi: 10.1016/j.jsat.2010.07.011. [DOI] [PMC free article] [PubMed] [Google Scholar]
- Henggeler SW. Juvenile drug courts: Emerging outcomes and key research issues. Current Opinion in Psychiatry. 2007;20:242–246. doi: 10.1097/YCO.0b013e3280ebb601. [DOI] [PubMed] [Google Scholar]
- Henggeler SW. Efficacy studies to large-scale transport: The development and validation of MST programs. Annual Review of Clinical Psychology. 2011;7:351–381. doi: 10.1146/annurev-clinpsy-032210-104615. [DOI] [PubMed] [Google Scholar]
- Henggeler SW, Chapman JE, Rowland MD, Halliday-Boykins CA, Randall J, Shackelford J, Schoenwald SK. Statewide adoption and initial implementation of contingency management for substance abusing adolescents. Journal of Consulting and Clinical Psychology. 2008;76:556–567. doi: 10.1037/0022-006X.76.4.556. [DOI] [PMC free article] [PubMed] [Google Scholar]
- Henggeler SW, Cunningham PB, Rowland MD, Schoenwald SK, Swenson CC, Sheidow AJ, McCart MR, Donohue B, Navas-Murphy L, Randall J. Contingency management for adolescent substance abuse. New York: Guilford Press; in press. [Google Scholar]
- Henggeler SW, Halliday-Boykins CA, Cunningham PB, Randall J, Shapiro SB, Chapman JE. Juvenile drug court: Enhancing outcomes by integrating evidence-based treatments. Journal of Consulting and Clinical Psychology. 2006;74(1):42–54. doi: 10.1037/0022-006X.74.1.42. [DOI] [PubMed] [Google Scholar]
- Henggeler SW, Pickrel SG, Brondino MJ, Crouch JL. Eliminating (almost) treatment dropout of substance abusing or dependent delinquents through home-based multisystemic therapy. American Journal of Psychiatry. 1996;153:427–428. doi: 10.1176/ajp.153.3.427. [DOI] [PubMed] [Google Scholar]
- Henggeler SW, Schoenwald SK. Evidence-based interventions for juvenile offenders and juvenile justice policies that support them. Society for Research in Child Development: Social Policy Report. 2011;25:1–20. [Google Scholar]
- Henggeler SW, Schoenwald SK, Borduin CM, Rowland MD, Cunningham PB. Multisystemic therapy for antisocial behavior in children and adolescents. 2. New York: Guilford Press; 2009. [Google Scholar]
- Henggeler SW, Sheidow AJ. Empirically supported family-based treatments for conduct disorder and delinquency. Journal of Marital and Family Therapy. doi: 10.1111/j.1752-0606.2011.00244.x. in press. [DOI] [PMC free article] [PubMed] [Google Scholar]
- Higgins ST, Silverman K, Heil SH. Contingency management in substance abuse treatment. New York, NY: Guilford Press; 2008. [Google Scholar]
- Hills H, Shufelt JL, Cocozza JJ. Evidence-based practice recommendations for juvenile drug courts. Delmar, NY: National Center for Mental Health and Juvenile Justice; 2009. [Google Scholar]
- Maas CJM, Hox JJ. Sufficient sample sizes for multilevel modeling. Methodology. 2005;1:86–92. [Google Scholar]
- Marlowe DB. Putting meat on the bones of the ten key components. ALLRISE Magazine. 2010 Spring;2(2):12. [Google Scholar]
- McCall RB. Fundamental statistics for behavioral sciences. 8. Belmont, California: Wadsworth/Thomson Learning; 2001. [Google Scholar]
- Miller WR. Form 90: Structured Assessment for drinking related behavior. Washington, DC: NIAAA; 1991. [Google Scholar]
- National Association of Drug Court Professionals. Defining drug courts: The key components. U.S. Department of Justice, Office of Justice Programs, Drug Court Programs Office; 1997. [Google Scholar]
- Petrosino A, Turpin-Petrosino C, Guckenburg S. Formal system processing of juveniles: Effects on delinquency. Campbell Systematic Reviews. 2010;2010:1. doi: 10.4073/csr.20101. [DOI] [Google Scholar]
- Raudenbush SW, Bryk AS. Hierarchical linear models: Applications and data analysis methods. 2. Thousand Oaks, CA: Sage; 2002. [Google Scholar]
- Raudenbush SW, Bryk AS, Congdon R. HLM 6 for Windows [Computer software] Lincolnwood, IL: Scientific Software International, Inc; 2004. [Google Scholar]
- NADCP News. 2009. Spring. Record funding for drug court!!! [Google Scholar]
- Rogers EM. Diffusion of innovations, Fourth Edition. New York, NY: The Free Press; 1995. [Google Scholar]
- Rossman SB, Roman JK, Zweig JM, Rempel M, Lindquist CH. The multi-site adult drug court evaluation: Executive summary. Washington, DC: Urban Institute Justice Policy Center; 2011. [Google Scholar]
- Salvatore C, Henderson JS, Hiller ML, White E, Samuelson B. Inside the “black box” of the prehearing team conference and status review hearing of a juvenile drug court. Drug Court Review. 2010;7:95–124. [Google Scholar]
- Schaeffer CM, Henggeler SW, Chapman JE, Halliday-Boykins CA, Cunningham PB, Randall J, Shapiro SB. Mechanisms of effectiveness in juvenile drug court: Altering risk processes associated with delinquency and substance abuse. Drug Court Review. 2010;7:57–94. [Google Scholar]
- Shaffer DK. Unpublished doctoral dissertation. University of Cincinnati; 2006. Reconsidering drug court effectiveness: A meta-analytic review. [Google Scholar]
- Shaffer DM, Fisher PW, Lucas C, Dulcan MK, Schwab-Stone ME. NIMH Diagnostic Interview Schedule for Children Version IV (NIMH DISC-IV): Description, differences from previous versions, and reliability of some common diagnoses. Journal of the American Academy of Child and Adolescent Psychiatry. 2000;39:28–38. doi: 10.1097/00004583-200001000-00014. [DOI] [PubMed] [Google Scholar]
- Stanger C, Budney AJ. Contingency management approaches for adolescent substance use disorders. Child & Adolescent Psychiatric Clinics of North America. 2010;19:547–562. doi: 10.1016/j.chc.2010.03.007. [DOI] [PMC free article] [PubMed] [Google Scholar]
- Thornberry TP, Krohn MD. The self-report method for measuring delinquency and crime. Criminal Justice. 2000;4:33–83. [Google Scholar]
- Waldron HB, Slesnick N, Brody JL, Turner CW, Peterson TR. Treatment outcomes for adolescent substance abuse at four-and seven-month assessments. Journal of Consulting and Clinical Psychology. 2001;69:802–812. [PubMed] [Google Scholar]
- Waldron HB, Turner CW. Evidence-based psychosocial treatments for adolescent substance abuse. Journalof Clinical Child and Adolescent Psychology. 2008;37(1):238–261. doi: 10.1080/15374410701820133. [DOI] [PubMed] [Google Scholar]