Abstract
Periodicity is an important property of speech signals. It is the basis of the signal’s fundamental frequency and the pitch of voice, which is crucial to speech communication. This paper presents a novel framework of periodicity enhancement for noisy speech. The enhancement is applied to the linear prediction residual of speech. The residual signal goes through a constant-pitch time warping process and two sequential lapped-frequency transforms, by which the periodic component is concentrated in certain transform coefficients. By emphasizing the respective transform coefficients, periodicity enhancement of noisy residual signal is achieved. The enhanced residual signal and estimated linear prediction filter parameters are used to synthesize the output speech. An adaptive algorithm is proposed for adjusting the weights for the periodic and aperiodic components. Effectiveness of the proposed approach is demonstrated via experimental evaluation. It is observed that harmonic structure of the original speech could be properly restored to improve the perceptual quality of enhanced speech.
Keywords: Speech periodicity, Speech enhancement, Transform-domain representation, Periodic-aperiodic decomposition, Adaptive coefficient weighting
1. Introduction
Periodicity is an important property of speech signals. In the time domain, it is defined by the repetition of signal waveforms. In the frequency domain, periodicity is reflected by the appearance of strong spectral components at equally spaced harmonic frequencies. From the perspective of speech production, periodicity in acoustic signal is the result of periodic vibration of vocal cords when voiced speech is produced. Periodicity determines the fundamental frequency (i.e., pitch), which is essential in speech communication. Important high-level linguistic information, for example, intonation, lexical tones, stress and focus, is conveyed in the pitch contour of an utterance. In particular, pitch is essential for tonal languages, where the meaning of a word depends on its pitch contour.
Waveform periodicity is important for speech and pitch perception (Cardozo and Ritsma, 1968). There have been many attempts to restore the periodicity of noisy speech signal, with the goal of improving perceptual quality. The approaches can be broadly categorized as spectral-domain harmonicity restoration techniques and time-domain waveform periodicity enhancement methods. Comb-filtering was a commonly used method to suppress non-harmonic spectral components (Nehorai and Porat, 1986). In (Plapous et al., 2005, 2006), a regeneration method was proposed to recover the harmonic structure of speech. In (Zavarehei et al., 2007), harmonicity enhancement was performed based on the harmonic+noise model of speech. In recent studies, harmonicity enhancement was typically applied as a post-processing step to refine the output of other speech enhancement systems. There have been relatively few studies on enhancing time-domain waveform periodicity. This is due to the difficulty of identifying and separating the periodic component of a time-domain speech signal. In the area of hearing research, temporal periodicity enhancement has been shown Effective in improving pitch and tone perception. The commonly used techniques include increasing the modulation depth and simplifying the waveform of temporal envelope (Yuan et al., 2009). These methods introduce severe nonlinear distortion and therefore lead to degradation of speech quality.
In this paper, we present a new method of periodicity enhancement by exploiting a speech representation model, which aims at a compact and complete representation of speech signals (Kleijn, 2000; Nilsson, 2006). The redundancy related to waveform periodicity forms the basis of such representation. This speech model is suitable for a wide range of applications, including speech coding and prosodic modification. Our work on periodicity enhancement leverages one important property of the model, which is the Effective periodic-aperiodic decomposition. The decomposition is applied on the linear predictive (LP) residual signal of speech, which is considered to be the primary carrier of periodicity-related information. The LP residual signal undergoes two-stage transformations in a pitch-synchronous manner. As a result, some of the transform coefficients represent the periodic component while the other coefficients represent the aperiodic components. For noise-corrupted speech, since the interfering noise generally does not have the same periodicity characteristic as speech, periodicity enhancement of speech can be achieved by adjusting the relative contributions of the periodic and aperiodic components.
There are existing studies on manipulating LP residual signal for enhancement of noise-corrupted speech (Yegnanarayana et al., 1999) and reverberant speech (Yegnanarayana and Murthy, 2000). In these studies, it was believed that it could be in vain to enhance signal regions where the interference is too strong. Signal segments with high signal-to-noise ratio (SNR) and high signal-to-reverberant ratio (SRR) were detected by analyzing the LP residual signal with short analysis window of 1 – 3 ms. The time-domain samples of residual signal were weighted to produce enhanced output. The approach investigated in our study aims specifically at analyzing the periodicity property of LP residual signal and improving the periodicity against noise interference.
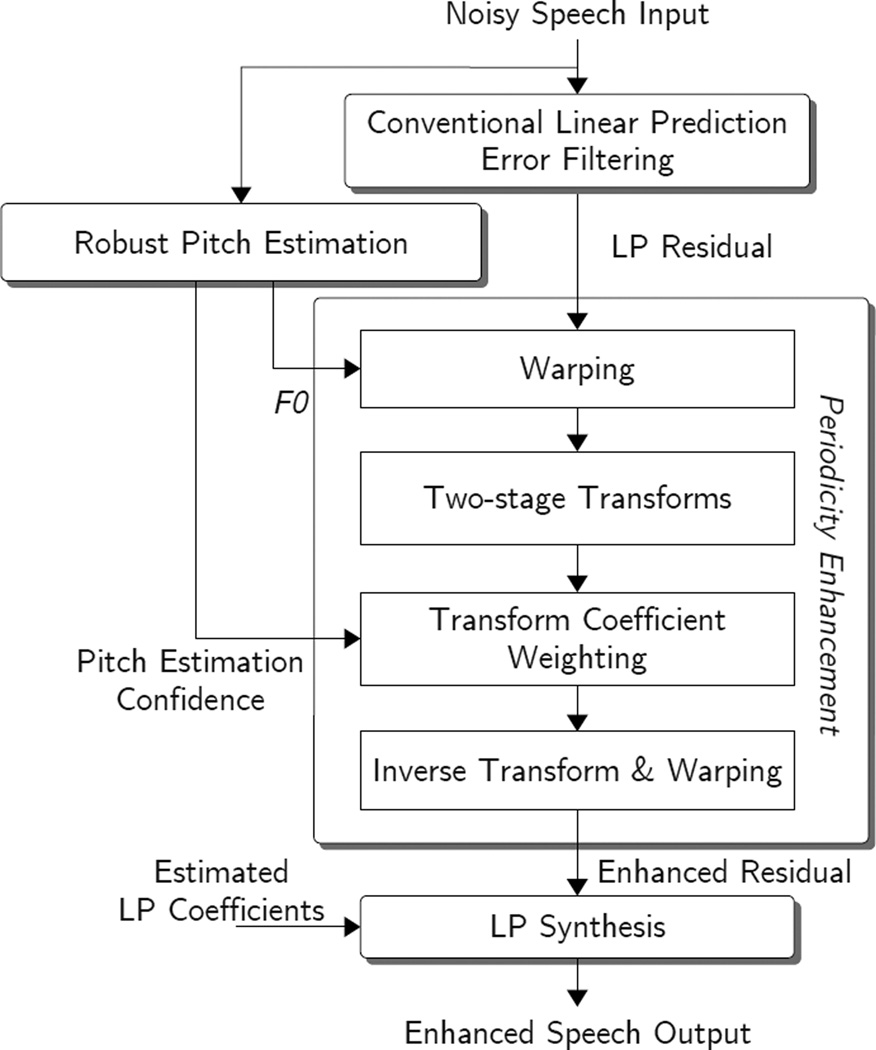
Fig. 1 illustrates the framework of the proposed approach to speech periodicity enhancement. There are two basic components that contribute to the Effectiveness of enhancement. They are the periodic-aperiodic decomposer implemented by two-stage frequency transforms and the robust pitch estimator. In Section 2, we will review the two-stage transforms (Kleijn, 2000; Nilsson, 2006) and the pitch estimation algorithm (Huang and Lee, 2012a, 2013) that are being used in this study. The principle of periodicity enhancement is explained with illustrative examples in Section 3. An adaptive algorithm of adjusting transform coefficient weights for periodicity enhancement is described in Section 4, and a few practical issues are discussed in Section 5. Section 6 gives experimental results, followed by conclusions in Section 7.
Figure 1.
Framework of speech periodicity enhancement.
2. Review
2.1. Two-stage transforms for periodic-aperiodic decomposition
Effective periodic-aperiodic decomposition is the foundation for speech periodicity enhancement. In this study, the decomposition is performed on LP residual signal using the approach proposed as in Kleijn (2000); Nilsson (2006). The LP residual signal e(n) is time-warped to have a constant pitch. The warping process requires an estimated pitch track of the input speech. For each pitch cycle, the residual signal is up-sampled to have P0 new samples. By placing these samples in equal interval over on a new time axis ν, a warped signal ewrp(ν) with a constant pitch period of P0 is obtained.
If a signal segment contains both periodic and aperiodic components, they are concentrated mainly in low- and high-frequency bands, respectively. Thus, to derive an intuitive representation with energy concentration, the warped signal ewrp(ν) is first divided into different frequency channels. This pitch-synchronous transform is implemented with a DCT-IV transform. The window size is 2P0 with 50% overlapping between neighboring windows. Let denote the kth pitch-synchronous frame, i.e., , ⋯, 2P0 − 1. The first-stage transform coefficients f (k, l) are obtained by
| (1) |
where l = 0, 1, ⋯, P0 − 1 is the channel index, and d(ν) denotes the square-root Hann window.
The second-stage transform aims to separate the periodic component from the aperiodic ones. At a particular frequency channel, the periodic component does not change significantly from one pitch cycle to the next cycle. A modulation transform is applied to extract this signal component at each channel. This is implemented with a DCT-II transform. Given a signal segment of Q pitch-synchronous frames, the coefficients of channel l, f(k, l), k = 0, 1, ⋯, Q − 1, (i.e., f(0, l), f(1, l), ⋯, f(Q − 1, l)) are transformed to generate Q output coefficients g(q, l), q = 0, 1, ⋯, Q − 1, (i.e., g(0, l), g(1, l), ⋯, g(Q − 1, l)) by,
| (2) |
where q = 0, 1, ⋯, Q − 1 is the modulation band index, and , and c(q) = 1 for q ≠ 0. With the transformation as shown in Eq.(2) carried out for all the P0 channels (i.e., l = 0, 1, ⋯, P0 − 1), transform coefficients of modulation band q, i.e., g(q, 0), g(q, 1), ⋯, g(q, P0 − 1), can be obtained.
The LP residual signal of an input utterance is divided into a number of segments, and each segment contains many pitch cycles. The segment boundaries are determined such that the energy concentration in the first modulation band is maximized for each segment (Nilsson, 2006, pp.A12). In this way, successive frames with similar properties, e.g., voiced or unvoiced speech, are grouped into the same segment.
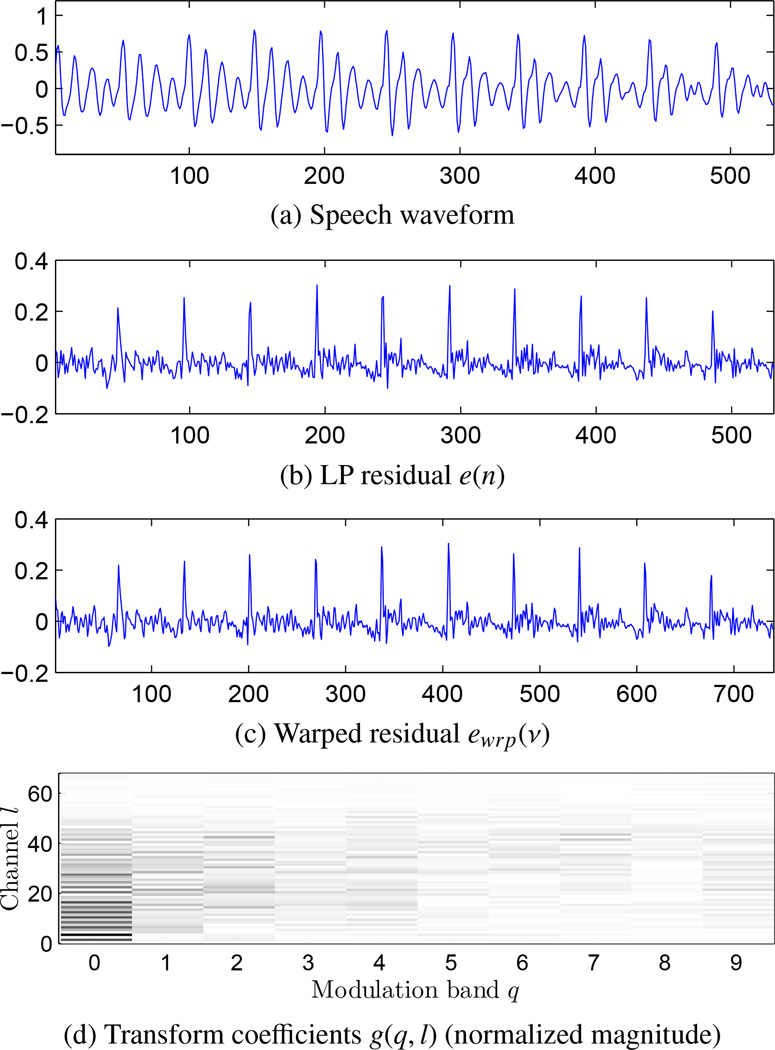
Fig. 2 gives an example of applying constant-pitch warping and the two-stage transforms on a voiced speech segment. It shows the LP residual signal extracted from the orignal speech and the warped residual signal, as well as the normalized magnitudes of the transform coefficients. It is noticed that the signal energy is concentrated in the low modulation bands, especially the first band.
Figure 2.
An example of constant-pitch warping and lapped frequency transforms of a voiced speech segment. P0 = 68 (Huang et al., 2010).
2.2. Robust pitch estimation
Pitch estimation algorithm with high accuracy is essential in the above decomposition process. In (Huang and Lee, 2012a), a sparsity-based pitch estimation method was developed and shown to have robust performance on a variety of SNR conditions (Huang and Lee, 2013). This algorithm is used in this study and it is described briefly as follows.
For each short-time frame of speech, a temporal-spectral representation of speech harmonic structures, namely temporally accumulated peak spectrum (TAPS) (Huang and Lee, 2010), is defined as
| (3) |
where ⌊·⌋ is the floor function. pk is the peak spectrum vector of the kth frame. It is obtained by retaining only the peaks of the DFT magnitude spectrum and setting the other magnitudes to zero. K is the number of frames over which the peak spectrum vectors are accumulated. In the TAPS representation, harmonic-related peaks are concentrated around the fundamental frequency and its multiples, while noise peaks are irregularly located with relatively small magnitudes.
Let A = [p̄1 p̄2 ⋯ p̄N], A ∈ ℛM×N and N ≫ M, be a prior information matrix representing a large and complete set of peak spectrum exemplars that are obtained from clean speech. Based on Eq. (3), an observed TAPS vector y can be represented as a sparse linear combination of the exemplars, i.e.,
| (4) |
where x ∈ ℛN is a sparse weight vector, with most of its elements being 0. The number of non-zero elements in x depends on the coverage of A and is related to the number of accumulated frames K. v represents the noise Effect in the peak spectrum domain. The algorithm for estimating x is provided in Appendix A. In this study, we assume v is Gaussian distributed with mean vector 0 and identity covariance matrix.
With the estimated weights x̂ = [x̂1 x̂2 ⋯ x̂N]T, the harmonic structure in y can be analyzed in terms of the non-zero elements in x̂, and hence a set of pitch candidates are obtained. Each pitch candidate has a corresponding weight. The candidate with the highest weight can be taken as the pitch estimation result. In addition, a confidence measure for the estimated pitch can be defined as (Huang and Lee, 2012b),
| (5) |
where x̂* is the weight associated with the estimated pitch. The larger the Pc, the more confident the estimation.
3. Speech periodicity enhancement
3.1. Periodic-aperiodic decomposition
As illustrated in Fig. 2, with the estimated pitch track, the LP residual signal is time-warped to be of constant pitch period. By the two-stage transforms, the signal energy is concentrated in the transform coefficients of the low modulation bands. The transform coefficients of the first modulation band represent the periodic component of the signal, while the remaining coefficients describe the aperiodic component. This can be easily understood by considering a strictly periodic signal. In such a signal, all pitch-synchronous frames are identical by definition. Hence applying the first-stage transform lead to the same results, i.e., f(i, l) = f(j, l) for i, j = 0, 1, ⋯, Q − 1 and l = 0, 1, ⋯, P0 − 1. This means that the subsequent modulation transform is applied to a constant data sequence. As a result, there is only one non-zero coefficient, which is in the first modulation band. This property suggests that periodic-aperiodic decomposition can be achieved by separating the low modulation band coefficients from the others.
3.2. Periodicity enhancement by transform coefficient weighting
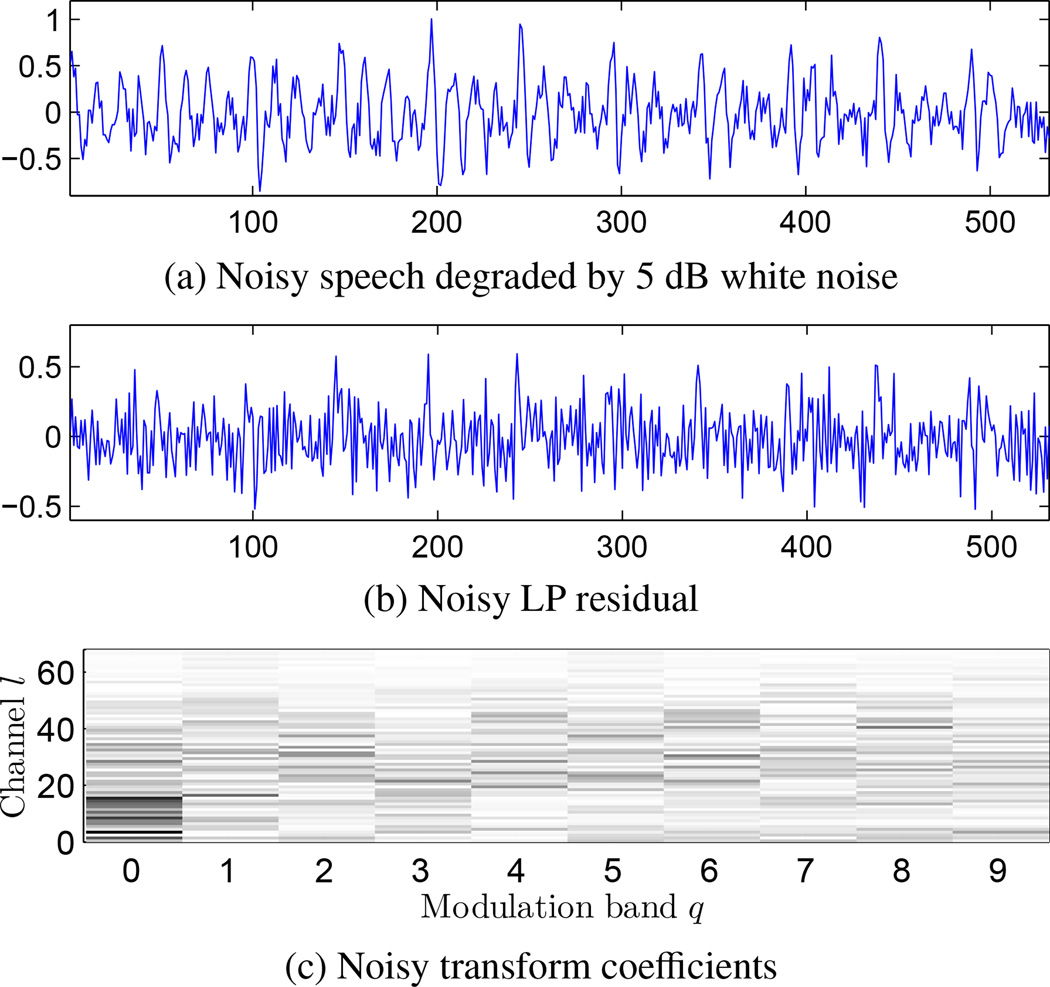
In the presence of additive noise, the waveform periodicity of a speech signal is contaminated. Let us investigate how the transform-domain coefficients are affected by noise via the example in Fig. 3. Fig. 3a shows the waveform of a noise-corrupted speech segment, which is obtained by adding white noise to the clean segment in Fig. 2a. The SNR is 5dB. Fig. 3b shows the LP residual signal extracted from the noisy speech. Using the pitch track estimated from clean speech, we obtain the transform-domain coefficients as depicted in Fig. 3c. Comparing Fig. 3c with Fig. 2d, it is observed that the noise leads to an increase of energy in the high bands. However, there is still a high level of energy concentration in the first modulation band, which contains the periodic component.
Figure 3.
Effect of noise on transform coefficients (Huang et al., 2010).
As demonstrated in (Huang et al., 2010), we can restore the periodicity of noise-corrupted speech by adjusting energy balance among the modulation bands. That is, larger weights are assigned to the transform coefficients from the lower bands and smaller weights to the higher bands. Let wq denote the weighting factor for modulation band q. The modified transform coefficient ĝ(q, l) is obtained as
| (6) |
The enhanced residual signal is synthesized from ĝ(q, l).
There are many different ways of assigning the value of wq. For example, a set of empirical weights can be defined as
| (7) |
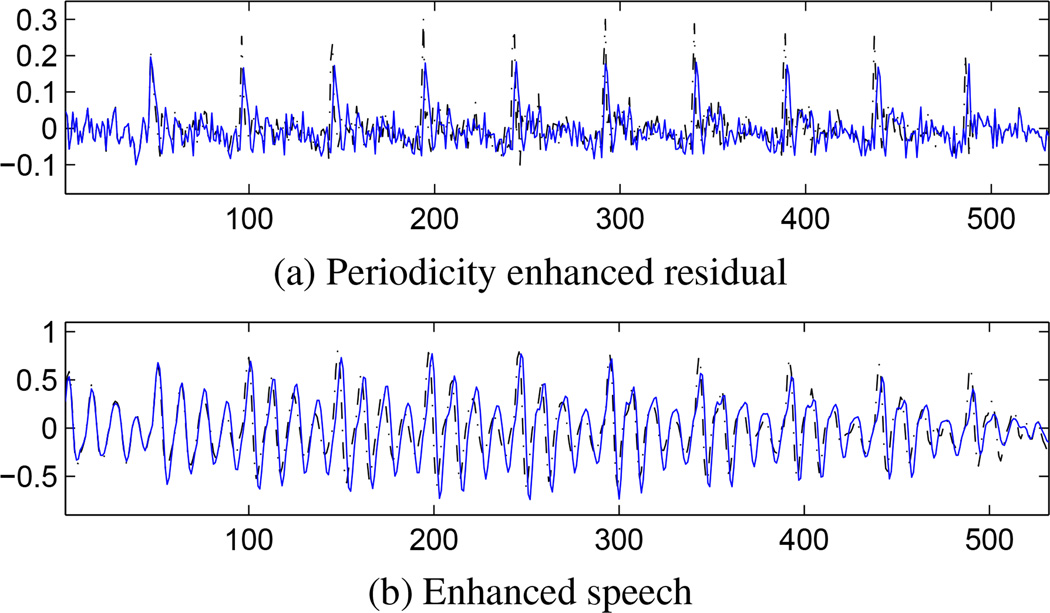
i.e., w0 = 1, w1 = 2/3, w2 = 1/3, and wq = 0 for q ≥ 3. By applying these empirical weights on the example of Fig. 3, we obtain the enhanced LP residual and the synthesized speech waveform as in Fig. 4. By comparing Fig. 3a with 4b and Fig. 3b with 4a, it can be observed that the additive noise is noticeably suppressed and the speech waveform periodicity is Effectively restored.
Figure 4.
Periodicity enhanced residual and speech waveforms. (Blue solid: enhanced signal; Black dashed: the clean counterpart.) (Huang et al., 2010)
4. Adaptive coefficient weights
Natural speech contains both voiced and unvoiced speech. For an unvoiced speech segment, the signal energy is distributed across the high modulation bands, because the signal is not periodic. The empirical coefficient weights in Eq. (7) would cause undesirable attenuation of unvoiced speech and introduce artificial periodicity in the enhanced residual signal. On the other hand, the accuracy of pitch estimation declines as the SNR decreases. With erroneous pitch track, the energy of the periodic component may leak to the high modulation bands and get attenuated if the simple empirical weights are applied. As a result, significant perceptual distortion would be caused in the synthesized speech output.
To properly handle unvoiced speech and alleviate the negative Effects of pitch estimation errors, an adaptive scheme is developed to determine the coefficient weights of different modulation bands. The weights are dynamically adjusted according to the degree of voicing and the pitch estimation confidence.
4.1. Degree of voicing
It is not a trivial task to distinguish voiced speech from unvoiced speech. Numerous algorithms of unvoiced-voiced decision (UVD) were proposed (Siegel and Bessey, 1982; Krubsack and Niederjohn, 1991; Fisher et al., 2006). In general, an UVD algorithm can be regarded as a binary classifier, where the classification problem is solved by setting thresholds for specific acoustic features related to voicing, for examples, zero-crossing rate, short-time energy, and/or median values of cepstrum peaks. A detection accuracy of 78% with white Gaussian noise at 0 dB SNR was reported in Fisher et al. (2006).
In this study, we propose to measure the degree of voicing based on the transform-domain energy concentration property as discussed in Section 3.1. It is assumed that the energy of voiced speech is concentrated mostly in the first modulation band, while the energy of unvoiced speech is not concentrated in any specific band. The signal energy in the first modulation band is given by
| (8) |
Let ξ be the root-mean-square (RMS) value of the signal segment. The normalized energy of the first modulation band is computed as (Huang et al., 2011),
| (9) |
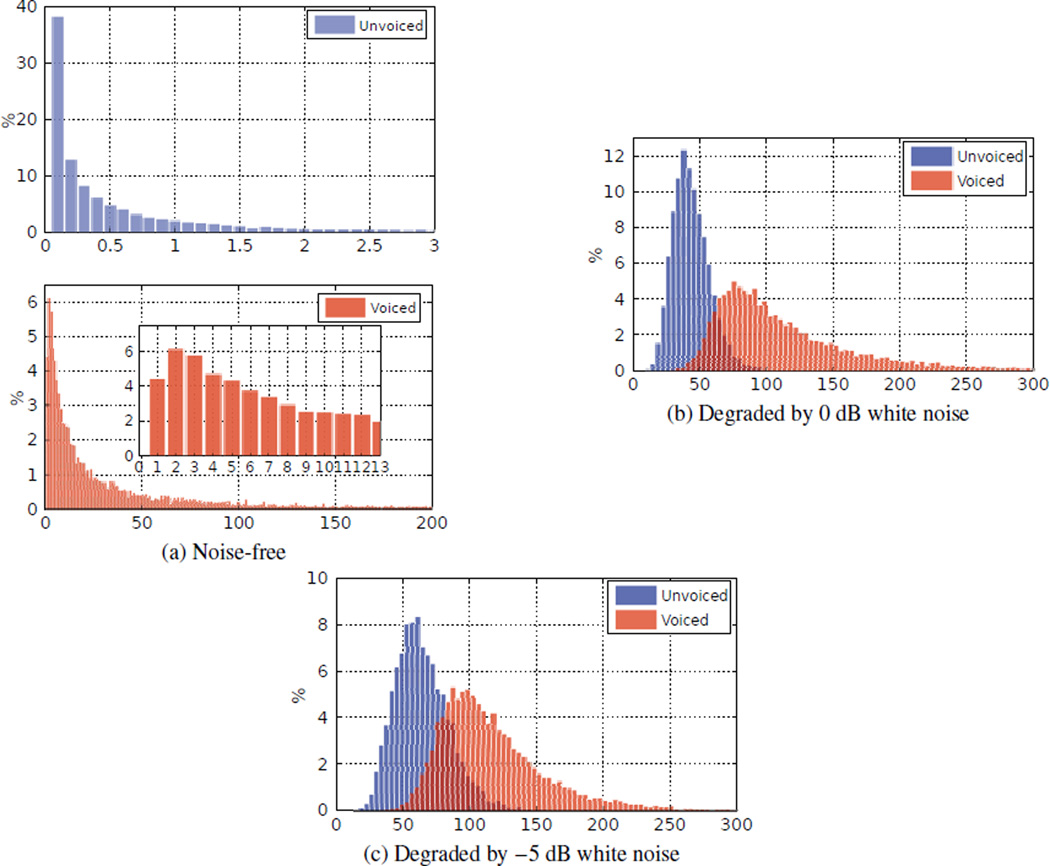
A large value of Ẽ1st implies that the speech segment tends to be voiced. This can be shown by analyzing a database of 40 speech utterances with and without additive noise. The statistical distributions of Ẽ1st are shown by the histograms in Fig. 5. Table 1 gives the detection accuracy (ACC) and the corresponding decision boundary (BND) of Ẽ1st. It can be seen that Ẽ1st is Effective in discriminating voiced and unvoiced speech, even at −5 dB SNR. The accuracy at 0 dB SNR is about the same as the noise-free case.
Figure 5.
Histogram of Ẽ1st (Huang et al., 2011)
Table 1.
Accuracy of UVD based on Ẽ1st and decision boundary (white noise) (Huang et al., 2011)
| Clean | 0 dB | −5 dB | |||
|---|---|---|---|---|---|
| BND | ACC | BND | ACC | BND | ACC |
| 1.5 | 91.0% | 58.5 | 90.6% | 73.0 | 83.1% |
4.2. Pitch estimation confidence
In Section 2.2, the pitch estimation confidence Pc is defined as in Eq. (5). The Effectiveness of Pc is investigated by analyzing the same set of speech utterances as in Section 4.1.
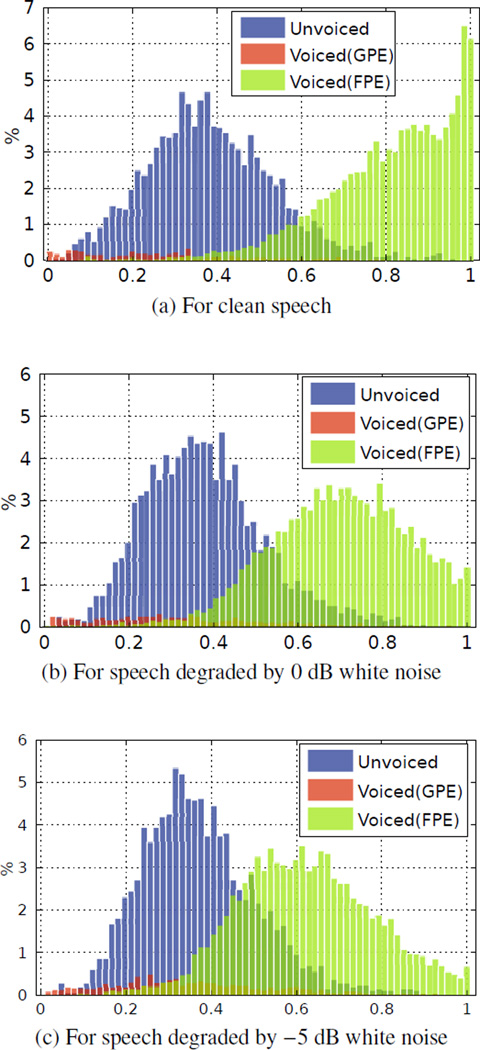
Estimated pitch is obtained for each short-time signal frame. Estimated pitch values of voiced frames are divided into two types: gross pitch error (GPE) and fine pitch error (FPE) (Rabiner et al., 1976). If the estimated pitch is within a close proximity of the true value (Huang and Lee, 2012a), it is referred to as FPE. Otherwise, it is referred as GPE.
The distributions of Pc for clean and noisy speech are shown by the histograms in Fig. 6. Note that unvoiced speech frames are included in the distributions. For clean speech (Fig. 6a), the values of Pc from FPE frames are large and approach to 1. The values of Pc tend to be small for voiced GPE frames and unvoiced frames. In the presence of noise (Fig. 6b and 6c), the values of Pc for FPE frames decrease as the SNR decreases. The distribution of Pc for unvoiced frames does not show a significant change. The FPE frames are highly distinguishable from the others.
Figure 6.
Distributions of pitch estimation confidence Pc. The histograms of unvoiced frames are normalized by the total number of unvoiced frames. The histograms of GPE and FPE frames are normalized by the total number of voiced frames (Huang and Lee, 2012b).
Pc is utilized to perform the following two classification tasks:
| FPE–(GPE+U) | FPE frames versus GPE plus unvoiced frames; |
| FPE–GPE | voiced FPE frames versus voiced GPE frames. |
The classification accuracy and the corresponding optimal decision boundary are shown as in Table 2.
Table 2.
Detection accuracy and corresponding decision boundary of Pc (Huang and Lee, 2012b)
| Task | Clean | 0 dB | −5 dB | |||
|---|---|---|---|---|---|---|
| BND | ACC | BND | ACC | BND | ACC | |
| FPE–(GPE+U) | 0.52 | 92.5% | 0.47 | 88.6% | 0.41 | 84.5% |
| FPE–GPE | 0.35 | 97.3% | 0.35 | 95.2% | 0.34 | 92.8% |
4.3. Adaptive weighting scheme
Based on the discussions above, we propose an adaptive scheme for assigning coefficient weights to achieve periodicity enhancement. For signal segments with large values of Ẽ1st and Pc, heavier weights are assigned to the low modulation bands so that the periodic component is emphasized. For signal segments that have low degree of voicing or low confidence on the estimated pitch, the coefficient weights are set to reduce the Effect of noise and at the same time preserve the original signal composition. The adaptive weighting scheme is formulated as,
| (10) |
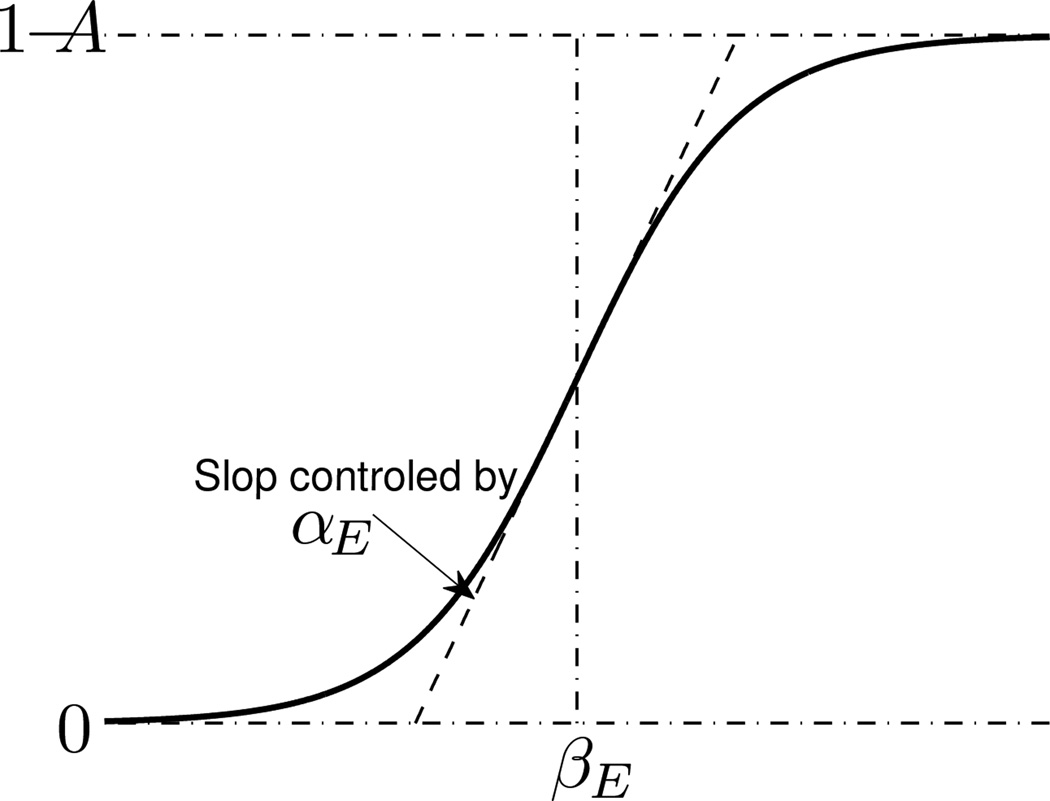
where P̄c is the average Pc over all frames in the signal segment. s1(·, ·) and s2(·, ·) are functions of Ẽ1st and P̄c that control the balance between periodicity enhancement and signal preservation. For enhancing waveform periodicity, the output values of s1 are set to be close to 1. The values of s2 are negative, meaning that wq would decrease as q increases. For the purpose of retaining existing signal components across all modulation bands, s1 generates positive values smaller than 1, and s2 is made close to 0. s2 = 0 implies the same degree of energy attenuation for all bands. In this study, s1(·, ·) and s2(·, ·) are defined based on the sigmoid function, i.e.,
| (11) |
| (12) |
where the parameters αE and βE are used to control the transition range and center of Ẽ1st, αP and βP to control the transition range and center of P̄c, and 0 ≤ A < 1. Figure 7 gives an illustration of the function . In Eq. (11) and (12), wE > 0 and wP > 0, with wE + wP = 1, are the fusion weights for Ẽ1st and P̄c, respectively. When the pitch estimation confidence P̄c is very small or very large, we assign a higher fusion weight to the contribution of P̄c
| (13) |
Table 3 demonstrates the typical values of s1(Ẽ1st, P̄c) and s2(Ẽ1st, P̄c) given by Eq. (11) and (12).
Figure 7.
Illustration of the sigmoid function .
Table 3.
Typical values of s1(Ẽ1st, P̄c) and s2(Ẽ1st, P̄c).
| Periodicity Enhancement | → | Noise Reduction | ||
|---|---|---|---|---|
| s1(Ẽ1st, P̄c) | 1 | → | A | |
| s2(Ẽ1st, P̄c) | → | 0 |
To apply the above scheme, the parameters, αE αP, βE, βP and A, need to be set. As seen from Fig. 7, αE and αP control respectively the transition ranges for Ẽ1st, and P̄c, where intermediate weights between periodicity enhancement and noise reduction are assigned. αE and αP are set so that the transition ranges are reasonable, i.e., neither too wide nor too narrow. The values of αE and αP are also related to the numerical value range of Ẽ1st, and P̄c, respectively. Based on the observation on the numerical values of Ẽ1st and P̄c (cf. Table 1 and 2), we empirically set αE = 0.1 and αP = 23. βE and βP correspond to the boundaries between periodicity-enhancement scenario and noise-reduction scenario. If SNR is known, βE and βP could be optimally set to the decision boundaries as shown in Table 1 and 2. However, in this study we do not assume prior knowledge of the input SNR. In the experiments (Session 6), βE and βP are set as the average of Ẽ1st and P̄c of the silent segments, respectively. The parameter A determines the degree of signal attenuation for segments with low degree of voicing or low pitch estimation confidence. To attenuate noise, A could be set as small as possible. However, small A would also attenuate the desired speech components. Recall that the above weighting process is applied to the LP residual signal. To generate the output speech, estimated LP coefficients and LP residual gain are applied as well. The estimated residual gain also plays an important role in reducing the noise. Therefore, we consider a moderate value for A and experimentally set A = 0.5 for the evaluation in Section 6. We will demonstrate the system performance with different values of A at the end of Section 6.2
5. Implementation Aspects
5.1. Segmentation and boundary smoothing
As discussed in Section 2.1, the LP residual signal for an input utterance needs to be segmented based on an energy concentration criterion. For speech coding, non-overlapping segments are preferred. In the proposed system of periodicity enhancement, since the coefficient weights are different from one segment to the other, discontinuities of energy level are likely to appear at the segment boundaries. To address this problem, an overlapping of two pitch-synchronized frames is imposed between neighboring segments. At the synthesis stage, signals at segment boundaries are smoothed by overlap-and-add with trapezoid windows.
5.2. LP coefficient estimation
The LP filter coefficients capture the short-term dependencies that are caused by vocal tract resonances. They are very important to the quality of synthesized speech. The problem of estimating LP parameters from noisy speech has been studied for years. The approaches include noise compensation (Kay, 1980; Davila, 1998), codebook-driven estimation (Kuropatwinski and Kleijn, 2010; Srinivasan et al., 2006) and Kalman filtering (Gibson et al., 1991; Kuropatwinski and Kleijn, 2006). In this study, the codebook-driven approach (Kuropatwinski and Kleijn, 2010) and the iterative Kalman filtering approach (Gibson et al., 1991) are adopted for the generation of enhanced speech. The codebook method is data-driven, where the LP filter coefficients are estimated by searching over pre-trained codebooks of clean speech and noise for a codeword pair that has the highest probability to produce the noisy observation. In the Kalman filter approach, the filter coefficients are estimated iteratively. Each frame of speech is first enhanced by the Kalman filter that is initialized using noisy speech. A set of new coefficients are then estimated from the enhanced speech. The process goes on iteratively until convergence is reached (Gibson et al., 1991).
6. Experiments
The performance of the proposed method is evaluated in two aspects: (1) the Effectiveness of periodicity enhancement on LP residual signals, and (2) the overall performance of speech periodicity enhancement with estimated LP parameters. The evaluation data consists of a total of 48 speech utterances from 3 different languages: American English, Mandarin and Cantonese. While English is used to represent western languages, Mandarin and Cantonese are among the most representative tonal languages, in which pitch is used to differentiate words. There are 16 utterances (equal number of male and female speakers) for each language. They are taken from TIMIT (English), 863 (Mandarin) and CUSENT (Cantonese), respectively. Mean utterance duration is about 4–5 seconds. Speech activity ratio1 of the data set is 85% on average. Speech signals were down-sampled to 8 kHz. Twelfth-order LP analysis is applied to obtain the residual signals. The analysis frame is 20 ms long, with 50% overlap.
6.1. Evaluation of periodicity enhancement on LP residuals
In the first experiment, speech signals are degraded by two types of noise: white noise and first-order AR noise (simulating car noise (Kuropatwinski and Kleijn, 2006)), at SNR of −5, 0 and 5 dB, respectively. Periodicity enhancement is performed on the noisy LP residual signals.
We use the Mean Segmental Harmonicity (SegHarm) (Yu and Wang, 2004) and the global SNR of the residual signal as the performance indices. SegHarm measures the overall energy ratio between the harmonic peaks and their surrounding noise in the target signal. It is computed from all voiced segments of the utterances.
Three kinds of pitch are involved in the evaluations:
| pitch is obtained from clean speech using time-domain autocorrelation method, and manually verified with the waveform epochs. is treated as the true pitch, and used as reference for computing SegHarm. With this reference pitch, avarage SegHarm value of the clean residual signals of the evaluation data is 1.89. | ||
| pitch estimated from clean speech using the algorithm described in Section 2.2. | ||
| pitch is estimated from noisy speech using the algorithm described in Section 2.2. |
and are used for periodicity enhancement of the residual signals. Table 4 gives the SegHarm and global SNR of the residual signals before and after the enhancement. Significant improvements can be observed on both types of noise at all input SNR levels. The average value of SegHarm increases from 0.94 to 1.66 and 1.43, when and are used respectively.
Table 4.
Performance of periodicity enhancement on LP residual signals under different input noise conditions.
| Noise & Input Speech SNR(dB) |
Residual SegHarm | Residual SNR (dB) | |||||
|---|---|---|---|---|---|---|---|
| Noisy | Enhanced() | Enhanced() | Noisy | Enhanced() | Enhanced() | ||
| White Noise | 5 | 1.30 | 2.10 | 1.95 | −7.87 | −1.17 | −1.21 |
| 0 | 1.06 | 1.80 | 1.57 | −12.27 | −3.16 | −3.56 | |
| −5 | 0.74 | 1.47 | 1.12 | −16.67 | −6.94 | −7.79 | |
| AR Noise | 5 | 1.14 | 1.83 | 1.59 | −4.46 | 1.84 | 1.27 |
| 0 | 0.83 | 1.54 | 1.26 | −8.10 | −1.88 | −2.86 | |
| −5 | 0.60 | 1.23 | 1.07 | −12.71 | −4.09 | −5.10 | |
| mean | 0.94 | 1.66 | 1.43 | −10.35 | −2.32 | −2.96 | |
6.2. Objective quality assessment of enhanced speech
We also evaluate the quality of periodicity enhanced speech. Enhanced speech obtained with the following methods /settings are compared:
| KF | Iterative Kalman filtering (Gibson et al., 1991) (without enhancing the LP residual); |
| KF+PE | Iterative Kalman filtering + Periodicity enhanced LP residual; |
| CB | Codebook-driven LP parameter estimation (Kuropatwinski and Kleijn, 2010) (without enhancing the LP residual); |
| CB+PE | Codebook-driven LP parameter estimation + Periodicity enhanced LP residual; |
| CleanLP+PE | Clean LP parameters + Periodicity enhanced LP residual; |
| CombF | Comb-filter method (Nehorai and Porat, 1986). |
The speech utterances are corrupted by additive AR noise at 0 dB SNR. is used for residual enhancement. For codebook-based LP parameter estimation, the speech codebooks are language-dependent. For each language, 24 utterances that are different from the test data are used to train a codebook with 2048 codewords. The size of noise codebook is 48. It is trained with a noise signal of 2-second length.
Global SNR, frequency-weighted segmental SNR (fwSegSNR), cepstrum distance (CEP) and the perceptual evaluation of speech quality (PESQ) are used as quality measures (Hu and Loizou, 2008). The results are shown in Table 5. It can be seen that both approaches of LP parameter estimation (CB and KF) can improve the speech quality to certain extent. CB is more Effective than KF. With periodicity enhancement of residual signals, the speech quality is further improved. The PESQ value attained by CB+PE is 2.57, as compared to 1.93 by CB and 1.71 by CompF. The PESQ value of CleanLP+PE, i.e., 3.16, can be considered as the performance upper bound of the proposed approach in this noise condition.
Table 5.
Performance of the evaluated speech enhancement methods.
| SNR (dB) |
fwSNRseg (dB) |
CEP | PESQ | |
|---|---|---|---|---|
| Input | 0 | 3.27 | 6.10 | 1.49 |
| KF | 2.13 | 4.28 | 5.15 | 1.68 |
| CB | 3.97 | 6.22 | 4.60 | 1.93 |
| KF+PE | 2.45 | 5.27 | 4.83 | 2.02 |
| CB+PE | 4.89 | 7.39 | 4.34 | 2.57 |
| CleanLP+PE | 4.98 | 10.30 | 2.50 | 3.16 |
| CombF | 2.88 | 3.98 | 5.92 | 1.71 |
Table 6 compares the performance between the fixed weights (Eq.(7)) and the adaptive weights (Eq.(10)) for periodicity enhancement (CB+PE). It is clearly shown that the adaptive coefficient weighting is more Effective than the simple fixed weight method.
Table 6.
Comparison of fixed weights and adaptive weights (CB+PE).
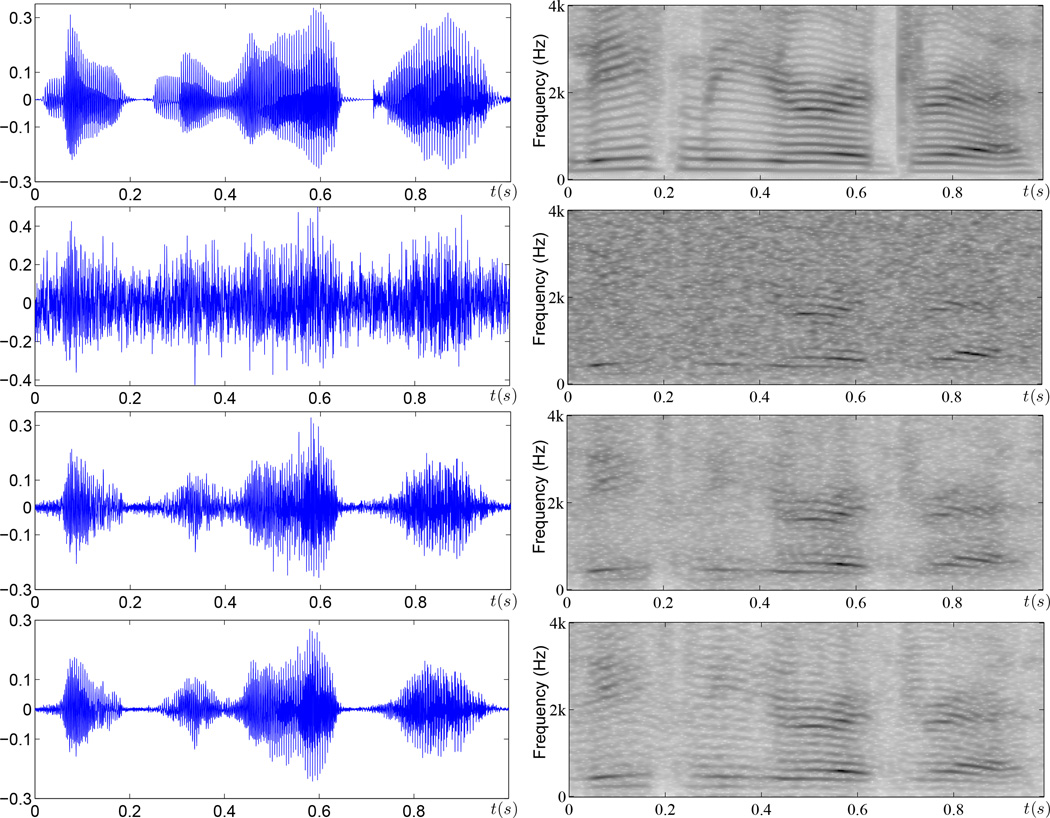
Fig. 8 gives an example that shows the waveform and spectrograms of speech output enhanced by CB and CB+PE. It can be seen that CB is useful to recover the formant structure. With the use of periodicity enhanced residual signal, the harmonic structure can be Effectively restored. This is especially noticeable in the high-frequency region.
Figure 8.
Waveforms and spectrograms of clean, noisy(0dB, AR noise), CB enhanced and CB+PE enhanced speech (from top to bottom). Audio samples are available at http://www.ee.cuhk.edu.hk/~fhuang/pe_jnl.html.
Table 7 shows the performance of CB+PE with different values of A for the adaptive weighting. The parameter A (0 ≤ A < 1) in Eq. (11) controls the degree of signal attenuation for segments with low degree of voicing or low pitch estimation confidence. From the results, it can be seen that system performance degrades when A becomes too small (0.1) or too large (0.9). This is because small A largely attenuates noise as well as desired speech components, while large A preserves desired signal but is in Effective in reducing noise. A = 0.5 gives a good trade-off between noise reduction and desired signal preservation.
Table 7.
System performance (CB+PE) with different values of A for Eq (11).
| A | 0.1 | 0.3 | 0.5 | 0.7 | 0.9 |
|---|---|---|---|---|---|
| SNR | 4.27 | 4.70 | 4.89 | 4.65 | 4.43 |
| PESQ | 2.12 | 2.41 | 2.57 | 2.58 | 2.20 |
7. Conclusions and discussion
A novel framework of speech enhancement has been proposed and evaluated. It has been shown that enhancement of speech and/or suppression of noise can be Effectively achieved by processing the LP parameters and the residual signal separately. The focus of this paper is on enhancing the pitch-related periodicity characteristic in the residual signal. With pitch track robustly estimated from noisy speech, the proposed method demonstrates significant improvement in both the signal-to-noise ratio and the perceptual quality of speech.
The importance of waveform periodicity for different languages could be different. In our previous study (Huang et al., 2010), subjective listening test indicates that the proposed periodicity enhancement approach tends to be more Effective for tonal languages than non-tonal languages. One future direction is to systematically evaluate the benefits of periodicity enhancement for different languages.
Acknowledgment
This research was partially supported by the General Research Funds (Ref: CUHK 413507 & CUHK 414108) from the Hong Kong Research Grants Council, a project grant from the Shun Hing Institute of Advanced Engineering, CUHK, the research grant (NIH/NIDCD R01-DC012300) from National Institute of Health, USA, the Shenzhen Basic Research Grant (JCYJ20120831091405139) from the Shenzhen government of China, and the Shenzhen Municipal Engineering Laboratory of Speech Rehabilitation Technology
Appendix A. Estimation of the sparse weights
For the sparse representation in Eq. (4), assume that the probability distribution function of v can be described by a mixture of Gaussians, i.e.,
| (A.1) |
where μi and Σi are the mean vector and covariance matrix of the ith Gaussian component. x is estimated so that the likelihood of y is maximized. This is done by minimizing the following negative log-likelihood function,
| (A.2) |
In general, fml(Ax) is not convex. Since − log(·) is convex and with zi > 0, it can be derived that (Huang and Lee, 2013)
| (A.3) |
where
| (A.4) |
with . ful(Ax) is a quadratic function of x. Given z̄i > 0 and Σi ≻ 0, the quadratic function is convex. So x is obtained by
| (A.5) |
The parameter γ is set according to the number of accumulated frames in the computation of TAPS.
Footnotes
Parts of this research were presented at the 2010 European signal processing conference in Denmark, August 23–27, 2010 (Huang et al., 2010), and the 2011 IEEE international symposium on intelligent signal processing and communication systems in Tailand, December 7–9, 2011 (Huang et al., 2011).
Duration of speech (excluding silence) over duration of the whole utterance.
Contributor Information
Huang Huang, Email: fhuang@ee.cuhk.edu.hk.
Tan Lee, Email: tanlee@ee.cuhk.edu.hk.
W. Bastiaan Kleijn, Email: bastiaan.kleijn@ecs.vuw.ac.nz.
Ying-Yee Kong, Email: yykong@neu.edu.
References
- Cardozo B, Ritsma R. On the perception of imperfect periodicity. IEEE Trans. on Audio and Electroacoustics. 1968;16(2):159–164. [Google Scholar]
- Davila CE. A subspace approach to estimation of autoregressive parameters from noisy measurements. IEEE Trans. Signal Process. 1998 Feb;46(2):531–534. [Google Scholar]
- Fisher E, Tabrikian J, Dubnov S. Generalized likelihood ratio test for voiced-unvoiced decision in noisy speech using the harmonic model. IEEE Trans. Audio, Speech, Language Process. 2006 Mar;14(2):502–510. [Google Scholar]
- Gibson JD, Koo B, Gray SD. Filtering of colored noise for speech enhancement and coding. IEEE Trans. Signal Process. 1991 Aug;39(8):1732–1742. [Google Scholar]
- Hu Y, Loizou PC. Evaluation of objective quality measures for speech enhancement. IEEE Trans. Audio, Speech, Language Process. 2008 Jan;16:229–238. [Google Scholar]
- Huang F, Lee T. Pitch estimation in noisy speech based on temporal accumulation of spectrum peaks. Proc. Interspeech 2010. 2010:641–644. [Google Scholar]
- Huang F, Lee T. Robust pitch estimation using l1-regularized maximum likelihood estimation. Proc. Interspeech 2012. 2012a Sep [Google Scholar]
- Huang F, Lee T. Sparsity-based confidence measure for pitch estimation in noisy speech. Proc. IEEE Int. Conf. Acoust., Speech, Signal Process. 2012. 2012b Mar;:4601–4604. [Google Scholar]
- Huang F, Lee T. Pitch estimation in noisy speech using accumulated peak spectrum and sparse estimation technique. IEEE Trans. Audio, Speech, Language Process. 2013 Jan;21(1):99–109. [Google Scholar]
- Huang F, Lee T, Kleijn W. A method of speech periodicity enhancement based on transform-domain signal decomposition. Proc. EUSIPCO 2010. 2010 Aug;:984–988. doi: 10.1016/j.specom.2014.12.001. [DOI] [PMC free article] [PubMed] [Google Scholar]
- Huang F, Lee T, Kleijn W. Transform-domain speech periodicity enhancement with adaptive coefficient weighting; Proc. 2011 International Symposium on Intelligent Signal Processing and Communications Systems (ISPACS); 2011. Dec, pp. 1–5. [Google Scholar]
- Kay S. Noise compensation for autoregressive spectral estimates. IEEE Trans. Acoust., Speech, Signal Process. 1980 Jun;28(3):292–303. [Google Scholar]
- Kleijn WB. A frame interpretation of sinusoidal coding and waveform interpolation. Proc. IEEE Int. Conf. Acoust, Speech, Signal Process 2000. 2000;3:1475–1478. [Google Scholar]
- Krubsack D, Niederjohn R. An autocorrelation pitch detector and voicing decision with confidence measures developed for noisecorrupted speech. IEEE Trans. Signal Process. 1991 Feb;39(2):319–329. [Google Scholar]
- Kuropatwinski M, Kleijn WB. Estimation of the short-term predictor parameters of speech under noisy conditions. IEEE Trans. ASLP. 2006 Sep;14(5):1645–1655. [Google Scholar]
- Kuropatwinski M, Kleijn WB. Estimation of the excitation variances of speech and noise AR-models for enhanced speech coding. Proc. IEEE Int. Conf. Acoust, Speech, Signal Process. 2001. 2010;1:669–672. [Google Scholar]
- Nehorai A, Porat B. Adaptive comb filtering for harmonic signal enhancement. IEEE Trans. Acoust., Speech, Signal Process. 1986;34(5):1124–1138. [Google Scholar]
- Nilsson M. Ph.D. thesis. Royal Institute of Technology (KTH); 2006. Entropy and speech. [Google Scholar]
- Plapous C, Marro C, Scalart P. Speech enhancement using harmonic regeneration. Proc. IEEE Int. Conf. Acoust., Speech, Signal Process. 2005. 2005 Mar 18–23;1:157–160. [Google Scholar]
- Plapous C, Marro C, Scalart P. Improved signal-to-noise ratio estimation for speech enhancement. IEEE Trans. Acoust., Speech, Signal Process. 2006 Nov;14(6):2098–2108. [Google Scholar]
- Rabiner L, Cheng M, Rosenberg A, McGonegal C. A comparative performance study of several pitch detection algorithms. IEEE Trans. Acoust., Speech, Signal Process. 1976 Oct;24:399–418. [Google Scholar]
- Siegel L, Bessey A. Voiced/unvoiced/mixed excitation classification of speech. IEEE Trans. Acoust., Speech, Signal Process. 1982 Jun;30(3):451–460. [Google Scholar]
- Srinivasan S, Samuelsson J, Kleijn W. Codebook driven short-term predictor parameter estimation for speech enhancement. IEEE Trans. Audio, Speech, Language Process. 2006;14(1):163–176. [Google Scholar]
- Yegnanarayana B, Avendao C, Hermansky H, Murthy PS. Speech enhancement using linear prediction residual. Speech Commun. 1999;28(1):25–42. [Google Scholar]
- Yegnanarayana B, Murthy P. Enhancement of reverberant speech using LP residual signal. IEEE Trans. Speech, Audio Process. 2000 May;8(3):267–281. [Google Scholar]
- Yu A-T, Wang H-C. New speech harmonic structure measure and it application to post speech enhancement. Proc. IEEE Int. Conf. Acoust., Speech, Signal Process. 2004. 2004 May 17–21;1 I–729–32. [Google Scholar]
- Yuan M, Lee T, et al. Effect of temporal periodicity enhancement on cantonese lexical tone perception. Journal of the Acoustical Society of America. 2009;126(1):327–337. doi: 10.1121/1.3117447. [DOI] [PubMed] [Google Scholar]
- Zavarehei E, Vaseghi S, Yan Q. Noisy speech enhancement using harmonic-noise model and codebook-based post-processing. IEEE Trans. Audio, Speech, Language Process. 2007 May;15(4):1194–1203. [Google Scholar]


