

Abstract
Objective
While visually marking the high frequency oscillations in the stereo-EEG of epileptic patients, we observed a continuous/semicontinuous activity in the ripple band (80–250 Hz), which we defined continuous High Frequency Activity (HFA). We aim to analyze in all brain regions the occurrence and significance of this particular pattern.
Methods
Twenty patients implanted in mesial temporal and neocortical areas were studied. One minute of slow-wave sleep was reviewed. The background was classified as continuous/semicontinuous, irregular, or sporadic based on the duration of the fast oscillations. Each channel was classified as inside/outside the seizure onset zone (SOZ) or a lesion.
Results
The continuous/semicontinuous HFA occurred in 54 of the 790 channels analyzed, with a clearly higher prevalence in hippocampus and occipital lobe. No correlation was found with the SOZ or lesions. In the occipital lobe the continuous/semicontinuous HFA was present independently of whether eyes were open or closed.
Conclusions
We describe what appears to be a new physiological High Frequency Activity, independent of epileptogenicity, present almost exclusively in the hippocampus and occipital cortex but independent of the alpha rhythm.
Significance
The continuous HFA may be an intrinsic characteristic of specific brain regions, reflecting a particular type of physiological neuronal activity.
Keywords: High Frequency Activity, HFOs, SEEG, Neocortical regions, Intracerebral electrodes
1. Introduction
High Frequency Oscillations (HFOs), usually separated in ripples (80–250 Hz) and fast ripples (250–500 Hz), are brief and transient electrographic patterns clearly standing out from the rest of the high-pass filtered EEG background. Physiological and pathological HFOs have been described in brains of normal rats, animal models of mesial temporal lobe epilepsy, and humans.
Physiological HFOs, consolidating the synaptic plasticity in hippocampal and parahippocampal structures, are important for episodic memory (Buzsaki, 2006). Normal HFOs can also be stimulus-evoked by visual (Nagasawa et al., 2012) and somatosensory stimuli (Hashimoto, 2000). Pathological HFOs were first recorded in epileptic patients with electrodes implanted in the temporal regions and in experimental rat models of epilepsy in studies performed with intracranial microwires (40 μm in diameter) (Bragin et al., 1999). HFOs were successively described in stereo-EEG (SEEG) of epileptic patients acquired using clinical macroelectrodes (surface contact: 0.8 mm2), occurring during the ictal phase particularly in the seizure onset zone (SOZ) (Jirsch et al., 2006). Further studies showed that HFOs can be recorded in the interictal phase, still more commonly in the SOZ (Urrestarazu et al., 2007; Jacobs et al., 2008; Worrell et al., 2008); they can be linked to epileptogenic lesions (Staba et al., 2007), being non-specific to a particular type of lesion, representing epileptogenicity per se (Jacobs et al., 2009); they appear to predict the outcome after epilepsy surgery, in adults (Jacobs et al., 2010) as in children (Wu et al., 2010). HFOs are not confined to mesial temporal structures, occurring also in neocortical regions, usually at lower rates (Urrestarazu et al., 2007).
The rate of occurrence of HFOs is variable, but can reach 100/minute. The visual marking of HFOs is highly time-consuming, and an automatic detection would be necessary to perform systematic studies involving large amounts of data. In developing an automatic HFO detection system at the Montreal Neurological Institute (MNI), we sought to define the background as sections of SEEG devoid of oscillatory activity, defining HFOs as oscillations standing out from such a non-oscillatory activity. This was implemented by measuring the entropy of the signal: the more oscillatory a signal is, independently of the frequency of oscillation and of amplitude, the lower the entropy. In some channels, it was impossible to find SEEG sections with high entropy, indicating a relatively continuous oscillatory signal. A visual examination revealed the presence of a continuous or semi-continuous oscillatory activity in the ripple band, which we defined as continuous High Frequency Activity (HFA). Focusing our analysis on the mesial temporal structures (MTS) of 24 epileptic patients, we described this pattern mainly in the hippocampus, finding no correlation with the SOZ or a lesion (Mari et al., 2012).
The aim of the present study is to assess the extent of occurrence of the continuous HFA, evaluating the mesial temporal as well as neocortical areas of all brain regions. For each SEEG channel displaying HFA we will define potential correlations with neurophysiological and neuro-radiological features, to define the clinical significance of this particular pattern.
2. Methods
2.1. Subjects
This is a retrospective study in patients with drug-resistant epilepsy who underwent intracranial electrode implantation at the MNI Epilepsy Unit. The decision for SEEG was taken for clinical reasons, when no clear area for seizure onset could be determined with extensive non-invasive evaluation. The electrode placement was tailored for each patient after pre-surgical evaluation including clinical history, seizure semiology, surface EEG, neuroimaging and neuropsychological testing. From the MNI database between 2004 and 2009 51 patients had a SEEG investigation with a 2000 Hz sampling rate (allowing assessment of HFA): after defining the electrode placement for each patient, we selected the first 20 patients that allowed to ensure a population with an extensive and homogeneous coverage of different brain regions, in the mesial temporal structures (amygdala/uncus, anterior hippocampus and middle hippocampus/para-hippocampal gyrus) and neocortical regions (frontal, temporal, parietal and occipital lobe). All patients gave informed consent in agreement with the Research Ethics Board of the MNI.
2.2. Recording methods
Intracranial implantations consisted of combined depth and epidural electrodes placed stereotactically using an image-guidance system (SSN Neuronavigation System, Mississauga, Ontario, Canada) through percutaneous holes drilled in the skull (Olivier et al., 1994). Intracranial depth electrodes were manufactured on site from stainless steel wires, with nine macrocontacts on each electrode and a 5-mm intercontact distance. The contacts were labeled with consecutive numbers, from one (the deepest one) to nine (the most superficial one). The effective surface area of each single deep contact was 0.85 mm2, whereas for the remaining eight contacts was 0.80 mm2. SEEGs were recorded using the Harmonie monitoring system (Stellate, Montréal, Canada). The SEEG was low-pass filtered at 500-Hz and sampled at 2000 Hz. EMG and EOG were also recorded. An epidural reference electrode was placed over the parietal region of the hemisphere contralateral to the main epileptic focus. The SEEG was analyzed in bipolar montages of consecutive contacts. We selected epochs of 10 min of slow-wave sleep, considering that HFOs occur more frequently during this stage (Staba et al., 2004; Bagshaw et al., 2009). We used the Harmonie software to compute spectral trends in the delta, alpha, and beta bands for the intracranial EEG and the power of the chin EMG with a 30-s time resolution. The EEG sections with high delta and low EMG power were visually reviewed and selected as slow-wave sleep. To reduce the influence of seizures, we selected interictal samples at least 2 h before and after a seizure.
2.3. Electrodes localization and channels selection
The electrode localization was defined based on the neurosurgical plan with a 3D Neuronavigation system, a CT after the implantation and a MRI after the explantation. Each electrode was classified as frontal, temporal, parietal, occipital, or parieto-temporo-occipital (P-T-O) if over the boundaries between these three lobes. In the temporal lobe, we distinguished between MTS and neocortical (NC) channels. The temporal electrodes were orthogonally inserted through the middle temporal gyrus in an anterior, mid and posterior location, aiming respectively the amygdala, hippocampus and parahippocampus. This means that the deepest channels were placed in the mesial temporal structures, and considered MTS channels, while the superficial ones were placed in the neocortical temporal region, and classified NC temporal channels. All the channels of the frontal, parietal and occipital electrodes were considered NC channels. We analyzed all the channels of each electrode, rejecting only those outside the brain or showing malfunctions. All channels were defined if inside or outside the SOZ (the area showing the earliest EEG change from baseline prior or concomitant with clinical onset). The seizure onset was determined visually from the unfiltered SEEG by an experienced electroencephalographer. If a patient had a visible brain lesion, the preimplantation Neuronavigation calculations and postexplantation MRI were used to determine which contact of each electrode was included in the lesion.
2.4. HFA background classification
The first minute of the 10 min slow-wave sleep epoch was selected for the visual definition of the HFA background pattern for each channel. Each electrode was separately displayed on the screen: first the interictal spikes were marked using the SEEG settings for clinical review (15 sec/page, 30 μV/mm, LF: 0.3 Hz, HF: 70 Hz), since spikes are traditionally identified with such settings. The background pattern was then visually defined with the SEEG expanded in time (time resolution: 0.92 s/page) and amplitude (1 μV/mm), high-pass filtered at 80 Hz using a finite impulse response filter to minimize ringing. Due to the fact that the HFOs are influenced by spikes, as they are often suppressed immediately after them (Urrestarazu et al., 2006), we excluded from the visual analysis sections of SEEG one second before and after each spike, to avoid interference of spikes in the background classification.
Three different patterns were defined (Mari et al., 2012), based on the length of the oscillations and on the presence of a clear separation between the transient elements: (1) Continuous/Semi-continuous (C/SC): background almost completely occupied by a continuous or semi-continuous high frequency oscillatory activity (oscillatory activities lasting at least 500 ms and separated by less than 100 ms); (2) Irregular (IRR): background activity characterized by the presence of high frequency oscillation lasting more than 200 ms; if the duration is more than 500 ms, then oscillations must be separated by more than 100 ms; if the duration is between 200 and 499 ms, the inter-oscillation period is irrelevant; (3) Sporadic (SP): a type of background characterized by infrequent short-duration (less than 200 ms) oscillations. Examples of backgrounds are shown in Fig. 1. Ripples (R) and fast ripples (FR) were marked following the methodology of previous studies (Jacobs et al., 2008; Zijlmans et al., 2009). The display was split vertically with an 80 Hz high-pass filter on the left side and a 250 Hz high pass-filter on the right side, with the maximum time resolution (0.92 s/page). A ripple was marked if an event was visible on the left (80 Hz) and not on the right (250 Hz). An event was regarded as FR if visible on the right (250 Hz). For the SP and IRR patterns, events containing at least four consecutive oscillations clearly visible above the background signal were regarded as HFOs. In the case of the C/SC pattern, due to the fact that the background itself was completely occupied by a continuous high frequency oscillatory activity, we marked as HFOs only events of amplitude clearly larger than the background (Fig. 1A).
Fig. 1.

Examples of the three different background types: continuous/semicontinuous (A), irregular (B) and sporadic (C). For each pattern the upper trace shows the unfiltered SEEG (LF: 0.3 Hz, HF: 70 Hz); the section in the box is showed at the bottom expanded in time (0.92 s/page) and high-pass filtered at 80 Hz. In the continuous/semicontinuous pattern, the horizontal bar indicates a ripple standing out the rest of the oscillatory background.
2.5. Automatic classification of HFA background
To establish how the visual marking of HFA background was related to a quantitative measure of rhythmicity, we implemented an automatic classifier based on the wavelet entropy of the EEG (Rosso et al., 2001). Wavelet entropy measures the rhythmicity of the signal, independently of its amplitude. The maximum theoretical wavelet entropy is obtained for white noise, when contributions at all scales are similar.
As a first step, from the 10 min slow-wave sleep sections of all the patients, segments of one/two seconds with constant entropy (i.e. within each segment the wavelet entropy varied less than 10% of the maximum entropy), were defined. One hundred segments were then randomly selected (ensuring at least one segment from each patient) to train the detector. The entropy threshold was obtained using linear discriminant analysis on these training segments, and was found to be 67.5% of the maximum.
Segments of 125 ms, one second away from spikes, were then analyzed. Segments were first divided in sporadic or continuous depending on whether their median wavelet entropy was larger or smaller than the threshold. Continuous segments had to be at least 375 ms. Thus, only when three consecutive 125 ms-segments were continuous they were kept, otherwise they were relabeled as irregular segments.
At the channel level, a channel was considered C/SC if at least 75% of its segments were continuous. This percentage roughly corresponded to the concept used in the visual analysis in which almost all background had to be occupied by the C/SC pattern. A channel was considered SP if at last half of its segments were sporadic. Channels that were not C/SC nor SP, were labeled as IRR (indicating that there was some continuous segments in the channel, but they were either not long or not frequent).
2.6. Statistical analysis
After marking all events, a MATLAB (The Mathworks Inc., Natick, Massachusetts, USA) program calculated for each channel the rates per minute of spikes, R and FR. We reported the means and standard deviation for spike, R and FR, and used the Kruskal–Wallis one-way analysis of variance method to compare the spike/R/FR median rates in the different background patterns. The χ2 Test was calculated to compare if there was a statistical difference in the distribution of the three different backgrounds with respect to anatomical localization, the SOZ and the presence of a lesion. The Wilcoxon signed-rank test was used to compare the power spectra of the occipital and hippocampal channels between two conditions (eyes open/closed). The level of significance was set at 0.05.
3. Results
3.1. Anatomical distribution of channels
We analyzed 790 channels distributed in 114 electrodes implanted in 20 patients (12 males, mean age 41.5 ± 11 years; main electroclinical characteristics in Table 1). The channels were placed in the MTS (102 channels) and in the neocortical regions (688 channels). The NC channels were distributed over the various brain lobes: 163 were frontal, 263 temporal, 107 parietal, 100 occipital, 55 P-T-O. In the MTS, 33 channels were in the amygdala, 35 in the hippocampus, 34 in the parahippocampus.
Table 1.
clinical data and implantation sites of all 20 patients.
| Patient # | Gender/age | SEEG electrodes [tot no.] location (name) | C/SC background channels (anatomical location) | MRI findings | Seizure semiology |
|---|---|---|---|---|---|
| 1 | M/44 | [6] L/R OF cortex (L/RO), L/R cingulate (L/RC), L fronto-lateral dorsal cortex (LH/LP) | – | L dorso lateral F FCD | CPS: LOC, tonic asymmetric posturing, usually nocturnal |
| 2 | M/30 | [2] L-Hp (LH), L-PH (LP) | – | Multiple cavernomas (L parieto-occipital), L MTL atrophy | CPS: auditory aura, LOC, oral automatisms |
| 3 | F/50 | [6] L/R-Am (L/RA), L/R-Hp (L/RH), L/R-PH (L/RP) | LH 1–2 (MTS) | R MTL atrophy | CPS: epigastric aura, LOC, oral automatisms |
| 4 | M/43 | [7] L-Am (LA), L anterior T lobe (LT), L F operculum (LOP), L OF cortex (LOF), L anterior cingulate (LAC/LF), L PO region (LO) | – | Large L CP porencephalic cyst | CPS: dystonic posturing R arm, tonic head R deviation |
| 5 | F/35 | [7] L/R anterior (L/RCA) and posterior (L/RCP) cingulate, L/R OF cortex (L/RO), R anterior insula (Rles) | – | R OF and insula FCD | CPS: nocturnal hypermotor manifestations with vocalizations |
| 6 | F/56 | [6] L/R-Am (L/RA), L/R-Hp (L/RH), L/R-PH (L/RP) | LP 2–3/3–4/4–5; RH 1–2/2–3; RP 1–2 (MTS; NC T) | R MTL atrophy | CPS: epigastric aura, LOC, vocalizations, jerky movements of face and arms (L > R) |
| 7 | M/58 | [4] L supra and infra central motor region (LSM/LIM), L supra and infra post-central region (LSPC/LIPC) | LSM 1–2 (NC F) | L F second circumvolution FCD | CPS: R hemiface twitching, R head deviation, asymmetric tonic posturing |
| 8 | M/53 | [4] L/R-Am (L/RA), L/R-Hp (L/RH) | RH 1–2 (MTS) | Shape abnormality and atrophy R hippocampus | CPS: LOC, oral automatisms., L arm dystonia |
| 9 | F/61 | [5] R-Am (RA), R-Hp (RH), R-PH (RP), R TO junction (RC), R O lobe (RO) | RH 1–2; RO 1–2 (MTS; NC O) | R MTL atrophy | CPS: epigastric aura, LOC, post-ictal confusion |
| 10 | M/44 | [4] R-Am (RA), R-Hp (RH), R supra and infracalcarine gyri (RS/RI) | RA 4–5/5–6; RH 2–3; RI 1–2/2–3; RS 1–2 (MTS; NC T; NC O) | Sturge-Weber disease (R PO meningioangiomatosis) | CPS: visual aura, LOC, prolonged confusional state |
| 11 | M/43 | [6] L/R-Am (L/RA), L/R-Hp (L/RH), L/R-PH (L/RP) | LH 1–2 (MTS) | Bilateral MTL atrophy (R > L) | CPS: oral automatisms, LOC, long post-ictal confusion |
| 12 | M/40 | [4] L-PH (LP), L first T gyrus (LT), L angular gyrus (LH), L TO junction (LO) | – | L hemispheric atrophy (branchial arch syndrome) | CPS: aura (dizziness) LOC, oral automatisms, post-ictal R hemiparesis |
| 13 | F/49 | [3] R angular gyrus (RAG), R TO junction (RPH), R P lobe (ROP) | RPH 1–2 (NC PTO junction) | R TP posteriori atrophy with ulegyric cortex | CPS: sensory aura (L arm), LOC, bi-manual automatisms, agitation |
| 14 | M/30 | [9] L/R-Am (L/RA), L/R-Hp (L/RH), R-PH (RP), L/R trigone and supramarg gyrus (L/RS), L/R O lobe (L/RO) | LH 1–2/2–3/3–4; RH 1–2/2–3; RO 1–2; RP 1–2/2–3/4–5/5–6/6–7/7–8 (MTS; NC T; NC O) | Bilateral TO PNH | CPS: aura (dizziness), LOC, oral and bi-manual automastisms |
| 15 | F/25 | [6] R-Am (RA), R-Hp (RH), R-PH (RP), PTO junction (RC), P lobe (RS), O lobe (RO) | RP 1–2/2–3; RH 1–2/2–3 (MTS) | R TO PNH | CPS: epigastric aura, LOC, agitation |
| 16 | M/27 | [11] R-Am (RA), R-Hp (RH), R-PH (RP), R first T circonvolution (RII) R F lobe (RCI/RI/RIA), R P lobe (RC/RPA/RPP/RIP) | RPp 1–2/2–3 (NC P) | R perisylvian PMG | CPS: sensory aura (L hemibody), staring, tonic posturing L arm |
| 17 | F/27 | [6] R-Am (RA), R-Hp (RH), R TO junction (RTO), R supra and infracalcarine gyri (RSC/RIC), R precuneus (RPC) | RIC 1–2/2–3/3–4; RSC 1–2/2–3/3–4/4–5 (NC O) | Normal | CPS: aura (dizziness), R eyes deviation, staring, elevation of both arms, 2ary generalization |
| 18 | M/40 | [5] R-PH (RP), R TO junction (RH), R supra and infracalcarine gyri (RS/RO), R O pole (RC) | RC 2–3/3–4/4–5/5–6/6–7; RO 1–2/2–3/3–4 (NC O) | R TO cystic lesion | CPS: visual aura, arrest of activity, oral automatimsms, 2ary generalization |
| 19 | F/29 | [6] L-Am (LA), L-Hp (LH), L PTO junction (LIP), L O lobe (LSO/LIO/LTO) | – | L PO PNH | CPS: sensory aura (R hand), LOC, dystonic posturing R arm, postictal dysphasia |
| 20 | M/29 | [7] L-Hp (LH), L OF cortex (LOF), L anterior, mid, posterior cingulate gyrus (Lca/LCm/LCp) L supramarginal gyrus (Lpi), L P lobe (Lps) | LH 1–2/2–3 (MTS) | L parietal FCD | CPS: sensory aura (R hemibody), LOC, R eyes/head deviation, diffuse tonic posturing, R arm dystonia |
Am, amygdala/uncus; CP, centro-parietal; CPS, complex partial seizure; FCD, focal cortical dysplasia; Hp, anterior hippocampus; L, left; LOC, loss of consciousness; MTL, mesial temporal lobe; MTS, mesial temporal structures; NC, neocortical; O, occipital; OF, orbito-frontal; P, parietal; PH, middle hippocampus/parahippocampal gyrus; PMG, polymicrogyria; PNH, periventricular nodular heterotopia; PO, parieto-occipital; PTO, parieto-temporal-occipital; R, right; T, temporal; TO, temporo-occipital; TP, temporo-parietal.
3.2. Anatomical distribution of background patterns
The C/SC background was identified in 54 channels (32 NC, 22 MTS), the IRR background in 130 channels (102 NC, 28 MTS), the SP background in 606 channels (554 NC, 52 MTS).
3.2.1. Mesial temporal structures
Considering the 102 MTS channels, the background distribution was as follow: C/SC: 21.5%, IRR: 27.5%, SP: 51%. The χ2 Test showed a non-random distribution between the background patterns and MTS localization (χ2(4,102) = 20.0, p = 0.001). The hippocampus was the anatomical region showing the highest prevalence (68%) of the C/SC background, which was not distributed across MTS regions as expected by chance (χ2(2,22) = 14.5, p < 0.001) (Fig. 2A). The IRR and SP background had instead random distribution in the MTS (p > 0.05).
Fig. 2.
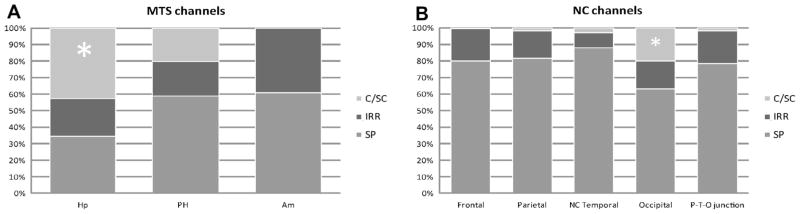
Distribution of the three different background patterns with respect to the anatomical location of the channels in the mesial temporal structures (A) and in the neocortical regions (B). The (*) marks the regions with significantly higher prevalence of the C/SC background, namely the hippocampus for the MTS and the occipital lobe for the NC regions. Am, amygdala/uncus; C/SC, continuous/semicontinuous background; Hp, anterior hippocampus; IRR, irregular background; MTS, mesial temporal structures; NC, neocortical; PHC, middle hippocampus/parahippocampal gyrus; P-T-O, parieto-temporal-occipital; SP, sporadic background.
3.2.2. Neocortical regions
In the neocortical regions, the C/SC background characterized 4.5% of the NC channels, the IRR background 15% and the SP background 80.5%. The χ2 Test showed a non-random distribution of the C/SC background across the brain lobes (χ2(4,32) = 60.6, p ≪ 0.001), the most common being the occipital lobe (Fig. 2B): 63% of the NC C/SC channels belonged to the occipital region, 25% to the neocortical temporal areas, 6% to the parietal lobes, 3% to the frontal lobe and 3% to the P-T-O junction. Considering the occurrence of this pattern in the total number of channels analyzed in each lobe, the occipital lobe had the highest prevalence of C/SC background compared to the other brain regions (20% of the occipital channels showed this pattern compared to 0.05–3% of the channels in the remaining lobes).
Given that the channels showing the C/SC background belonged primarily to the MTS and the occipital lobe (Fig. 3), only those two anatomical regions were analyzed in the following sections.
Fig. 3.

Anatomical regions showing high prevalence of the continuous/semicontinuous background. (A) Electrode placed in the occipital lobe: RO1–RO2 shows a continuous/semicontinuous background, the other two channels are characterized by an irregular background. (B) Electrode aiming at the left hippocampus, showing a continuous/semicontinuous background (deepest channel LH1–LH2) and a sporadic background (LH2–LH3 and LH3–LH4). For both electrodes, only the first three contiguous channels are displayed. All traces showed at time resolution of 0.92 s/page, LF: 80 Hz.
3.3. C/SC background and SOZ
We analyzed the correlation between the C/SC background and SOZ separately for the MTS (total channels no.: 102; SOZ channels no.: 60) and occipital lobe (total channels no.: 100; SOZ channels no.: 30). The C/SC background was found in 15 MTS and 10 occipital SOZ channels (Fig. 4A). For both anatomical structures, the χ2 Test showed that we cannot reject the hypothesis that this type of background is unaffected by a channel belonging or not to the SOZ (p > 0.05).
Fig. 4.

Distribution of the three different background patterns in the SOZ and no SOZ channels (A) and lesional and non-lesional channels (B) in the MTS and occipital lobe. The C/SC background was not influenced by a channel belonging to the seizure onset zone nor by the presence of a lesion for either of the two locations (p > 0.05). C/SC, continuous/semicontinuous background; IRR, irregular background; MTS, mesial temporal structures; SP, sporadic background; SOZ, seizure onset zone.
3.4. C/SC background and lesion
In the MTS, 43 channels were lesional and 59 were non-lesional. The C/SC background was in 28% of the lesional and 16% of the non-lesional channels; the χ2 Test pointed to the fact that we cannot reject the hypothesis that the distribution of this background is not affected by the fact that a channel is or not inside a lesion (p > 0.05).
In the occipital lobe, 51 channels were lesional and 49 were non-lesional: the C/SC pattern characterized 13% of the lesional and 26% of the non-lesional channels (Fig. 4B). The χ2 Test showed that we cannot reject the hypothesis that this type of background is randomly distributed among the two categories of channels (p > 0.05).
3.5. HFOs and spikes occurrence in the different background patterns
The rates (event/minute) of spikes and fast oscillations for each background pattern were as follows (mean ± SD): spikes (C/SC: 8.5 ± 15.5, IRR: 3.3 ± 4.2, SP: 3.0 ± 5.6); ripples (C/SC: 27.8 ± 36.6, IRR: 18.4 ± 24.8, SP: 4.6 ± 10.9); fast ripples (C/SC: 11.2 ± 27.0, IRR: 3.8 ± 5.7, SP: 1.3 ± 3.8). The C/SC pattern showed the highest rates of spikes, ripples and fast ripples compared to the irregular and sporadic backgrounds (p ≪ 0.01, Kruskal–Wallis test).
3.6. Automatic classification of background
Good agreement was found between the automatic classifier and the visual marking: 86.4% of the channels were classified in the same category; 13.3% were differently classified, where the difference was to a neighboring category (e.g. C/SC classified as IRR or IRR classified as SP); and 0.3% only were classified with a difference of two categories (C/SC as SP). Since the automatic classifier was based on wavelet entropy and independent of amplitude, we concluded that the amplitude of the EEG, which could have played a role in the visual classification, did not bias the visual classification.
3.7. C/SC background in the occipital lobe
Due to the high prevalence of the C/SC background in the occipital lobe, we further investigated its significance in this structure.
3.7.1. Regional distribution
We searched for a preferential distribution of the C/SC background inside the occipital lobe. One plane of insertion of the occipital electrodes is orthogonal to the midline, allowing to distinguish the infra and supra-calcarine contacts, and depth/mesial and lateral/superficial contacts. Out of the initial 14 occipital electrodes, five were excluded because inserted in a different plane, trough the occipital pole parallel to the midline, and it was not possible to classify the channels as mesial or lateral. This left nine electrodes containing 69 channels (C/SC background: 13 channels; IRR background: 12 channels; SP background: 44 channels).
The χ2 Test showed a random distribution between the supra and infra-calcarine channels for the occipital C/SC background (p > 0.05). The C/SC background was not distributed as expected by chance between the mesial and lateral channels, being more common in the depth mesial channels (χ2(2,13) = 15.7, p < 0.001).
3.7.2. Responsiveness to behavioral changes
Given the preferential distribution of the C/SC background in the occipital lobe, we evaluated if this pattern could be related to the alpha rhythm, possibly reflecting its presence. We selected 30 min of routine SEEG acquired during wakefulness, performed with the usual activation tasks (eye opening/closure, hyperpnoea, intermittent photic stimulation). The filter was set at 300 Hz and the sampling rate was 1000 Hz, allowing the analysis of the ripple band used to evaluate the background. Out of the seven patients with occipital electrodes, we selected five patients with C/SC background in the occipital channels. The alpha rhythm, reacting to eye opening, could be identified in the occipital electrodes displayed with the usual settings (15 sec/page, LF: 0.3 Hz, HF: 70 Hz, sensitivity 30 μV) (Fig. 5). For each occipital channel with C/SC background, six segments of routine SEEG, two-second in length, were selected: three during eyes open and three during eyes closed (Fig. 6A). First, a visual examination evaluated any potential changes in the background pattern between eyes closed/open. Then, for each segment we calculated the power spectra of four frequency bands: 6–14 Hz, 14–30 Hz, 30–56 Hz, 64–200 Hz; the same analysis was also performed for each patient in the hippocampal channels with C/SC background, to compare the results obtained in the occipital lobe with a region not involved in the generation of the alpha rhythm.
Fig. 5.

Routine SEEG showing depth electrodes placed in the right occipital lobe (RO) and right hippocampus (RH). After eye closure (black arrow) the alpha rhythm is clearly seen over all the occipital channels, while no change involves the hippocampal channels. Settings: LF: 0.3 Hz, HF: 70 Hz.
Fig. 6.

Routine SEEG showing the deepest pair of contacts of an occipital electrode (RO1–RO2) during activation task (arrow: eye opening). (A) Unfiltered SEEG (LF: 0.3 Hz, HF: 70 Hz): the alpha rhythm can be seen reacting to eye opening. The empty rectangles show an example of the two-second segments selected during eyes closed and eyes open, to calculate the power spectra in the four bands (see text for details). (B) SEEG traces expanded in time and amplitude, high-pass filtered at 80 Hz, showing the continuous/semicontinuous background; no changes in the background pattern can be appreciated between the eyes closed (left) and eyes open (right) segments.
Results
Twenty occipital and five hippocampal channels with C/SC background were evaluated. Visual inspection showed no changes between eyes open/closed, the C/SC background being unaffected by that (Fig. 6B). The power spectra obtained in the four frequency bands during eyes open/closed are reported in Table 2. In the occipital channels, there was a significant difference of the values between eyes open/closed for all the bands (p < 0.05, Wilcoxon signed-rank test). As expected we found a very large increase in the power spectrum of the 6–14 Hz band from eyes open to closed, due to the appearance of the alpha rhythm. The 30–56 Hz and 64–200 Hz band showed higher spectral values during eyes open. The fact that in the hippocampal channels there were no significant differences of the spectral values (p > 0.05) for any of the bands, confirmed that these changes were not encountered in regions of the brain not involved in the visual processes.
Table 2.
Mean values (±SD) of the power spectra of the four frequency bands during two conditions (eyes open and closed) obtained in channels with continuous/semicontinuous background placed in the occipital lobe (A) and in the hippocampus (B) of five patients.
| 6–14 Hz | 14–30 Hz | 30–56 Hz | 64–200 Hz | |
|---|---|---|---|---|
| (A) Occipital lobe
| ||||
| Eyes open | 344 (±316) | 146 (±146) | 41 (±29) | 15 (±10) |
| Eyes closed | 1927 (±2330)* | 256 (±256)* | 30 (±21) * | 8 (±6) * |
| (B) Hippocampus | ||||
| Eyes open | 522 (±593) | 319 (±244) | 225 (±242) | 56 (±69) |
| Eyes closed | 571 (±714) | 333 (±275) | 167 (±184) | 58 (±90) |
Indicates a significant difference between the two conditions (p > 0.05).
4. Discussion
Typically HFOs are defined as events with at least four consecutive oscillations between 80 and 500 Hz rising above baseline; when recorded with macro-electrode they occur usually in short segment ranging from 10 to 50 ms, with an amplitude between 40–200 μV (ripples) and 5–30 μV (fast ripples) (Jirsch et al., 2006). This definition implies that HFOs are distinct events separated from the rest of the background. In some channels, visual and automatic HFO marking was quite difficult, due to the unclear separation between the fast oscillations and the rest of the background. In this kind of channel we observed a particular continuous/semi-continuous oscillatory pattern in the ripple frequency band, which we defined continuous High Frequency Activity. Limiting our analysis to the mesial temporal structures of 24 epileptic patients, we described it mainly in the hippocampus, less commonly in the parahippocampus, and rarely in the amygdala (Mari et al., 2012). In the present study we assessed the extent to which the continuous HFA is present in different brain regions, by performing a visual analysis of 790 SEEG channels in 20 epileptic patients implanted in the mesial temporal structures and neocortical areas of different regions.
The first important result is that we confirmed the occurrence of the continuous HFA: it appears to be rare, characterizing 7% of all channels, and is more common in the MTS than in neocortical areas (prevalence respectively of 21.5% and 4.5%). A second striking finding is the anatomical distribution of this type of background: we found a clear preferential distribution for the hippocampus (68% of MTS C/SC channels) and for the occipital lobe (63% of NC C/SC channels). We found no significant association between the C/SC background, the SOZ and the presence of a lesion, in the MTS as well as in the occipital lobe. This pattern does not appear to be a marker of the epileptic activity of the brain or to represent a specific electrographic pattern related to lesional tissue.
The presence of this particular pattern also influences the definition of HFOs as distinct oscillations standing out from the rest of the background, because the background itself has a continuous oscillatory activity. This affects the visual marking, with no clear separation between the background and the fast oscillations. As others have done, we marked as HFOs only those consecutive oscillations with amplitude clearly greater than the surrounding background (see Fig. 1A). However, the definition of the C/SC background is independent from the amplitude of the signals, as demonstrated by the automatic classifier based on the wavelet entropy of the SEEG.
Considering the high prevalence of the C/SC background in the occipital lobe, and its potential correlation with the visual cortex, we evaluated if this pattern could be affected by behavioral changes involving this area. The visual classification of the background did not show any change of pattern between eyes open and closed; the channels with C/SC background were still characterized by this pattern whether the eyes were open or closed, not being affected by the co-occurrence of the alpha rhythm. We concluded that the continuous HFA in the occipital lobe is not a reflection of the presence of the alpha rhythm. The spectral power in the ripple and in the gamma bands was higher for the SEEG segments analyzed during eyes open: this could be explained by the fact that visual perception elicits a response in the gamma (Lachaux et al., 2000; Martinovic and Busch, 2011) and in the ripple band (Nagasawa et al., 2012), with an increase of the visually driven high frequency oscillations occurring in the visual cortex induced as a response by integrating visual information. This increase, however, does not affect the visual classification of a background as a C/SC pattern. The results about the regional distribution of the C/SC background within the occipital lobe also suggested a correlation with the visual areas. A random distribution of this pattern was found between the supra and infra-calcarine channels, while the mesial occipital channels were more frequently characterized by the C/SC background compared to the lateral channels. This could be explained considering the orthogonal insertion of the occipital electrodes: the deepest mesial contacts were placed near the calcarine fissure, recording more closely the activity of the surrounding visual cortex, compared to the superficial contacts over the lateral convexity.
Several studies addressed changes in the gamma/alpha bands in the occipital cortex during specific tasks: an increase in the gamma band power with an alpha/beta suppression was elicited during attentive reading in patients studied with magnetoencephalography and SEEG (Dalal et al., 2009); a gamma increase occurred in the middle occipital gyrus of SEEG recorded patients during pursuit maintenance task (Bastin et al., 2012). Other studies performed with electrocorticography described gamma band augmentation during eye movement tasks (Nagasawa et al., 2011); during photic stimuli, a high-gamma augmentation was most prominent in the medial occipital region (Matsuzaki et al., 2012). It is not clear if the evoked gamma activity evaluated by these studies is related to the spontaneous continuous HFA reported in our study.
Considering all those aspects, we hypothesized that the continuous HFA reflects a particular type of physiological neuronal activity related to specific brain regions.
Since their first description, efforts have been made to distinguish between physiological and pathological HFOs. Spontaneous mesiotemporal ripple oscillations have been described in the CA1 (Buzsáki et al., 1992), CA3, subiculum and enthorinal cortex (Chrobak and Buzsáki, 1996; Csicsvari et al., 1999) of normal rat hippocampus during episodes of awake immobility and slow-wave sleep, probably involved in information processing and consolidation of memory (Buzsaki, 1996; Siapas and Wilson, 1998). Physiological HFOs occur also in normal neocortex. They can be evoked by various stimuli, as HFOs emerging from the somatosensory areas overlying the cortical response of the somatosensory evoked potential (Hashimoto, 2000; Ozaki and Hashimoto, 2011) or HFOs recorded from the non-epileptic occipital cortex and driven by visual tasks (Nagasawa et al., 2012). A high frequency (80–120 Hz) gamma oscillation partially overlapping the frequency band of the continuous HFA has been previously reported in patients studied with large-scale microelectrode recordings in all investigated cortical areas during slow-wave sleep, in the form of short bursts, and speculated to briefly restore “microwake” activity important for memory traces consolidation (Le Van Quyen et al., 2010).
Our study presents various limitations. Considering that no significant changes of the background pattern occurred between wakefulness and sleep in mesial temporal structures (Mari et al., 2012), we limited our analysis to slow-wave sleep, less contaminated by artifacts. However, only limited segments of sleep were visually analyzed; we do not know, therefore, if the HFA is a constant feature in a given channel during the entire night recording of if it could change to other pattern in non-contiguous sleep segments. Moreover, changes could also occur during the different sleep stages (for example, during the REM stage).
Another limitation involves the occipital HFA, considering that only the basic eye opening/closure task was used to study the occipital visual structures. Further studies specifically designed to evaluate the continuous HFA in the hippocampus and occipital lobe, performed with more specific tasks, are necessary to better investigate potential variations of the C/SC background in relation to changes in the physiological functions of these structures.
In conclusion, the continuous HFA characterizes normal channels as well as those inside the SOZ or a lesion. This pattern shows high prevalence in the hippocampus and occipital lobe, two regions in which spontaneous HFOs of physiological nature have been described. These findings suggest that continuous High Frequency Activity may also be considered a particular type of physiological pattern, related to intrinsic characteristics of specific brain regions.
HIGHLIGHTS.
A particular intracerebral EEG pattern appearing as a continuous/semi-continuous activity in the 80–200 Hz band is systematically evaluated in a population of epileptic patients implanted in mesial temporal and neocortical regions.
This continuous High Frequency Activity shows a clear preferential distribution for the hippocampus and the occipital lobe, and is unaffected by the presence of the seizure onset zone or a lesion.
The continuous High Frequency Activity can be considered an intrinsic pattern of specific brain areas, and could help in differentiating between physiological and pathological high frequency activities.
Acknowledgments
The authors would like to thank Dr. Massimo Avoli for the suggestions in preparing the manuscript. This work was supported by grant MOP-102710 of the Canadian Institutes of Health Research and Robb fellowship.
Footnotes
None of the authors has any conflict of interest to disclose.
References
- Bagshaw AP, Jacobs J, LeVan P, Dubeau F, Gotman J. Effect of sleep stage on interictal high-frequency oscillations recorded from depth macroelectrodes in patients with focal epilepsy. Epilepsia. 2009;50:617–28. doi: 10.1111/j.1528-1167.2008.01784.x. [DOI] [PMC free article] [PubMed] [Google Scholar]
- Bastin J, Lebranchu P, Jerbi K, Kahane P, Orban G, Lachaux JP, et al. Direct recordings in human cortex reveal the dynamics of gamma-band [50–150 Hz] activity during pursuit eye movement control. Neuroimage. 2012;63:339–47. doi: 10.1016/j.neuroimage.2012.07.011. [DOI] [PubMed] [Google Scholar]
- Bragin A, Engel J, Jr, Wilson CL, Fried I, Mathern GW. Hippocampal and entorhinal cortex high-frequency oscillations (100–500 Hz) in human epileptic brain and in kainic acid–treated rats with chronic seizures. Epilepsia. 1999;40:127–37. doi: 10.1111/j.1528-1157.1999.tb02065.x. [DOI] [PubMed] [Google Scholar]
- Buzsáki G, Horváth Z, Urioste R, Hetke J, Wise K. High-frequency network oscillation in the hippocampus. Science. 1992;256:1025–7. doi: 10.1126/science.1589772. [DOI] [PubMed] [Google Scholar]
- Buzsaki G. The hippocampo-neocortical dialogue. Cereb Cortex. 1996;6:81–92. doi: 10.1093/cercor/6.2.81. [DOI] [PubMed] [Google Scholar]
- Buzsaki G. Rhythms of the brain. New York: Oxford University Press; 2006. [Google Scholar]
- Chrobak JJ, Buzsáki G. High-frequency oscillations in the output networks of the hippocampal-entorhinal axis of the freely behaving rat. J Neurosci. 1996;16:3056–66. doi: 10.1523/JNEUROSCI.16-09-03056.1996. [DOI] [PMC free article] [PubMed] [Google Scholar]
- Csicsvari J, Hirase H, Czurkó A, Mamiya A, Buzsáki G. Oscillatory coupling of hippocampal pyramidal cells and interneurons in the behaving Rat. J Neurosci. 1999;19:274–87. doi: 10.1523/JNEUROSCI.19-01-00274.1999. [DOI] [PMC free article] [PubMed] [Google Scholar]
- Dalal SS, Baillet S, Adam C, Ducorps A, Schwartz D, Jerbi K, et al. Simultaneous MEG and intracranial EEG recordings during attentive reading. Neuroimage. 2009;45:1289–304. doi: 10.1016/j.neuroimage.2009.01.017. [DOI] [PubMed] [Google Scholar]
- Hashimoto I. High-frequency oscillations of somatosensory evoked potentials and fields. J Clin Neurophysiol. 2000;17:309–20. doi: 10.1097/00004691-200005000-00008. [DOI] [PubMed] [Google Scholar]
- Jacobs J, LeVan P, Chander R, Hall J, Dubeau F, Gotman J. Interictal high-frequency oscillations (80–500 Hz) are an indicator of seizure onset areas independent of spikes in the human epileptic brain. Epilepsia. 2008;49:1893–907. doi: 10.1111/j.1528-1167.2008.01656.x. [DOI] [PMC free article] [PubMed] [Google Scholar]
- Jacobs J, LeVan P, Chatillon CE, Olivier A, Dubeau F, Gotman J. High Frequency Oscillations (80–500 Hz) in intracranial EEGs mark epileptogenicity rather than lesion type. Brain. 2009;132:1022–37. doi: 10.1093/brain/awn351. [DOI] [PMC free article] [PubMed] [Google Scholar]
- Jacobs J, Zijlmans M, Zelmann R, Chatillon CE, Hall J, Olivier A, et al. High-frequency electroencephalographic oscillations correlate with outcome of epilepsy surgery. Ann Neurol. 2010;67:209–20. doi: 10.1002/ana.21847. [DOI] [PMC free article] [PubMed] [Google Scholar]
- Jirsch JD, Urrestarazu E, LeVan P, Olivier A, Dubeau F, Gotman J. High-frequency oscillations during human focal seizures. Brain. 2006;129:1593–608. doi: 10.1093/brain/awl085. [DOI] [PubMed] [Google Scholar]
- Lachaux JP, Rodriguez E, Martinerie J, Adam C, Hasboun D, Varela FJ. A quantitative study of gamma-band activity in human intracranial recordings triggered by visual stimuli. Eur J Neurosci. 2000;12:2608–22. doi: 10.1046/j.1460-9568.2000.00163.x. [DOI] [PubMed] [Google Scholar]
- Le Van Quyen M, Staba R, Bragin A, Dickson C, Valderrama M, Fried I, et al. Large-scale microelectrode recordings of high-frequency gamma oscillations in human cortex during sleep. J Neurosci. 2010;30:7770–82. doi: 10.1523/JNEUROSCI.5049-09.2010. [DOI] [PMC free article] [PubMed] [Google Scholar]
- Mari F, Zelmann R, Andrade-Valenca L, Dubeau F, Gotman J. Continuous high-frequency activity in mesial temporal lobe structures. Epilepsia. 2012;53:797–806. doi: 10.1111/j.1528-1167.2012.03428.x. [DOI] [PMC free article] [PubMed] [Google Scholar]
- Martinovic J, Busch NA. High frequency oscillations as a correlate of visual perception. Int J Psychophysiol. 2011;79:32–8. doi: 10.1016/j.ijpsycho.2010.07.004. [DOI] [PubMed] [Google Scholar]
- Matsuzaki N, Nagasawa T, Juhász C, Sood S, Asano E. Independent predictors of neuronal adaptation in human primary visual cortex measured with high-gamma activity. Neuroimage. 2012;59:1639–46. doi: 10.1016/j.neuroimage.2011.09.014. [DOI] [PMC free article] [PubMed] [Google Scholar]
- Nagasawa T, Matsuzaki N, Juhász C, Hanazawa A, Shah A, Mittal S, et al. Occipital gamma-oscillations modulated during eye movement tasks: simultaneous eye tracking and electrocorticography recording in epileptic patients. Neuroimage. 2011;58:1101–9. doi: 10.1016/j.neuroimage.2011.07.043. [DOI] [PMC free article] [PubMed] [Google Scholar]
- Nagasawa T, Juhász C, Rothermel R, Hoechstetter K, Sood S, Asano E. Spontaneous and visually driven high-frequency oscillations in the occipital cortex: intracranial recording in epileptic patients. Hum Brain Mapp. 2012;33:569–83. doi: 10.1002/hbm.21233. [DOI] [PMC free article] [PubMed] [Google Scholar]
- Ozaki I, Hashimoto I. Exploring the physiology and function of high-frequency oscillations (HFOs) from the somatosensory cortex. Clin Neurophysiol. 2011;122:1908–23. doi: 10.1016/j.clinph.2011.05.023. [DOI] [PubMed] [Google Scholar]
- Olivier A, Germano IM, Cukiert A, Peters T. Frameless stereotaxy for surgery of the epilepsies: preliminary experience. Technical note. J Neurosurg. 1994;81:629–33. doi: 10.3171/jns.1994.81.4.0629. [DOI] [PubMed] [Google Scholar]
- Rosso OA, Blanco S, Yordanova J, Kolev V, Figliola A, Schürmann M, et al. Wavelet entropy: a new tool for analysis of short duration brain electrical signals. J Neurosci Methods. 2001;105:65–75. doi: 10.1016/s0165-0270(00)00356-3. [DOI] [PubMed] [Google Scholar]
- Siapas AG, Wilson MA. Coordinated interactions between hippocampal ripples and cortical spindles during slow-wave sleep. Neuron. 1998;21:1123–8. doi: 10.1016/s0896-6273(00)80629-7. [DOI] [PubMed] [Google Scholar]
- Staba RJ, Wilson CL, Bragin A, Jhung D, Fried I, Engel J., Jr High frequency oscillations recorded in human medial temporal lobe during sleep. Ann Neurol. 2004;56:108–15. doi: 10.1002/ana.20164. [DOI] [PubMed] [Google Scholar]
- Staba RJ, Frighetto L, Behnke EJ, Mathern GW, Fields T, Bragin A, et al. Increased fast ripple to ripple ratios correlate with reduced hippocampal volumes and neuron loss in temporal lobe epilepsy patients. Epilepsia. 2007;48:2130–8. doi: 10.1111/j.1528-1167.2007.01225.x. [DOI] [PubMed] [Google Scholar]
- Urrestarazu E, Jirsch JD, LeVan P, Hall J, Avoli M, Dubeau F, et al. High-frequency intracerebral EEG activity (100–500 Hz) following interictal spikes. Epilepsia. 2006;47:1465–76. doi: 10.1111/j.1528-1167.2006.00618.x. [DOI] [PubMed] [Google Scholar]
- Urrestarazu E, Chander R, Dubeau F, Gotman J. Interictal high-frequency oscillations (100–500 Hz) in the intracerebral EEG of epileptic patients. Brain. 2007;130:2354–66. doi: 10.1093/brain/awm149. [DOI] [PubMed] [Google Scholar]
- Worrell GA, Gardner AB, Stead SM, Hu S, Goerss S, Cascino GJ, et al. High-frequency oscillations in human temporal lobe: simultaneous microwire and clinical macroelectrode recordings. Brain. 2008;131:928–37. doi: 10.1093/brain/awn006. [DOI] [PMC free article] [PubMed] [Google Scholar]
- Wu JY, Sankar R, Lerner JT, Matsumoto JH, Vinters HV, Mathern GW. Removing interictal fast ripples on electrocorticography linked with seizure freedom in children. Neurology. 2010;75:1686–94. doi: 10.1212/WNL.0b013e3181fc27d0. [DOI] [PMC free article] [PubMed] [Google Scholar]
- Zijlmans M, Jacobs J, Zelmann R, Dubeau F, Gotman J. High-frequency oscillations mirror disease activity in patients with epilepsy. Neurology. 2009;72:979–86. doi: 10.1212/01.wnl.0000344402.20334.81. [DOI] [PMC free article] [PubMed] [Google Scholar]