Abstract
Existing automatic detection techniques show high sensitivity and moderate specificity, and detect seizures a relatively long time after onset. High frequency (80–500 Hz) activity has recently been shown to be prominent in the intracranial EEG of epileptic patients but has not been used in seizure detection. The purpose of this study is to investigate if these frequencies can contribute to seizure detection. The system was designed using 30 h of intracranial EEG, including 15 seizures in 15 patients. Wavelet decomposition, feature extraction, adaptive thresholding and artifact removal were employed in training data. An EMG removal algorithm was developed based on two features: Lack of correlation between frequency bands and energy-spread in frequency. Results based on the analysis of testing data (36 h of intracranial EEG, including 18 seizures) show a sensitivity of 72%, a false detection of 0.7/h and a median delay of 5.7 s. Missed seizures originated mainly from seizures with subtle or absent high frequencies or from EMG removal procedures. False detections were mainly due to weak EMG or interictal high frequency activities. The system performed sufficiently well to be considered for clinical use, despite the exclusive use of frequencies not usually considered in clinical interpretation. High frequencies have the potential to contribute significantly to the detection of epileptic seizures.
Keywords: Epilepsy, EEG, Automatic seizure detection, Wavelet, High frequency, EMG removal
1. Introduction
Epilepsy is a neurological disorder that affects 1% of the world’s population. Epileptic seizures are clinical manifestations of abnormal and excessive neural discharges in the brain [1,2]. These discharges are often referred as “paroxysmal activity” and appear either during seizure (ictal period) or between seizures (interictal periods). Since most patients cannot anticipate seizure events, life threatening situations may arise [3]. Most epileptic patients are treated with antiepileptic medications. In the case of pharmacoresistant focal epilepsy, surgical removal of brain tissue involved in the seizure onset generation is a possible treatment. In order to determine the seizure onset zone, Stereo Electroencephalography (SEEG) is used which acquire intracranial data using implanted depth electrodes within desired brain tissue. Due to the unpredictability of seizures, patients undergo long-term monitoring at hospital, which takes several days to weeks and is accompanied by the collection of large amounts of EEG data.
Automatic detection of seizures can facilitate long-term monitoring for diagnostic purposes and enables physicians to monitor epileptic patients while testing and assessing the benefit of different medications in order to provide quantitative measure of seizure activity [4,5].
High Frequency (HF) activities which consist of high frequency oscillations (HFOs) and other activities above 80 Hz are visible in many seizures and occur from the very onset [6,7]. HFOs are grouped into ripples (80–250 Hz) and fast ripple (250–500 Hz) and have been associated to seizure genesis [8–10]. HFOs occur during seizures and interictally, and most often during non-REM sleep [11]. It has been suggested that HFOs increase preictally and the number of HFOs increases a few seconds before seizure onset [6,12]. The number of HFOs during the ictal period is higher than the preictal period and is longer in duration [7]. It is important to note that the HFO oscillations are subgroup of HF activities and the intention of this work is to exploit automatic seizure detection through HF activities.
2. State of the art
Most existing automatic seizure detection techniques are divided in two stages; data transformation to a particular domain for the purpose of feature extraction and classification. Features were extracted in time domain [13], frequency domain [14–16], both time and frequency domain [17] or time–frequency domain like wavelet transform. Since EEG is non-stationary, the methods using time–frequency domain usually provide higher success than the other two methods. The results of the studies in the literature have demonstrated that wavelet transform is a powerful tool for analyzing EEG signals in the context of automatic seizure detection [18–24] compared with conventional signal analysis techniques.
The success of classification depends both on the features and classifier. Different classifiers have been used in the literature; artificial neural networks [23–26], nearest neighbor [17], Bayesian [15] fuzzy networks [27].
Existing automatic seizure detection techniques show high sensitivity, moderate specificity, and detect seizures a relatively long time after onset [15,28].
This work implement the automatic seizure detection in wavelet domain, extracting three feature of HF activities namely relative energy, number of HF peaks and wavelet entropy followed by a linear thresholding classifier to detect seizure. The purpose of this study is to explore if HF activity can play a role in seizure detection, particularly in reducing the detection delay as HF activities are prominent early in the discharge. To our knowledge the HF activity has not previously been used to automatically detect seizures. Improving detection delay renders a seizure detection method more useful as it can be used as a warning to the patient or observer that a seizure has just started. It can also improve the results of Single Photon Emission Computed Tomography (SPECT) imaging studies, which require injection of the radioactive tracer as soon as the seizure starts.
Additionally muscle artifact (EMG) transmitted through the skull is an important confound in detecting low amplitude high frequency discharges. This work also implements a novel EMG removal technique in order to improve seizure detection specificity.
3. Patients and materials
The SEEG data used in this study were collected using the Stellate Harmonie System for EEG monitoring in the Epilepsy Telemetry Unit at the Montreal Neurological Institute and Hospital. The Montreal Neurological Institute and Hospital Research Ethics Committee approved this study and informed consent was obtained from each patient. The EEG was band-pass filtered at 0.1–500 Hz and then sampled at a rate of 2000 Hz. The sampled data was quantized using a 16 bit analog-to-digital converter. The EEG data of each patient had 20–80 channels. Depth electrodes were manufactured onsite (9 contacts per electrode; contact surface 0.8 mm2) as described previously [29,30].
Two neurologists reviewed the EEG to identify the seizure onset in each patient. Patients were chosen based solely on the criterion that they experienced one seizure during 2 h recording. This ensured that each data segment contains seizure and non-seizure segments and that the pre-selection of specific seizure pattern was avoided. Clinical and electrographic seizures were both included (seizures were not selected based on clinical manifestations). Data were collected from 34 patients and 2 h recording was kept around each seizure.
The only electrodes that were excluded from analysis consisted of: ECG, EOG, EMG and epidural contacts. Sections during which the patient was disconnected from the system were also excluded from analysis.
The training data used to design and develop the algorithm consisted of 16 patients with a total of 16 seizures. No pre-selection of patient seizures was done except in one patient whose seizure was extremely long (55 min). This seizure was rejected as no clear distinction between seizure and non-seizure sections existed. As a consequence, only 15 patients (out of the original 16) were left, having a total of 15 seizures during 30 h of recording.
The testing data set used to test the performance of the algorithm consisted of 18 patients including 18 seizures during 36 h of recording with no pre-selection of seizure patterns.
4. Methods
The automatic seizure detection algorithm was based on the Continuous Wavelet Transform (CWT). The CWT was computed by convolving the SEEG signal, x(t), with given wavelet basis function φa,b resulting in wavelet coefficients W(a,b):
| (1) |
‘*’ denotes the complex conjugate.
| (2) |
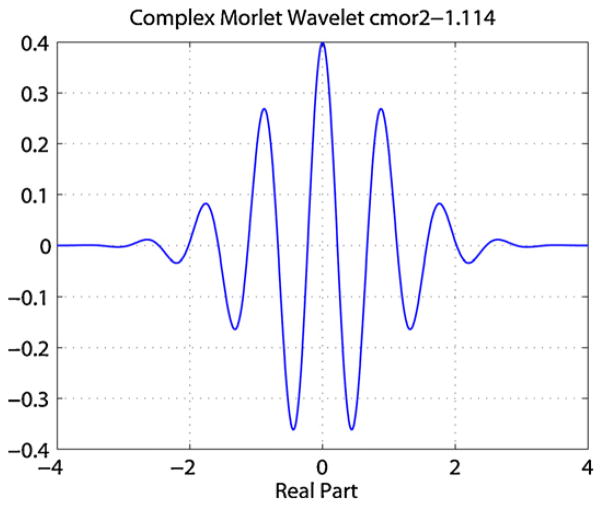
where a is the scale which can be translated to frequency as f = 1/a, b is the time shift of the wavelet transform and φ0 is a prototype mother wavelet function. In this paper we opted to use the term frequency instead of scale. As the wavelet coefficients represent the degree of correlation between the mother wavelet and the SEEG signal, x(t), the choice of the mother wavelet basis was crucial for the accurate representation of the SEEG signal in the wavelet space. After testing several basis functions, the complex Morlet wavelet was chosen as it provides better localized time–frequency resolution for analysis of HF activities than other basis functions. The complex Morlet wavelet matches the shape of the HF activities as shown in Fig. 1 and has previously been used in the analysis of HF activities [10,31].
Fig. 1.
Real part of Morlet mother wavelet.
| (3) |
where fb is the bandwidth parameter and fc is the wavelet center frequency, which determines the shape and width of the complex Morlet wavelet function. The values of fb and fc have been chosen to be 1.114 and 2 respectively [10].
4.1. Step one: wavelet transform of running window and background window
The method to compute the wavelet coefficients of SEEG data was based on a Running Window (RW) of sequential 5 s epochs, with windows overlapping by 0.125 s to avoid edge effect (effective temporal resolution Δt = 4.75 s). The algorithm was designed to extract features from each epoch in the RW and compare them with the features from a moving background with 100 s length that ended 20 s before the RW. In order to compute the moving background, the 100 s epoch was broken down into 20 intervals of 5 s epochs (effective temporal resolution Δt = 4.75 s) and the median of wavelet coefficients of the moving background was computed across the 20 windows and stored as Background Window (BW). The BW was computed in this way in order to remove the outliers and create a steady background. Updating the BW for each new epoch rather than using a fixed background ensures that it represents the current state of the SEEG at all times.
The frequency range of interest in the analysis was between 80 and 500 Hz; for visualization purposes all figures were plotted in the range of 80–400 Hz since there were no significant activities above 400 Hz. In order to balance the computational speed while preserving localized activities in the wavelet domain a frequency resolution of 30 Hz was selected for this study.
4.2. Step two: feature extraction
The features, relative energy of HF activities, number of HF peaks and wavelet entropy were used to reveal important characteristics of seizure onset patterns in HF activities. The relative energy and wavelet entropy are known to contain discriminant information for seizure detection for low frequency ranges (1–70 Hz) and have been used in the past [15,18,22,32]. In contrast, the number of HF peaks has not previously been used for automatic seizure detection.
4.2.1. Relative energy of HF activities
The majority of seizures show rhythmic activity with increasing HF energy appearing mostly in the seconds following seizure onset within the range of 80–500 Hz in one or more channels [6]. Therefore, the relative energy of HF can be considered as a relevant feature for demonstrating the evolution of seizures.
To compute the relative energy of an epoch, the energy of RW, Ea,b(RW) and the energy of BW, Ea,b(BK) was computed from the wavelet coefficients Ca,b in the time–frequency domain for each time b and frequency a. The energy at frequency a can be calculated by equation:
| (4) |
where N is signal length (for RW is 4.75 s and for BK is 100 s). A ratio, Relative Energy (RE) was computed and normalized to the energy of BW epoch as follows:
| (5) |
4.2.2. Number of HF peaks
As a result of work discussed above, we hypothesize that the number of HF peaks is a good marker of seizure onset.
To calculate the number of HF peaks, first the maximum of |Ca,b| in BW was measured and a proportion (β) of the maximum was used as a threshold THRange. β is a constant and a single value used for all patients. Then the local peaks of the wavelet coefficient of the RW for each frequency band that were greater than THRange were defined as peaks. The number of local peaks in a RW was measured in each frequency and was referred to as the number of HF peaks.
4.2.3. Wavelet entropy
The wavelet entropy provides quantitative information about the irregularity/rhythmicity of the signal. High entropy indicates low rhythmicity, and low entropy indicates high rhythmicity [33]. The wavelet entropy was computed for the RW from the wavelet coefficients Ca,b.
The wavelet entropy W is defined as:
| (6) |
where Pab is the ratio of energy for each frequency and was calculated as:
| (7) |
The energy Ea at frequency a and time b can be calculated by Eq. (4). The total energy is computed as:
| (8) |
where N is the signal length and M is the number of frequency bands.
4.3. Step three: adaptive threshold analysis
In order to detect a change in the feature matrices created in step two an adaptive threshold was desirable, in which epochs with features higher than the threshold were classified as candidate epoch. Features in the RW were compared with features in the BW. An epoch was marked as candidate epoch if at least one frequency bin in the features in the RW exceeded the three thresholds:
where THe, THn and THwe are thresholds for relative energy of HF activities, number of HF peaks and wavelet entropy. The αe, αn and αwe are the corresponding user-tunable constants, allowing for trade-off between sensitivity, detection delay and false detection rate. The δe, δn and δwe are the standard deviation and μe, μn and μwe the mean of the BW. The thresholds were optimized with the training data set.
4.4. Step four: combining features
At this step, the feature combiner integrated the three features. A simple rule was used to make a decision on candidate epochs. In order for a detection to take place during the RW, the three features had to surpass the corresponding thresholds for at least one frequency in one channel based on the concept that a seizure can be detected in any frequency and any channel. Candidate epochs that were within 10 s were grouped and counted as a single detection.
4.5. Step five: artifact removal
There were two types of artifacts creating the majority of false detections: 60 Hz and muscle activities (EMG). To reject false detections caused by artifacts, we used two algorithms. They were optimized with the training data set.
4.5.1. 60 Hz removal
The first algorithm detected 60 Hz interference and its harmonics. The spectrum of the candidate epoch was computed over the frequency range of 80–500 Hz. A threshold was calculated based on the magnitude of the spectrum of the epoch from TH60 Hz = (αsδs) + μs, where αs is a constant, δs is the standard deviation and μs the mean of the spectrum. If the spectral value of at least 3 of the 60 Hz harmonic frequencies (60, 120, 180, 240, 300, 360, 420 and 480 Hz) was higher than the threshold TH60 Hz, the epoch was excluded.
4.5.2. Muscle removal
Some SEEG electrodes close to the skull can record EMG. The presence of EMG activity is more pronounced during seizures [34]. Differentiating between the discharges from the EMG and from the brain was important as it reduces the false detection rate significantly. EMG artifacts removal was developed in two steps based on the features observed visually.
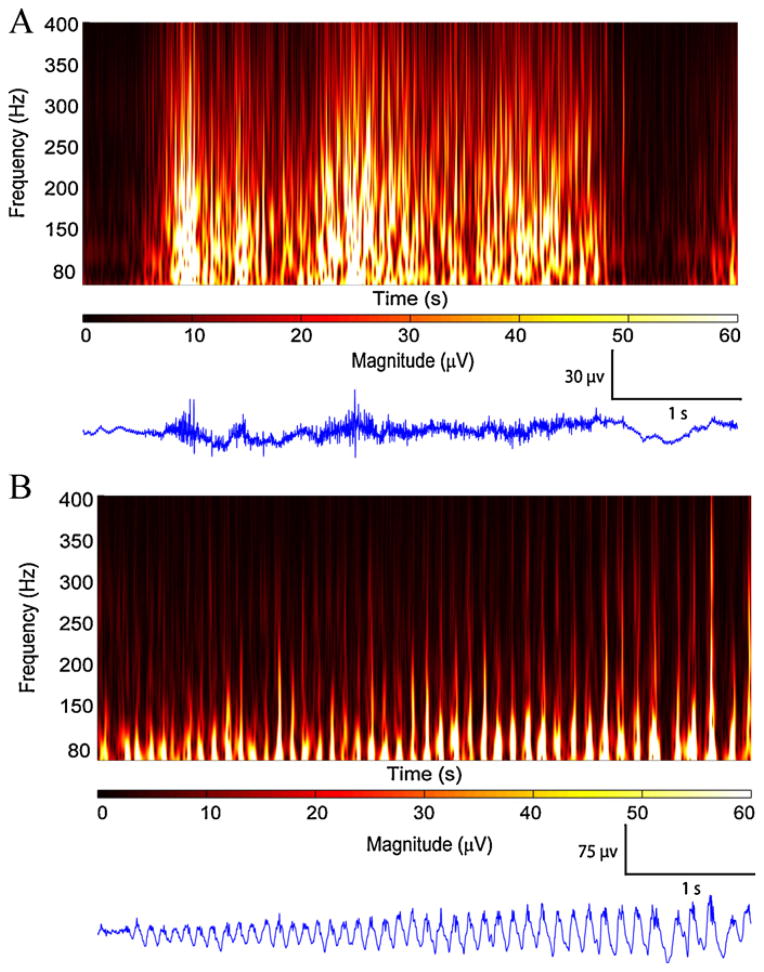
The first step is based on the lack of correlation between different frequency bands during EMG activity. This feature was derived from the idea that EMG activity resembles white noise, with lack of correlation between different frequencies in the wavelet domain. The second step was based on spread of the energy across frequency bands of 80–500 Hz. Fig. 2 compares two 5 s epochs, one with ictal EMG activity on a channel close to the skull (Fig. 2A) and the other with HF activity 2 s after seizure onset in a hippocampal channel, far from the skull (Fig. 2B).
Fig. 2.
Time–frequency representations for EMG and HF activity. (A) 5 s of EMG activity 40 s after seizure onset in LH8–LH9 channel shows lack of correlation between frequency bands and spread of energy across all frequencies. (B) 5 s of HF activity, 2 s after seizure onset at RH1–RH2 channel shows rhythmic HF activity with correlation in different frequency bands. Note the energy is mostly concentrated in lower frequency ranges.
The first step was to segment a 5 s epoch into 0.1 s slices with a 5 Hz frequency resolution. The value 0.1 s was chosen through visual inspection of epochs containing EMG or HF. For each slice the correlation coefficient was computed between the lowest frequency 80 Hz and all remaining frequency bands. The 80 Hz band was used as a reference with the hypothesis that EMG activity show low correlation between low frequency and the rest of frequency bands as seen in Fig. 2A while HFs are highly correlated (Fig. 2B).
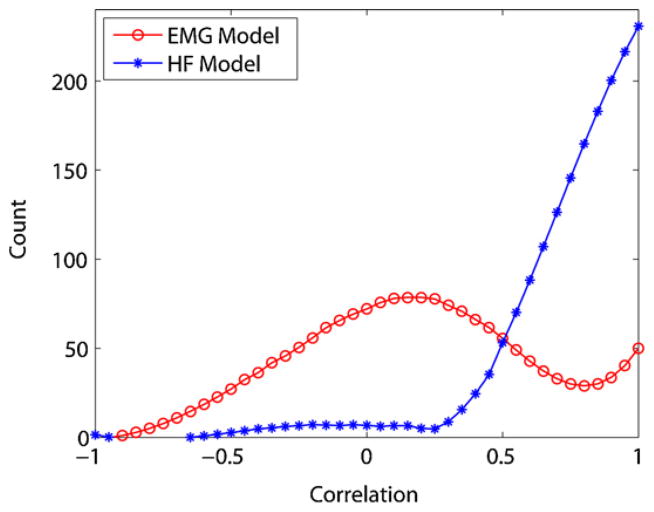
Fig. 3 shows the histogram of correlation coefficients between 80 Hz and the other frequency bands for EMG and HF epochs for 500 epochs. The histogram of correlation coefficients for HFs has an exponential shape with most epochs having large correlations, while EMG epochs have a Gaussian distribution with most epochs having a low correlation. There were no significant differences between EMG and HF epochs at frequencies higher than 250 Hz, therefore only the frequency range of 80–250 Hz was retained at this step. This reduces the computational time by half. The histograms shown in Fig. 3 were used as models to differentiate EMG and HF epochs.
Fig. 3.
Histogram of correlation coefficients used as EMG and HF models.
The method of least mean squares was used to fit the EMG or HF epochs to the models. The epoch was assigned the type with the best fit.
The first step of EMG removal eliminated many false detections in candidate epochs. The remaining false detections which mainly consisted of short duration HF activities embedded in the background or weak muscle activities that resemble HF activities, needed to be further analyzed and classified.
The second step of EMG removal was performed based on analysis of the spectrogram of candidate epochs. It was observed that EMG spectrograms have no specific frequency band and this feature has been previously reported [34] and is illustrated in Fig. 2A. Consequently, to differentiate between EMG and HF the spread of energy in frequency was used. Visually we observed that in the frequency range of 80–250 Hz, the spread of energy in frequency for HFs was mostly concentrated on the first quartile (80–120 Hz), while the spread of energy in frequency for EMG was spread over the whole range of 80–250 Hz. Based on the predominance of HF energy-spread in frequency in the first quartile, the upper limit of the first quartile (120 Hz) was chosen as the threshold THEMG.
Next, further calculations were performed to determine which fraction of energy of a candidate epoch was expected to be found in the first quartile. A 70% of energy in frequency was found to differentiate HF activities from EMGs. Therefore if 70% of energy in frequency resides below THEMG it would be considered HF activities, while if the reverse is true, then this epoch was marked as EMG and that detection was discarded. All the parameters were optimized through the training data set.
4.6. Step six: final detections
The criterion for a seizure detection to take place is that there must be at least one candidate epoch (among all possible candidate epochs in all channels) that has not been rejected by the EMG detection algorithm.
5. Results
This section presents the results obtained for the training and testing data. Results will be presented on a per-patient basis and as averages to avoid bias by one particular patient.
There were three measures of performance: sensitivity, delay and false detection rate. Sensitivity is the ratio of seizures detected by automatic detectors over the total number of seizures marked by the experts. Seizures detected 60 s after the onset were classified as missed seizures. Delay is the time difference between the seizure onset marked by the experts and the earliest automatic detection within 60 s of onset. False detections are events identified as seizure by the automatic detection but not by the experts.
As clinically applicable tools, the main goal of seizure detection systems is to achieve low false detection rates and high sensitivity with short delays. In general, it is better to detect seizures with long delay than to miss them. The performance of our seizure detection depends on threshold values. Adjusting the thresholds to achieve higher sensitivity also increases the false detection rate and decreases the delay. Lowering false detection rate results in increased numbers of missed seizures and increased delay. The four thresholds, THe, THn, THwe and THEMG, were set to some initial values. To investigate the effect of changing thresholds, they underwent an iterative procedure for optimization. While changing one parameter, we held the others fixed. In the optimization procedure the three threshold values, THe, THn and THwe had to be optimized first but the order in which they get optimized were independent. With the goal of high sensitivity, low false detection rate associated with short delay, the optimal values of the four thresholds, THe, THn, THwe and THEMG, were 4.5, 3.5, 8 and 120. As can be seen in Fig. 4, the selected thresholds show best performance. Subsequently, these threshold values were applied on the testing data.
Fig. 4.
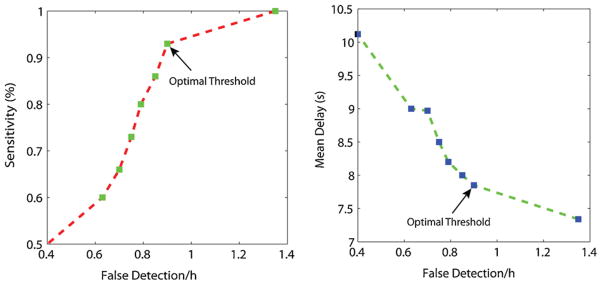
Seven sets of threshold values THe, THn, THwe and THEMG. (Left) Sensitivity versus false detection rate. (Right) Delay versus mean delay.
Tables 1 and 2 show the individual patient results of the training and testing data sets, using the optimal thresholds. For the training data the average sensitivity was 93%, the average false detection rate was 0.9/h and the median and mean delays were 7 s and 7.85 s. For the testing data, optimal thresholds yielded a sensitivity of 72%, a false detection rate of 0.7/h, and median and mean delay of 5.7 s and 10.92 s (Table 3).
Table 1.
Training results for optimal threshold values for one seizure per patient (total of 15 seizures) during 2 h recording (total of 30 h). [‘TP’ are true positive, ‘FP’ false positives and ‘FN’ false negatives.].
| Patient | TP | FN | FP | Delay (s) |
|---|---|---|---|---|
| 1 | 1 | 0 | 1 | 14.25 |
| 2 | 1 | 0 | 1 | 13.25 |
| 3 | 1 | 0 | 1 | 15.45 |
| 4 | 1 | 0 | 1 | 4.65 |
| 5 | 1 | 0 | 2 | 2.95 |
| 6 | 1 | 0 | 1 | 4.75 |
| 7 | 1 | 0 | 0 | −1.15 |
| 8 | 1 | 1 | 1 | 2.35 |
| 9 | 1 | 0 | 2 | 13.15 |
| 10 | 0 | 0 | 1 | n/a |
| 11 | 1 | 0 | 0 | 4.55 |
| 12 | 1 | 0 | 1 | 9.25 |
| 13 | 1 | 0 | 0 | 0.65 |
| 14 | 1 | 0 | 5 | 15.85 |
| 15 | 1 | 0 | 1 | 9.95 |
| Sum | 14 | 1 | 18 | Median = 7 |
Table 2.
Testing results for optimal threshold values for one seizure per patient (total of 18 seizures) during 2 h recording (total of 36 h).
| Patient | TP | FN | FP | Delay(s) |
|---|---|---|---|---|
| 1 | 1 | 0 | 0 | 4.65 |
| 2 | 0 | 1 | 2 | n/a |
| 3 | 1 | 0 | 0 | 6.65 |
| 4 | 1 | 0 | 1 | −0.05 |
| 5 | 1 | 0 | 5 | 33.05 |
| 6 | 1 | 0 | 0 | 49.35 |
| 7 | 1 | 0 | 0 | 2.85 |
| 8 | 1 | 0 | 0 | 7.45 |
| 9 | 0 | 1 | 4 | n/a |
| 10 | 1 | 0 | 2 | 5.65 |
| 11 | 1 | 0 | 1 | 8.65 |
| 12 | 1 | 0 | 0 | 3.75 |
| 13 | 1 | 0 | 2 | 5.75 |
| 14 | 0 | 1 | 3 | n/a |
| 15 | 0 | 1 | 1 | n/a |
| 16 | 1 | 0 | 3 | 2.55 |
| 17 | 1 | 0 | 4 | 11.75 |
| 18 | 0 | 1 | 0 | n/a |
| Sum | 13 | 5 | 28 | Median = 5.7 |
Table 3.
Summary of training and testing results using optimal threshold.
| Sensitivity (%) | Patients with 100% sensitivity | FD rate | Median delay (s) | |
|---|---|---|---|---|
| Training | 93 | 14/15 | 0.93 | 7 |
| Testing | 72 | 13/18 | 0.72 | 5.7 |
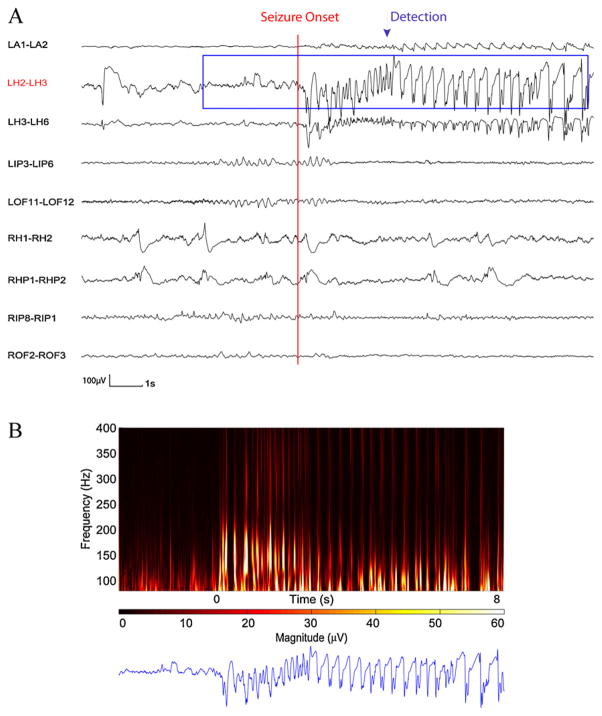
Fig. 5 illustrates a detected seizure in the training data set. In the training data set, only one seizure out of total of 15 seizures could not be detected with the automatic detector (patient 10).
Fig. 5.
Time and time–frequency representation of a section SEEG from training data set in which seizure was detected. (A) SEEG recording. (B) 10 s of time–frequency representation for the LH2–LH3 channel. The appearance of rhythmic HF activities is clearly visualized from the onset of the seizure by an increase in magnitude and is detected through the automatic detector.
This seizure was initially detected and then removed with the muscle removal procedures.
Fig. 6 demonstrates a detected seizure in the testing data set. The missed seizures in the testing data set came from five patients (patients 2, 9, 14, 15 and 18). Patient 2 had an electrographic seizure with absence of HF activities at the seizure onset and during the seizure (superimposed by 60 Hz interference at most of the channels).
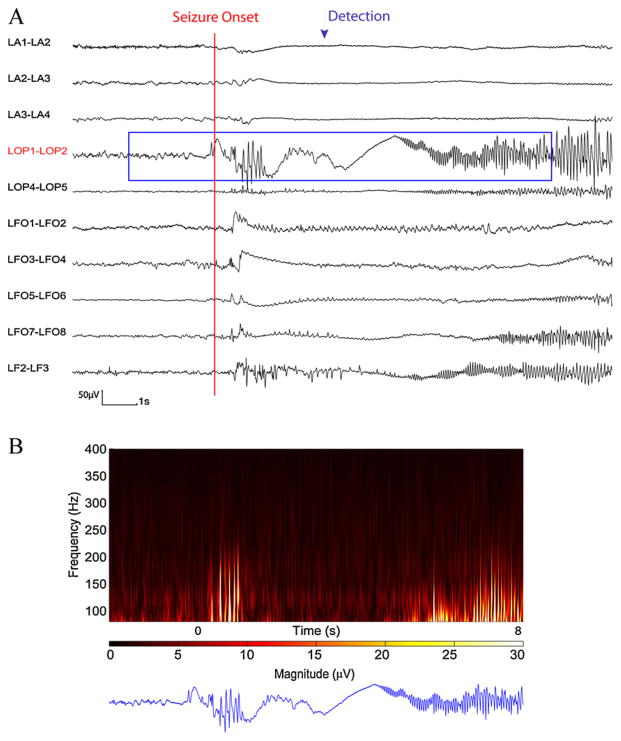
Fig. 6.
Time and time–frequency representation of a section of SEEG from test data set in which seizure was detected. (A) SEEG recording. (B) 10 s of time–frequency representation for LOP1–LOP2 channel. The appearance of HF activity is clear at the seizure onset and is detected through the automatic detector.
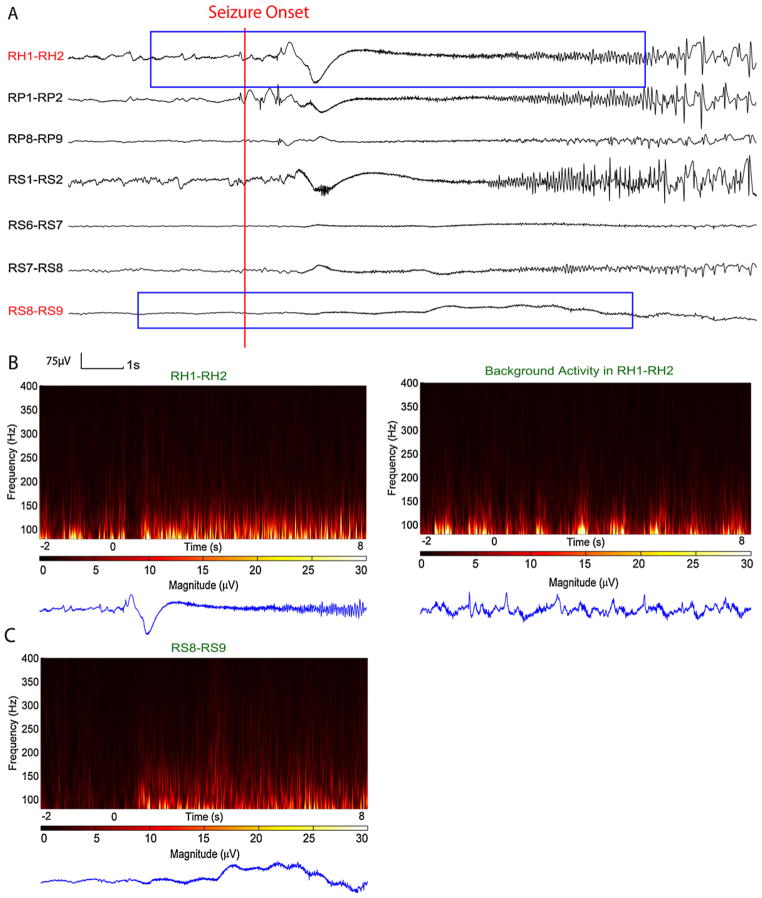
Fig. 7 shows the seizure in patient 9 which was initially detected in few channels that contained weak HF activities, however since a large portion of the candidate epoch resembled EMG activity, those detections were removed with muscle removal procedures and therefore the seizure was missed. Note that this seizure showed strong HF activities during seizure onset at some channels, but since these epochs were compared to the background and the background contained also high HF activities, there were no detections on those channels.
Fig. 7.
Time and time–frequency representation of a section of SEEG from test data set in which seizure was missed. (A) SEEG recording. (B) Time–frequency representation of channel RH1–RH2. Left: Channel RH1–RH2 show HF activity at seizure onset, however there were no detection related to this channel due to very active background, rhythmic burst of interictal HFs (right). (C) Initially there was a detection at channel RS8–RS9. This channel show very weak HF activity in time–frequency map at low frequency ranges that resembles EMG activity; therefore the EMG removal procedure discarded this detection. From visual examination this HF activity does appear due to EMG.
Patient 14 had a brief electrographic seizure with subtle HF activities present in only two channels. This seizure could be detected by lowering the threshold values.
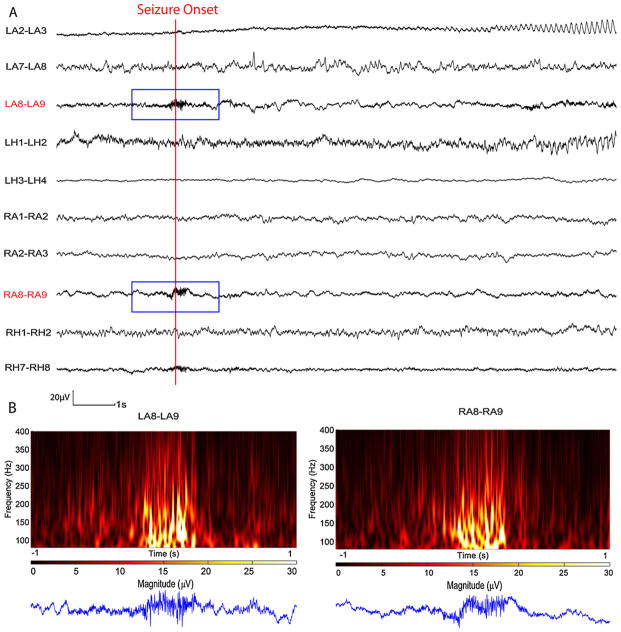
The missed seizure in patient 15 is shown in Fig. 8. It was a very low amplitude seizure and only displayed some rhythmic activity below 80 Hz at one channel (LA2–LA3) while showing some HF activities at LA8–LA9 and RA8–RA9 which were likely EMG activities. Although the activities in these two channels were initially detected, it was later correctly removed by the EMG removal procedure and therefore this seizure was not detected. The seizure in patient 18 was missed for the same reasons.
Fig. 8.
Time and time–frequency representation of a section of SEEG from test data set in which seizure was missed. (A) SEEG recording. (B) 2 s of time–frequency representation for the channels that initially detection took place. On both channels the signal resembles EMG activity and the EMG removal procedure discarded this detection appropriately, even though they occurred at seizure onset. The remaining part of the seizure did not contain more HFs than the background.
6. Discussion
There are many methods of automatic seizure detections [15,28,35]. For SEEG, detection sensitivity is high (86%) and specificity is acceptable (0.47/h) but the detection delay is long (mean delay 16.2 s) [9]. Analysis of HFs at the seizure onset [6] indicated that HFs are prominent in many seizures, and can occur from the very onset. These frequencies have not previously been considered in automatic detection techniques.
In this study, an automated seizure detection scheme was developed based on HF activities. In developing the method, the objective was to evaluate how HF activities can contribute to seizure detection by determining if it is possible to detect seizures based on HFs alone. It was particularly hoped that HF activities could improve the detection delay since they are prominent early in the discharge.
6.1. Seizure
At optimal threshold the system successfully detected seizure with overall sensitivity of 93% and 72% for the training and testing data sets respectively. For the detector to perform in a clinical setting, it was important that seizures used both in training and testing data sets were not preselected based on their characteristics. Had the data sets been restricted to a particular seizure type (e.g. low amplitude-high frequency), the sensitivity could increase considerably. Nevertheless, we feel that the system was successful enough in detecting seizures to be used in a clinical setting.
The majority of missed seizures were characterized by absent or subtle HF activities. It is not surprising that this type of seizure was missed as it has been established that some seizures show minimal amounts of HF activities [6,36]. More than half of the seizures with subtle HF activities were successfully detected. Other missed seizures were caused by EMG removal procedures, when the border between low amplitude EMG and cerebral HF activities is narrow. These missed seizures were the trade off for obtaining lower false detection rates.
6.2. False detections
Half of false detections were due to EMG artifact on more superficial electrodes. EMG artifact is rarely discussed in the context of intracerebral EEGs [34], but when dealing with low amplitude-high frequencies, and particularly during seizures, it becomes a significant problem. Although the EMG artifact removal procedure removes most of the false detections successfully, some of the weak EMG or rhythmic chewing activities cause false detections, as they resemble HF activity and their separation is a challenging task. Further work has to be done to attempt to reject the weak EMG and chewing artifacts. Short bursts of interictal HFs with or without spiking activity caused the other half of false detections. These false detections are the trade off for early detections meaning that if we decide to reduce these false detections by increasing the THEMG, it would result in increasing the detection delay.
6.3. Detection delays
Results were given as mean and median of delay times because the distribution of delays is non-Gaussian. The training data had median delay of 7 s and the testing data had median delay of 5.7 s respectively. Two seizures had earlier detection than the one marked by the experts, one from each data set. Considering that the RW length was 4.75 s, more than one third of the seizures were detected before or within the first 4.75 s of the seizure that was marked by the experts. This may suggests that selecting a shorter window in the future may further improve the detection delay.
6.4. Performance
Running on an Intel 1.7 GHz processor, the algorithm processed 1 h of 60-channel data in about 6 h. For an online detector using wavelet packets instead of CWT, which are computationally expensive, can accelerate the performance.
Comparing the results of test data versus training data, although the sensitivity of test data (72%) has decreased in comparison to training data (93%), the false detection rate and median delay have both improved (from 0.93/h to 0.72/h and from 7 s to 5.7 s). The reduction in sensitivity in the test data is unlikely to be due to over-fitting to the training data since the false detection and detection delay both improved. It is more likely caused by random fluctuations and points to the importance of a future validation with a larger group of subjects.
Future work should focus on combining the HF automatic detector with the traditional seizure detection methods. We hope that by combining the two detectors we will achieve higher sensitivity and specificity while retaining a short delay. It is quite remarkable that a relatively effective seizure detection algorithm can be developed by using only frequencies that were totally ignored by the experts marking the seizures.
Acknowledgments
Funding
Grant MOP-10189 and MOP-102710 of the Canadian Institute of Health Research.
We are grateful to Ms. Lorraine Allard from the Montreal Neurological Hospital for the help in collecting SEEG data and Dr. Gabriel Cebrian for his valuable comments.
Footnotes
Ethical approval
Not required.
Conflict of interest
None declared.
References
- 1.Hauser WA, Annegers JF, Rocca WA. Descriptive epidemiology of epilepsy: contributions of population-based studies from Rochester, Minnesota. Mayo Clin Proc. 1996;71(6):576–86. doi: 10.4065/71.6.576. [DOI] [PubMed] [Google Scholar]
- 2.Kramer U, Kipervasser S, Shlitner A, Kuzniecky R. A novel portable seizure detection alarm system: preliminary results. J Clin Neurophysiol. 2011;28(1):36–8. doi: 10.1097/WNP.0b013e3182051320. http://dx.doi.org/10.1097/WNP.0b013e3182051320. [DOI] [PubMed] [Google Scholar]
- 3.Cockerell OC, et al. Mortality from epilepsy: results from a prospective population-based study. Lancet. 1994;344(8927):918–21. doi: 10.1016/s0140-6736(94)92270-5. [DOI] [PubMed] [Google Scholar]
- 4.Gotman J. Automatic seizure detection: improvements and evaluation. Electroencephalogr Clin Neurophysiol. 1990;76(4):317–24. doi: 10.1016/0013-4694(90)90032-f. [DOI] [PubMed] [Google Scholar]
- 5.Gotman J. Automatic detection of seizures and spikes. J Clin Neurophysiol: Off Publ Am Electroencephalogr Soc. 1999;16(2):130–40. doi: 10.1097/00004691-199903000-00005. [DOI] [PubMed] [Google Scholar]
- 6.Jirsch JD, et al. High-frequency oscillations during human focal seizures. Brain: J Neurol. 2006;129(Pt 6):1593–608. doi: 10.1093/brain/awl085. [DOI] [PubMed] [Google Scholar]
- 7.Zijlmans M, et al. Ictal and interictal high frequency oscillations in patients with focal epilepsy. Clin Neurophysiol: Off J Int Federation Clin Neurophysiol. 2011;122(4):664–71. doi: 10.1016/j.clinph.2010.09.021. [DOI] [PMC free article] [PubMed] [Google Scholar]
- 8.Bragin A, et al. High-frequency oscillations in human brain. Hippocampus. 1999;9(2):137–42. doi: 10.1002/(SICI)1098-1063(1999)9:2<137::AID-HIPO5>3.0.CO;2-0. [DOI] [PubMed] [Google Scholar]
- 9.Staba RJ, et al. Quantitative analysis of high-frequency oscillations (80–500 Hz) recorded in human epileptic hippocampus and entorhinal cortex. J Neurophysiol. 2002;88(4):1743–52. doi: 10.1152/jn.2002.88.4.1743. [DOI] [PubMed] [Google Scholar]
- 10.Urrestarazu E, et al. Interictal high-frequency oscillations (100–500 Hz) in the intracerebral EEG of epileptic patients. Brain: J Neurol. 2007;130(Pt 9):2354–66. doi: 10.1093/brain/awm149. [DOI] [PubMed] [Google Scholar]
- 11.Bagshaw AP, et al. Effect of sleep stage on interictal high-frequency oscillations recorded from depth macroelectrodes in patients with focal epilepsy. Epilepsia. 2009;50(4):617–28. doi: 10.1111/j.1528-1167.2008.01784.x. [DOI] [PMC free article] [PubMed] [Google Scholar]
- 12.Khosravani H, et al. Spatial localization and time-dependant changes of electrographic high frequency oscillations in human temporal lobe epilepsy. Epilepsia. 2009;50(4):605–16. doi: 10.1111/j.1528-1167.2008.01761.x. [DOI] [PubMed] [Google Scholar]
- 13.Liu A, et al. Detection of neonatal seizures through computerized EEG analysis. Electroencephalogr Clin Neurophysiol. 1992;82(1):30–7. doi: 10.1016/0013-4694(92)90179-l. [DOI] [PubMed] [Google Scholar]
- 14.Gotman J, et al. Automatic seizure detection in the newborn: methods and initial evaluation. Electroencephalogr Clin Neurophysiol. 1997;103(3):356–62. doi: 10.1016/s0013-4694(97)00003-9. [DOI] [PubMed] [Google Scholar]
- 15.Grewal S, Gotman J. An automatic warning system for epileptic seizures recorded on intracerebral EEGs. Clin Neurophysiol: Off J Int Federation Clin Neurophysiol. 2005;116(10):2460–72. doi: 10.1016/j.clinph.2005.05.020. [DOI] [PubMed] [Google Scholar]
- 16.Kharbouch A, et al. An algorithm for seizure onset detection using intracranial EEG. EpilepsyBehav. 2011;22(Suppl 1(0)):S29–35. doi: 10.1016/j.yebeh.2011.08.031. [DOI] [PMC free article] [PubMed] [Google Scholar]
- 17.Qu H, Gotman J. A patient-specific algorithm for the detection of seizure onset in long-term EEG monitoring: possible use as a warning device. IEEE Trans Biomed Eng. 1997;44(2):115–22. doi: 10.1109/10.552241. [DOI] [PubMed] [Google Scholar]
- 18.Khan YU, Gotman J. Wavelet based automatic seizure detection in intracerebral electroencephalogram. Clin Neurophysiol: Off J Int Federation Clin Neurophysiol. 2003;114(5):898–908. doi: 10.1016/s1388-2457(03)00035-x. [DOI] [PubMed] [Google Scholar]
- 19.Subasi A. Application of adaptive neuro-fuzzy inference system for epileptic seizure detection using wavelet feature extraction. Comput Biol Med. 2007;37(2):227–44. doi: 10.1016/j.compbiomed.2005.12.003. [DOI] [PubMed] [Google Scholar]
- 20.Subasi A, Erçelebi E. Classification of EEG signals using neural network and logistic regression. Comput Methods Programs Biomed. 2005;78(2):87–99. doi: 10.1016/j.cmpb.2004.10.009. [DOI] [PubMed] [Google Scholar]
- 21.Guo L, et al. Automatic epileptic seizure detection in EEGs based on line length feature and artificial neural networks. J Neurosci Methods. 2010;191(1):101–9. doi: 10.1016/j.jneumeth.2010.05.020. [DOI] [PubMed] [Google Scholar]
- 22.Ocak H. Automatic detection of epileptic seizures in EEG using discrete wavelet transform and approximate entropy. Expert Syst Appl. 2009;36(2):2027–36. [Google Scholar]
- 23.Tzallas AT, Tsipouras MG, Fotiadis DI. Epileptic seizure detection in EEGs using time frequency analysis. IEEE Trans Inf Technol Biomed. 2009;13(5):703–10. doi: 10.1109/TITB.2009.2017939. [DOI] [PubMed] [Google Scholar]
- 24.Petrosian A, et al. Recurrent neural network based prediction of epileptic seizures in intra- and extracranial EEG. Neurocomputing. 2000;30(1–4):201–18. [Google Scholar]
- 25.Kiymik MK, Subasi A, Ozcalik HR. Neural networks with periodogram and autoregressive spectral analysis methods in detection of epileptic seizure. J Med Syst. 2004;28(6):511–22. doi: 10.1023/b:joms.0000044954.85566.a9. [DOI] [PubMed] [Google Scholar]
- 26.Nigam VP, Graupe D. A neural-network-based detection of epilepsy. Neurol Res. 2004;26(1):55–60. doi: 10.1179/016164104773026534. [DOI] [PubMed] [Google Scholar]
- 27.Sadati N, Mohseni HR, Maghsoudi A. Epileptic seizure detection using neural fuzzy networks. IEEE international conference on fuzzy systems. 2006 [Google Scholar]
- 28.Saab ME, Gotman J. A system to detect the onset of epileptic seizures in scalp EEG. Clin Neurophysiol: Off J Int Federation Clin Neurophysiol. 2005;116(2):427–42. doi: 10.1016/j.clinph.2004.08.004. [DOI] [PubMed] [Google Scholar]
- 29.Urrestarazu E, et al. High-frequency intracerebral EEG activity (100–500 Hz) following interictal spikes. Epilepsia. 2006;47(9):1465–76. doi: 10.1111/j.1528-1167.2006.00618.x. [DOI] [PubMed] [Google Scholar]
- 30.Jacobs J, et al. Interictal high-frequency oscillations (80–500 Hz) are an indicator of seizure onset areas independent of spikes in the human epileptic brain. Epilepsia. 2008;49(11):1893–907. doi: 10.1111/j.1528-1167.2008.01656.x. [DOI] [PMC free article] [PubMed] [Google Scholar]
- 31.Khalilov I, et al. Epileptogenic actions of GABA and fast oscillations in the developing hippocampus. Neuron. 2005;48(5):787–96. doi: 10.1016/j.neuron.2005.09.026. [DOI] [PubMed] [Google Scholar]
- 32.Pravin Kumar S, et al. Entropies based detection of epileptic seizures with artificial neural network classifiers. Expert Syst Appl. 2010;37(4):3284–91. [Google Scholar]
- 33.Rosso OA, et al. Wavelet entropy: a new tool for analysis of short duration brain electrical signals. J Neurosci Methods. 2001;105(1):65–75. doi: 10.1016/s0165-0270(00)00356-3. [DOI] [PubMed] [Google Scholar]
- 34.Otsubo H, et al. High-frequency oscillations of ictal muscle activity and epileptogenic discharges on intracranial EEG in a temporal lobe epilepsy patient. Clin Neurophysiol: Off J Int Federation Clin Neurophysiol. 2008;119(4):862–8. doi: 10.1016/j.clinph.2007.12.014. [DOI] [PubMed] [Google Scholar]
- 35.LeVan P, Gotman J. Computer-assisted data collection and analysis. In: Engel J Jr, Pedley TA, Aicardi J, editors. Epilepsy: a comprehensive textbook. Philadelphia: Lippincott Williams & Wilkins; 2007. [Google Scholar]
- 36.Ochi A, et al. Dynamic changes of ictal high-frequency oscillations in neocortical epilepsy: using multiple band frequency analysis. Epilepsia. 2007;48(2):286–96. doi: 10.1111/j.1528-1167.2007.00923.x. [DOI] [PubMed] [Google Scholar]


