Abstract
Purpose:
T2-weighted MRI provides excellent tumor-to-tissue contrast for target volume delineation in radiation therapy treatment planning. This study aims at developing a novel T2-weighted retrospective four dimensional magnetic resonance imaging (4D-MRI) phase sorting technique for imaging organ/tumor respiratory motion.
Methods:
A 2D fast T2-weighted half-Fourier acquisition single-shot turbo spin-echo MR sequence was used for image acquisition of 4D-MRI, with a frame rate of 2–3 frames/s. Respiratory motion was measured using an external breathing monitoring device. A phase sorting method was developed to sort the images by their corresponding respiratory phases. Besides, a result-driven strategy was applied to effectively utilize redundant images in the case when multiple images were allocated to a bin. This strategy, selecting the image with minimal amplitude error, will generate the most representative 4D-MRI. Since we are using a different image acquisition mode for 4D imaging (the sequential image acquisition scheme) with the conventionally used cine or helical image acquisition scheme, the 4D dataset sufficient condition was not obviously and directly predictable. An important challenge of the proposed technique was to determine the number of repeated scans (NR) required to obtain sufficient phase information at each slice position. To tackle this challenge, the authors first conducted computer simulations using real-time position management respiratory signals of the 29 cancer patients under an IRB-approved retrospective study to derive the relationships between NR and the following factors: number of slices (NS), number of 4D-MRI respiratory bins (NB), and starting phase at image acquisition (P0). To validate the authors’ technique, 4D-MRI acquisition and reconstruction were simulated on a 4D digital extended cardiac-torso (XCAT) human phantom using simulation derived parameters. Twelve healthy volunteers were involved in an IRB-approved study to investigate the feasibility of this technique.
Results:
4D data acquisition completeness (Cp) increases as NR increases in an inverse-exponential fashion (Cp = 100 − 99 × exp(−0.18 × NR), when NB = 6, fitted using 29 patients’ data). The NR required for 4D-MRI reconstruction (defined as achieving 95% completeness, Cp = 95%, NR = NR,95) is proportional to NB (NR,95 ∼ 2.86 × NB, r = 1.0), but independent of NS and P0. Simulated XCAT 4D-MRI showed a clear pattern of respiratory motion. Tumor motion trajectories measured on 4D-MRI were comparable to the average input signal, with a mean relative amplitude error of 2.7% ± 2.9%. Reconstructed 4D-MRI for healthy volunteers illustrated clear respiratory motion on three orthogonal planes, with minimal image artifacts. The artifacts were presumably caused by breathing irregularity and incompleteness of data acquisition (95% acquired only). The mean relative amplitude error between critical structure trajectory and average breathing curve for 12 healthy volunteers is 2.5 ± 0.3 mm in superior–inferior direction.
Conclusions:
A novel T2-weighted retrospective phase sorting 4D-MRI technique has been developed and successfully applied on digital phantom and healthy volunteers.
Keywords: 4D-MRI, T2-weighted, phase sorting, hepatic cancer
1. INTRODUCTION
Respiratory motion can cause potential errors in organ delineation and dose delivery in radiation therapy for thoracic and abdominal cancers.1 Four-dimensional computed tomography (4D-CT) has been widely used to determine patient-specific respiratory motion for individualized safety margins.2–4 4D-CT is composed of a set of 3D volumetric images reconstructed from dynamic axial 2D images acquired during free breathing. The 3D images are reconstructed at selected phases of respiratory cycles to form a 4D-CT dataset.5–9 Each of these respiratory states consists one 3D image dataset with all its component 2D slice images in one respiratory state. In order to sort the 2D CT images, a synchronized external or internal respiratory signal is usually acquired along with the CT scans. Based on the amplitude or phase of the respiratory signal, CT images are sorted into different respiratory phases.
Four dimensional magnetic resonance imaging (4D-MRI) is an emerging technique for imaging respiratory motion, especially in the abdomen. It offers several advantages over 4D-CT: (1) superior soft-tissue contrast, which allows better delineation of target volumes and organs; (2) no radiation hazard,1,10–12 which enables longer imaging time, better image quality, and more accurate measurement of respiratory motion; and (3) flexibility in imaging plane selection, which may allow for more accurate and efficient image acquisition of the respiratory motion.
Recently, several methods of 4D-MRI have been proposed. A detailed review of these studies can be found in the literature.13 In brief, there are two main approaches to develop 4D-MRI: (1) prospective 4D-MRI, which uses fast 3D MR sequences to acquire real-time volumetric images. However, due to current technical limitations, significant compromise on image quality has to be made in order to achieve the high speed of 3D MR imaging. Typical temporal and spatial resolutions of prospective 4D-MRI are approximately 1 s and 4 mm, respectively,14,15 inadequate for radiotherapy applications; (2) retrospective 4D-MRI, which uses fast 2D MR sequences to continuously acquire images for different respiratory phases at all slice locations, sorts the images by their respiratory phases. Compared to prospective 4D-MRI, retrospective 4D-MRI improves spatial/temporal resolution and reduces motion artifacts.
Cai et al. have recently developed a retrospective 4D-MRI technique using a 2D fast T2*/T1-weighted steady-state free precession (TrueFISP/FIESTA) MR sequence13 and are currently conducting a pilot trial to evaluate it in liver cancer patients.16 Initial results of the study showed that the 4D-MRI technique accurately measured respiratory motion of liver cancer patients (error <1 mm) and have improved tumor contrast compared to 4D-CT. The mean tumor contrast is 19.4 (±14.6) and 2.9 (±1.5) in 4D-MRI and in 4D-CT, respectively. While promising, the 4D-MRI technique was found to have large interpatient variation in tumor contrast, presumably due to the T2*/T1-weighting mechanism and cancer type variances.
T2-weighted MRI sequence fast recovery fast spin echo (FRFSE) is the clinical standard MR sequence for liver cancer diagnosis,17–19 often presenting higher tumor contrast than T2*/T1-weighted MRI. It is therefore highly desirable to develop 4D-MRI technique with T2-weighted contrast. However, T2-weighted MRI usually requires long repetition time and therefore results in low temporal resolution, making them suboptimal choices for 4D imaging. In compensation for the low temporal resolution of FRFSE MRI sequence, we considered using a half-Fourier acquisition single-shot turbo spin-echo (HASTE/SSFSE) MR sequence, which is a T2-weighted, high speed sequence with partial Fourier technique, for 4D-MRI image acquisition. The frame rate of HASTE/SSFSE sequence is approximately 2–3 frames/s, sufficient for 4D-MRI image acquisition. Recently, Hu et al. have proposed a prospective 4D-MRI technique based on the HASTE/SSFSE sequence.9 In their study, a respiratory triggering system was developed to prospectively guide 4D-MRI acquisition. The reconstructed 4D-MRI achieved great soft-tissue contrast. However, the technique required hardware adjustment for MR scanner. For example, triggering system was adjusted to acquire image for multiple respiratory states, rather than just one. Also, adjustments were made to display markers on the console computer during the time when k-space was sampled. The markers were used to indicate the active image acquisition period on the individual’s respiratory waveform.
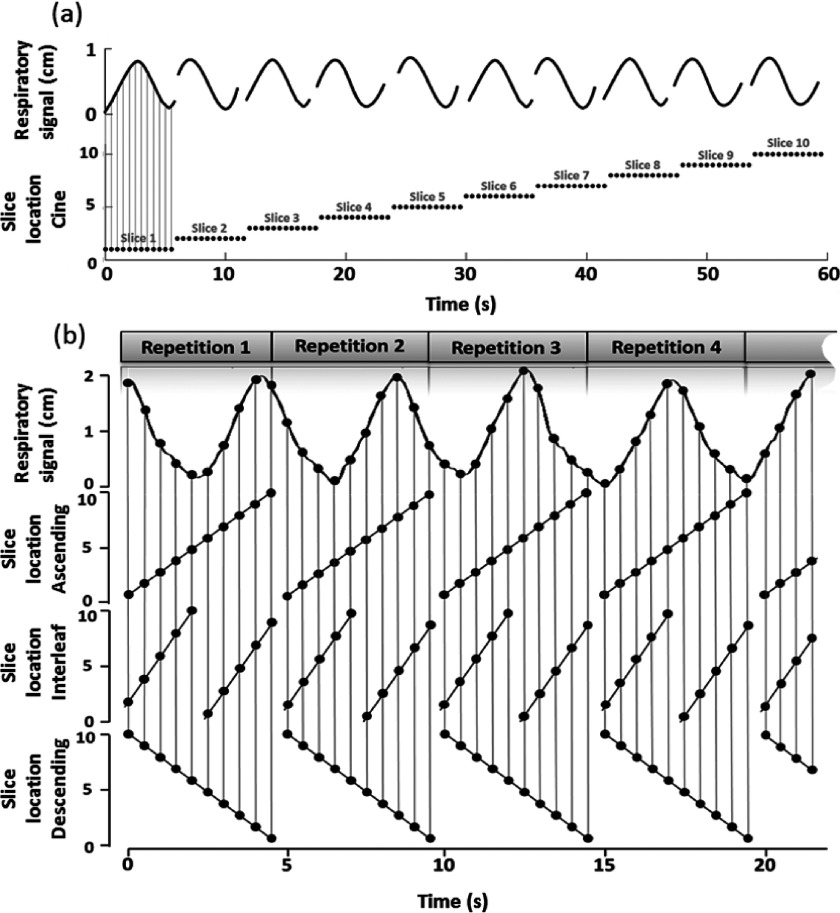
Current retrospective 4D-CT (Refs. 5–8) and 4D-MRI (Ref. 13) techniques typically acquire images in cine or slow-pitch helical mode. With these techniques, 2D images are continuously acquired at the same slice position (or nearly the same slice position in the helical mode) for a period of time. The process is then repeated at multiple slice positions to cover the volume of interest. To satisfy data completeness condition,20 i.e., when images of all sorting bins and all slice positions have been acquired, imaging time per slice position is set to be longer than patient’s breathing period. This sorting process, however, cannot be applied to retrospective T2-weighted 4D-MRI using HASTE/SSFSE sequence. HASTE/SSFSE sequence acquires image for volume of interest in sequential mode, which includes ascending, descending, and interleaved submodes. This scanning for volume of interest was repeated a preset number of times, which was pre-estimated via computer simulations. The acquisition scheme is shown in Fig. 1. With this different image acquisition scheme, our current research aim is to develop a phase sorting technique for sequential acquisition mode to utilize HASTE/SSFSE MRI sequence to reconstruct T2-weighted 4D-MRI.
FIG. 1.
Image acquisition mode comparison for cine mode (a) and T2-weighted HASTE/SSFSE MR sequential mode, which includes ascending, interleaved, and descending submodes (b). In (a), the top row shows the respiratory signal recorded and the bottom row shows the image acquisition locations. In (b), the top row demonstrates the respiratory signal recorded, and the second, third, and bottom rows demonstrate image acquisition locations for the ascending mode, interleaved mode, and descending mode, respectively.
There are mainly two problems in developing the technique. First, due to the relatively stochastic respiratory phase for each acquired 2D image, the 4D-MRI image acquisition time is not obviously and directly predictable. The 4D-MRI data sufficient condition can be affected by multiple factors, including the number of repetitions (NR), the number of slices (NS), the number of sorting bins (NB), the initial respiratory phase at the start of image acquisition (P0), the patients’ breathing period (BP), and the breathing variation (standard deviation of breathing period, BV). Second, multiple images might be sorted to one phase bin at a slice location. The image redundancy requires an effective utilization of these images to generate 4D-MRI.
In this paper, we present our approaches to resolve these challenges in developing the retrospective T2-weighted 4D-MRI. In particular, we have developed computer simulation programs to study the relationships between data completeness and associated factors. We have also developed a result-driven sorting strategy to effectively utilize redundant images for each phase bin. Our T2-weighted MRI technique has been validated and tested on a digital human phantom and healthy volunteers.
2. METHODS AND MATERIALS
2.A. Result-driven retrospective sorting
The 4D-MRI sorting technique is applied on a fast 2D MR sequence HASTE/SSFSE in the axial plane with free breathing. The sequence has high temporal resolutions (∼2 frames/s) and a good tumor visibility. The acquisition time for each 2D MR image can be synchronized with respiratory signal recorded by the external surrogate, so that the respiratory phase for each image can be calculated from the synchronized respiratory signal. No couch position movements are needed for 4D-MRI. If two peaks are detected before and after the time point of interest, the phase of the peak before will be defined as 0% and the peak after will be defined as 100%. Linear interpolation will be applied to the time points in between to determine the respiratory phase for each time point, as follows:
| (1) |
where φ is the phase for the time point of t, which is between two peaks. t0% is the time of the peak immediately before t, and t100% is the time of the peak right after t.
In the beginning of the breathing profile, for the time points before the first respiratory peak, t100% − t0% of the first incomplete breathing cycle will be estimated by the period of the cycle nearby (the first complete breathing cycle). Linear interpolation will still be applied to calculate φ for the time point t; similar process will be applied for the last breathing period of the breathing profile. Peak detection can be plotted, checked, and revised manually. By synchronizing 2D MR images and the breathing profile, phases can be derived for each image using formula (1).
The retrospective sorting is based on the calculated phases for each image. The sorting process is shown in Fig. 2. For illustration purposes, the total number of slices is set to be 8 and the total number of phase bins is set to be 6. Image acquisition and sorting for slice 1 (labeled as “s1” in Fig. 1) are illustrated as an example. Acquired images for s1 are assigned to different phase bins according to their respiratory signals. This sorting will be conducted for each slice to generate 4D-MRI dataset.
FIG. 2.
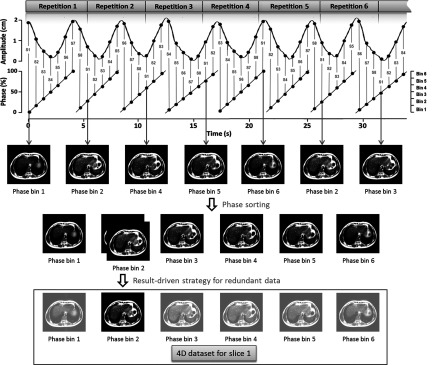
Illustration of phase sorting process with result-driven strategy. For illustration purposes, the total number of slices is set to be 8 and the total number of respiratory phase bins was set to be 6. Sequential acquisition mode is used to repeatedly (labeled as repetition no.) acquire 2D MRI images for volume of interest. Slice location information and respiratory signal are recorded with image acquisition. Red S-number is the slice location index for each 2D MR image, and respiratory phase is calculated accordingly. The sorting process is illustrated on slice 1 as an example. Seven images for slice 1 from seven repetitions come from different respiratory phases. Each of them is assigned to a phase bin. Result-driven strategy is applied to the phase bin with redundant images. The one with minimum amplitude error as compared with average breathing curve will be selected as a component of the 4D dataset.
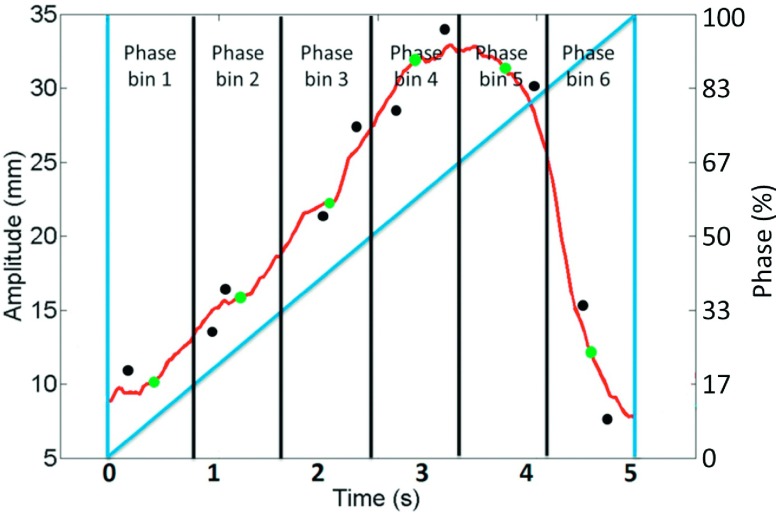
If redundant images are acquired, i.e., more than one 2D image are binned to one phase bin and result-driven strategy is applied to select the best one to generate 4D-MRI. As shown in Fig. 3, this strategy uses the average respiratory curve (gray curve), which is calculated from the entire breathing signal recorded by the external surrogate, as the targeted motion results that we are trying to achieve. The respiratory amplitudes of all the acquired images (black dots) for one bin are compared with the curve. More specifically, average amplitudes for each phase bins (gray dots on the gray curve) are calculated to be compared with the respiratory amplitude of each image (black dots). The images with minimum absolute amplitude error as compared with the average amplitude of its corresponding phase bin will be selected to generate 4D-MRI dataset.
FIG. 3.
Amplitudes of each acquired images (black dots) for each phase bin on the average respiratory curve (gray curve). The images with minimum absolute amplitude error as compared to average amplitude (gray dots on gray curve) of each phase bin will be selected to generate 4D-MRI dataset. Dark gray straight line represents phases for the respiratory curve.
As the number of repeated scan for the volume of interest increases, 4D-MRI dataset will be filled with images from each phase bin and slice location. We quantify dataset completeness (CP, %) for each slice as the relationship between the number of bins with image filled (Ni) and the total number of phase bins for this slice (NB),
| (2) |
As time increases, the dataset completeness for each slice keeps increasing. Dataset completeness simulation using one representative patient’s breathing profile has been conducted as an example to show how dataset completeness increases with time. As shown in Fig. 4 in gray bars, 20 slices as the volume of interest and 10 phase bins are demonstrated as an example. For the entire volume of interest, we extend the definition for data completeness for each slice to a volumetric definition, defining 4D dataset completeness (4D CP, %) as the relationship between the number of bins with image filled for all slices (Ni,all) and the total number of phase bins for all slices (NB,all),
| (3) |
A completeness curve can be generated to illustrate the 4D dataset collection progress as time increases, as shown in Fig. 4 black curve with NR labeled.
FIG. 4.
Dataset completeness simulation using one representative patient’s breathing profile. Dataset completeness for each slice increases with the acquisition time. 20 slices as the volume of interest and 10 phase bins are demonstrated as an example. Dataset completeness (CP, %) for each slice increases with time as illustrated by gray bars and the corresponding 4D dataset completeness (4D CP, %) curves are shown in black curve with NR labeled.
In case 4D CP (%) is less than 100%, where there could be missing images for a phase bin, the nearest adjacent phase in the same slice location will be used as a representative of that phase bin.
2.B. Digital phantom [extended cardiac-torso (XCAT)] validation study
The T2-weighted 4D-MRI technique was tested on a 4D digital XCAT human phantom21,22 with a regular breathing profile (period: 5 s). XCAT was programmed to move with the given diaphragm motion in the superior–interior (SI) direction and with the given chest wall motion in the anterior–posterior (AP) direction. The peak-to-peak motion amplitude was set to 3.0 and 1.0 cm for the diaphragm and chest wall, respectively. The XCAT images were generated only for the abdominal region using the following parameters: in-plane resolution: 256 × 256; voxel size: 1.25 mm; slice thickness: 3 mm; frame rate: 2.48 Hz. The XCAT phantom was generated in the activity mode for MRI-like image appearance where the signal intensities of the organs and tissues were assigned using values derived from HASTE/SSFSE MRI images. A hypothesized spherical tumor of 15 mm in diameter was located in the center of the liver.
The simulation of the proposed T2-weighted 4D-MRI technique was carried out on the 4D-XCAT phantom in the following steps: (1) mimicking the image acquisition of HASTE/SSFSE sequence by sequentially (ascending, descending, or interleave) extracting axial 2D XCAT images from the 4D-XCAT phantom for a volume of interest; (2) repeating Step 1 for a number of times. The number of repetitions should be large enough to satisfy data completeness condition, as demonstrated in Sec. 2.A. In this phantom study, the total number of repetition was set as 30; (3) calculating the respiratory phase for each extracted 2D XCAT image; and (4) generating the simulated T2-w “4D-MRI” by rebinning the 2D XCAT images using the result-driven retrospective sorting method. The total number of phase bins was set as 10 in this phantom study.
The simulated 4D-MRI using the phase sorting technique was validated by comparing it with the original 4D-XCAT phantom which was generated using the same respiratory motion profiles and imaging parameters. The motion trajectories of the hypothesized tumor were determined from the simulated 4D-MRI and compared to those measured from the original 4D-XCAT images. The relative amplitude error in motion trajectories was calculated in SI and AP directions.
2.C. Digital (XCAT) phantom studies of variable breathing: Data completeness and impacting factors
In order to estimate the image acquisition time needed for retrospective T2-weighted 4D-MRI and to study the relationships between data completeness and potential affecting factors (NR, NS, NB, P0, BP, and BV), we performed a computer simulation study using simulated irregular respiratory signals and real patients’ respiratory signals. The simulated signals included 2500 irregular breathing profiles whose periods were between 0 and 10 s with random breathing variations. Patients’ respiratory signals were the real-time position management (RPM) (Varian Medical Systems, Inc., Palo Alto, CA) breathing signals recorded during the patients’ clinical 4DCT scans. A total of 29 cancer patients’ (13 females and 16 males, 10 abdominal cancers and 19 lung cancers) RPM signals were used in the simulation. We repeated the whole RPM data trace when the total duration was not long enough for the 4D-MRI simulation. The 29 cancer patients were enrolled in an IRB-approved retrospective study. All three image acquisition modes (ascending, interleaved, and descending) were tested in the simulation.
As the total number of 2D MR images acquired increases, the 4D dataset completeness increases, until it reaches 100%. A threshold of completeness should be determined to measure the total scanning time needed to acquire enough 2D images for 4D reconstructions. In our simulation, in order to estimate the threshold, a regular breathing motion profile and 29 patients’ breathing motion profiles were used as an input for XCAT to control its motion, with the moving tumor diameter set at 15 mm. Different scans or exam times were simulated by sampling contiguous motion subsets of the simulated XCAT data, setting the total number of slices at 30 and the number of bins at 8 for regular breathing motion profile (6 for patients’ breathing motion profiles). With the reconstructed 4D images for different total scanning time, the trajectory of the tumor in SI direction of the tumor in each phase bin can be measured and compared to the original input for XCAT, and relative amplitude error was calculated. Based on the relationship between percentage of completeness and the relative trajectory amplitude error, threshold of the completeness percentage can be determined.
With the threshold set above, completeness curves were calculated for each of the 29 patients’ respiratory profiles, and the number of repeated scans when completeness reached the set threshold (NR, threshold) was measured. The total number of bins was set to be 6 and the total number of slices was set to be 30 for phase sorting. Different image acquisition and 4D reconstruction parameters including the total number of phase bins (NB), the total number of slices (NS) of the volume of interest, and the starting phase of the scanning (P0) were tested. The relationship between NR, threshold and the above parameters was investigated.
Furthermore, NR, threshold could be influenced by the respiratory motion irregularity. The 2500 respiratory profiles were not related to the 29 patients’ breathing profiles. They were generated separately by varying BP (ranges from 0 to 10 s, the interval is 0.2 s) and BV (ranges from 0 to 5 s, the interval is 0.1 s) to study the relationship between the breathing irregularity and NR,threshold. To generate breathing irregularities in any one of these breathing profiles, random (and thus different) period values were assigned to each breathing cycle of the profile, where the period values were generated based on each breathing profile’s BP and BV values.
2.D. Healthy volunteer study
To evaluate our phase sorting technique for 4D-MRI, 12 healthy volunteers (six females and six males) were enrolled in an IRB-approved study. 4D-MRI image acquisition was performed employing the HASTE/SSFSE sequence. The image acquisition mode was sequentially acquiring 2D MR images for volume of interest, and then repeating the volumetric acquisition for a preset number of times, which is pre-estimated as described in Sec. 2.C. Single-slice cine MR images were also acquired in the axial, coronal, and sagittal planes across the center of the critical structure (vessels in liver), providing an estimate of ground-truth of respiratory motion for comparison. All images were acquired in a 3 T Siemens clinical scanner. The subjects were positioned head-first-supine with arms down in the absence of immobilization devices and were instructed to keep normal respiration during the scans. Imaging parameters involved were repetition time (TR)/echo time (TE), 975/59 ms; field of view (FOV), 350 × 317.19 mm; flip angle, 115°; slice thickness, 5 mm; matrix, 256 × 232; bandwidth, 781 Hz/pixel. Healthy volunteers had different total number of slices. The range of the total number of slices was chosen to range from 15 to 35, and average total number of slices was 28 ± 5. The numbers of repetition for all healthy volunteers were estimated based on the simulation (described in Sec. 2.C) results and imaging parameters (NR, NS, NB) used for each healthy volunteer. Imaging frame rate was approximately 2 frames/s. Breathing signals were recorded during image acquisition using Siemens’ physiological monitoring unit (PMU)28,29 system with the bellows wrapped around the abdominal region. The sample rate was 50 Hz. In our case, the computer drive PMU was the same with the one connected to the MR scanner, so MR image acquisition time can be synchronized with the time information recorded in the logging file generated by PMU. The PMU data logging was initiated manually via commands to the PMU/scanner computer before the sequence run. Time stamps in the header of the PMU log file were used to associate the PMU trace with the 2D image acquisition times, which was recorded in the header of image file. 4D-MRI were reconstructed using the result-driven, retrospective sorting technique described earlier in Sec. 2.A. The total number of 4D-MRI phase bins was selected to be 6 for all healthy volunteers. Tumor motion trajectories in the SI, AP, and medial–lateral (ML) directions were determined from 4D-MRI and compared with those from single-slice cine MR images, which served as references. On single-slice cine MR images, the same ROIs were tracked as on 4D-MRI. The ROI motion in SI and AP directions was tracked on sagittal cine, and its motion in ML direction was tracked on coronal cine. These tracking cine planes were selected because they have less interplane motion.
3. RESULTS
3.A. Digital phantom (XCAT) validation study
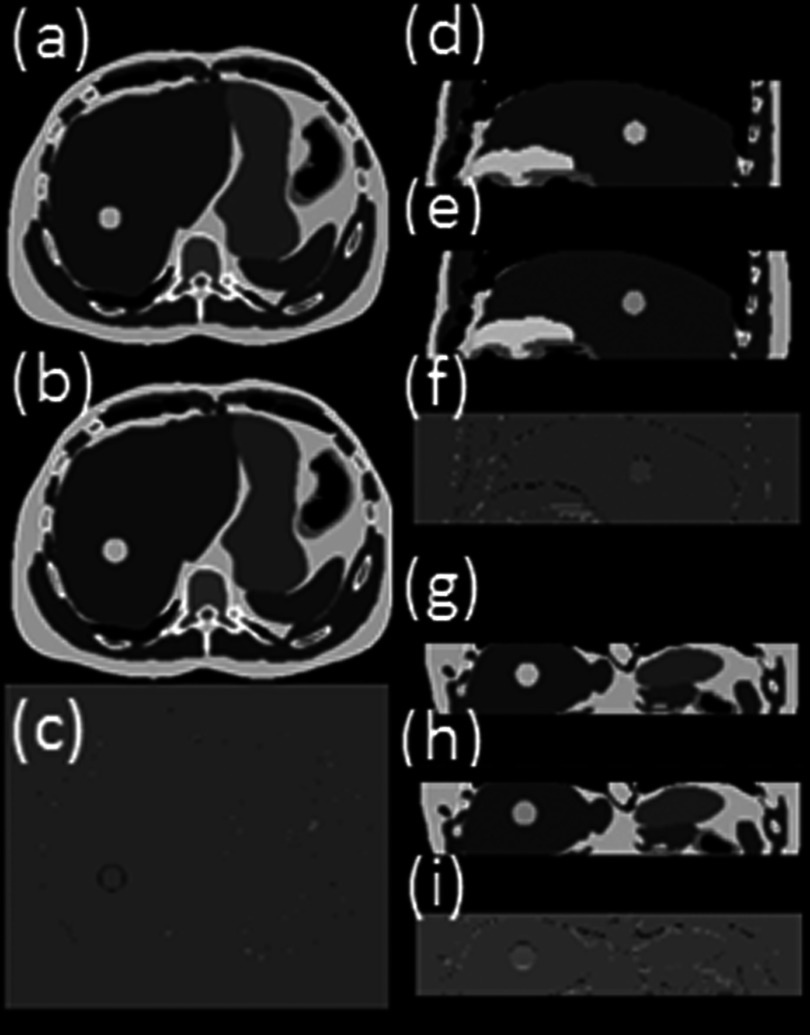
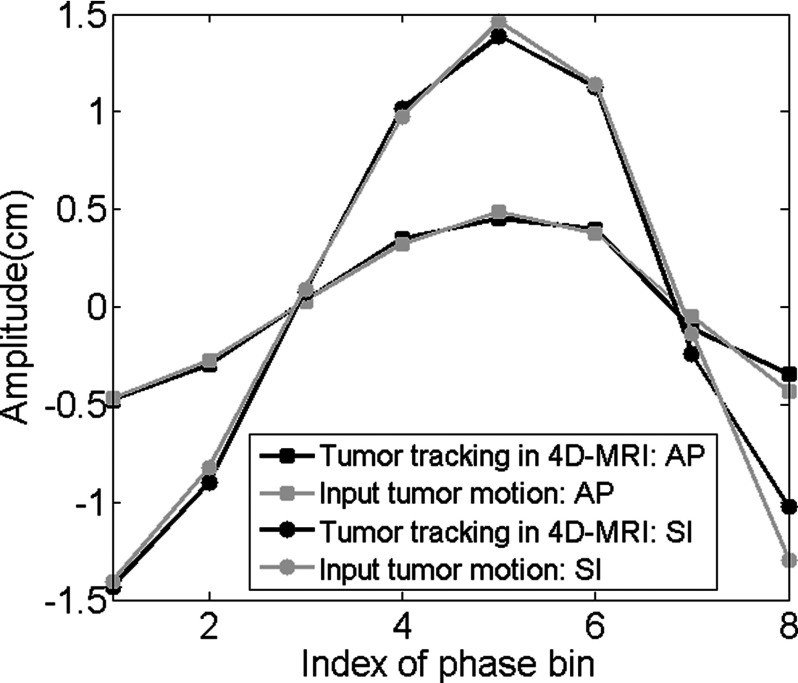
The 4D reconstruction results for ascending, interleaved, descending image acquisition modes are very similar. Nearly no obvious difference can be observed from the image. Figure 5 shows the simulated 4D-MRI (only phase 5 is shown as a representative) for ascending mode of the XCAT phantom and its comparison with the original 4D XCAT phantom. The two image sets in general matched well; only minor differences were found at the edge of organs, as shown in Figs. 5(c), 5(f), and 5(e). The comparison of motion trajectories of the hypothesized tumor on reconstructed 4D-MRI and average respiratory curve calculated from input are shown in Fig. 6. Those measured from reconstructed 4D-MRI matched well with the input motion profile: the mean (±SD) relative amplitude error in motion amplitude is 2.7(±2.9)% in SI direction and 3.4(±3.0)% in AP direction.
FIG. 5.
Reconstructed 10-bin T2-weighted 4D-MRI (only phase 5 is shown as a representative) simulated with XCAT phantom in axial (a), sagittal (d), and coronal (g) view, in comparison with the original 4D XCAT images [(b), (e), and (h)]. The differences between the two are shown in panels (c), (f), and (i) respectively. This is the XCAT simulation results where breathing motion was strictly regular and the data sufficiency condition was met. The total number of repetition (NR) was set as 30 for the simulation scan.
FIG. 6.
Motion trajectories comparison of the hypothesized tumor in SI and AP direction. This is the XCAT simulation results where breathing motion was strictly regular and the data sufficiency condition was met.
3.B. Digital (XCAT) phantom studies of variable breathing: Data completeness and impacting factors
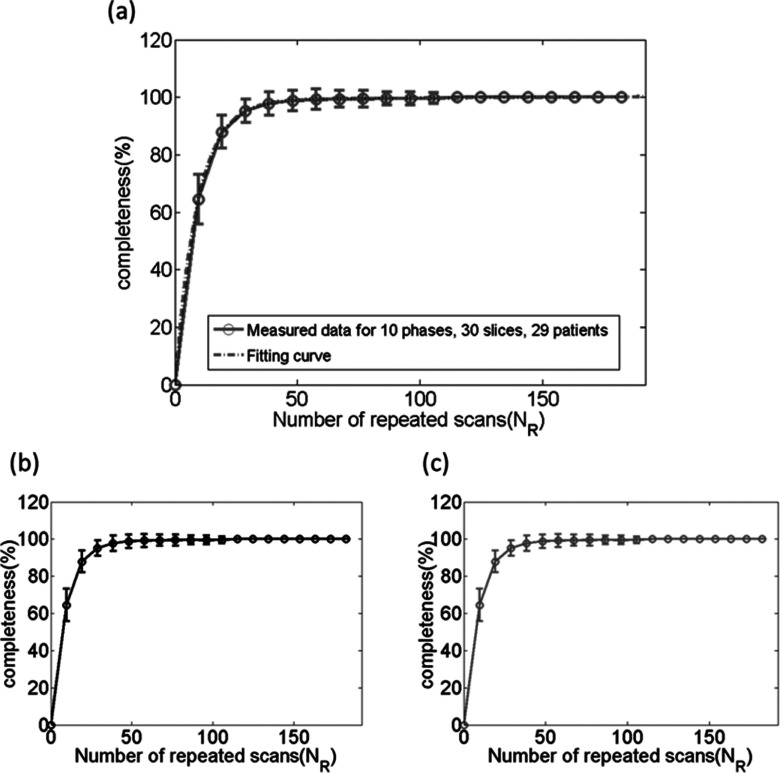
As expected, the percentage of data completeness increases as NR increases, as shown as an example in Fig. 4. The relationship between the two can be best fitted by an inverse exponential function [formula (4)]. Figure 7 shows the average curves with error bars of the percentage of data completeness as a function of NR on average of 29 patients for three acquisition modes: ascending (a), descending (b), and interleaved (c). It was found there is no difference in the relationship between the three acquisition modes. The best function to describe the relationship was found to be
| (4) |
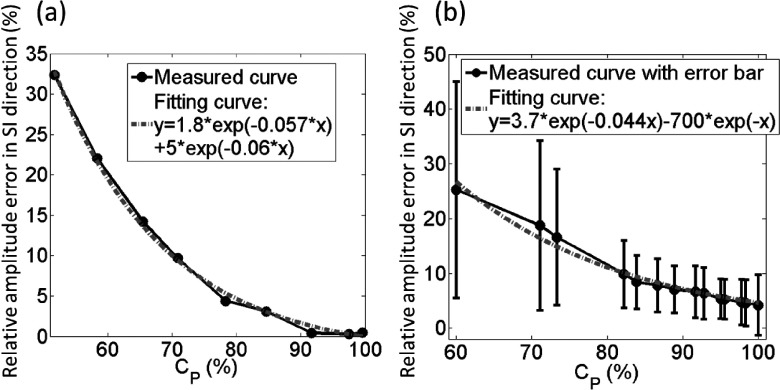
According to the function, it can be seen that 100% data completeness would require a very large value of NR. In practical, missing a very small percentage of data does not cause clinically significant differences. From the relationship between error in tumor motion measurement and the percentage of data completeness derived, the error decreases as the percentage of data completeness increases and reaches a stable stage at approximately 95% of data completeness, as shown in Fig. 8 for both regular breathing motion (a) and patients’ breathing motions (b). Both regular breathing motion case and patients’ breathing motion case indicate that 95% of data completeness, labeled as NR,95, is sufficient for 4D-MRI image acquisition. We therefore define NR,95 as the number of repetition needed for 4D-MRI image acquisition.
FIG. 7.
Completeness curve for 29 patients in three acquisition modes: (a) ascending, (b) descending, and (c) interleaved. Acquisition mode does not affect the completeness of 4D dataset acquisition. This is the simulation result using 29 patients’ RPM breathing traces.
FIG. 8.
Relationship between percentage of completeness (Cp) and the relative amplitude error of tumor trajectory in SI direction. These figures show XCAT simulation results using (a) strictly regular breathing motion and (b) 29 patients’ breathing profiles. In both cases, the relative amplitude error decreases as the percentage of data completeness increases and reaches a stable stage at approximately 95% of data completeness.
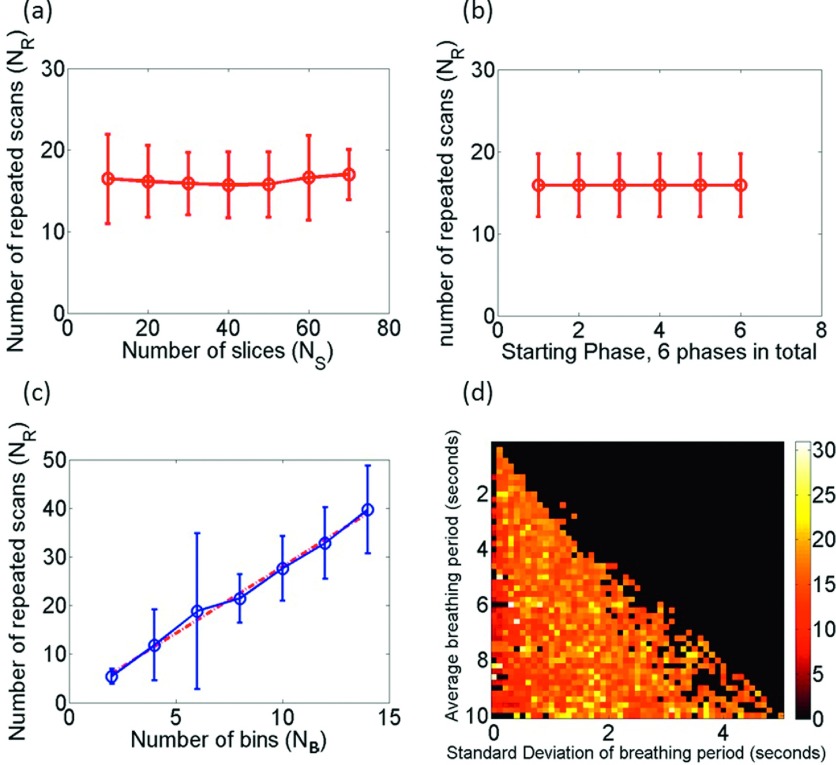
The relationships between NR,95 and affecting factors (NB, NS, P0, BP, BV) were further investigated and are illustrated in Fig. 9. It was found that NR,95 has a linear relationship with NB and is nearly independent of NS and P0. There is a slight trend that BP is positively correlated with NR,95, but no clear correlation between NR,95 and BV.
FIG. 9.
(a) NR,95 is independent of NS; (b) NR,95 is independent of P0; and (c) linear relationship between NR,95 and NB. (d) NR,95 is not significantly affected by the irregularity of respiratory. Specifically, in (a)–(c), 29 patients’ breathing profiles were used to statistically analyze the relationship between the parameters. However, in Fig. (d), 2500 simulated respiratory profiles with different BP and BV have been generated to test the relationship between breathing irregularity and NR,95.
3.C. Healthy volunteer study
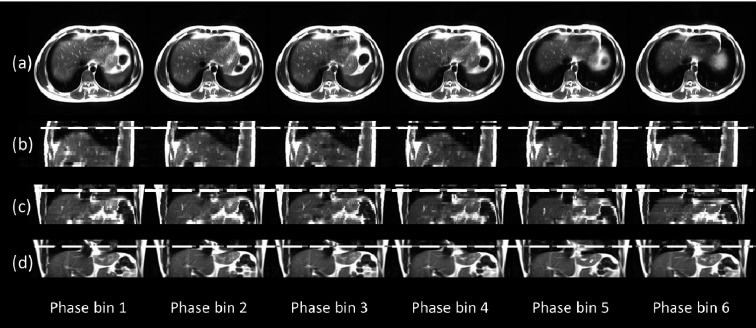
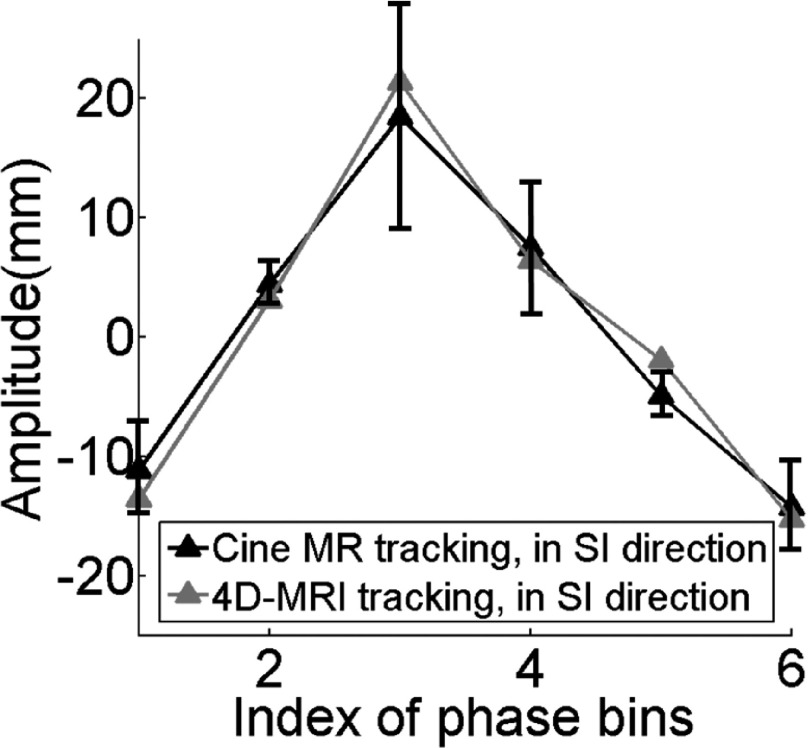
Figure 10 illustrates an example of the breathing signal and the data completeness curve from a representative subject. Figure 11 shows the six-phase 4D-MRI images in the axial (a), sagittal (b), and coronal (c) views of the representative, healthy volunteer no. 5. Reconstructed coronal 4D-MRI images of him generally matched well with coronal cine MR images, as illustrated in a Figs. 11(c) and 11(d). ROI tracking has been measured on both reconstructed 4D-MRI and coronal cine MR for comparison. The trajectories are shown in Fig. 12. The error bar shows the motion range of one critical structure (vessel) measured on cine MR at different breathing cycles for each respiratory phase. The absolute motion trajectory amplitude error for this representative healthy volunteer is 2.0 ± 1.2 mm. For all 12 healthy volunteers, 4D-MRI was reconstructed to six phase bins. Based on the data completeness and impacting factors simulation results show in Sec. 3.B, NR was only affected by NB. Since we set NB as 6 for all healthy volunteers, according to Fig. 9(c), NR was set to be about 20. The range of NR was selected to range from 15 to 30, and average NR was 20 ± 4. Image acquisition modes included all three available modes (ascending, interleaved, and descending). In summary, the average 4D reconstruction final completeness is 96.2 ± 3.5; the average scanning time required for six bin reconstruction is 15.8 repetitions, which matched with the results from digital phantom study. Average absolute motion trajectory amplitude error is for all healthy volunteers is 2.5 ± 0.3 mm.
FIG. 10.

(a) Part of the relative respiratory amplitude signal measured by bellows system. Phases were calculated according to the amplitudes. (b) Completeness curve for one representative healthy volunteer, with total 20 slices, 20 measurements, 6 phase bins, and maximum 99.1667% completeness. Scanning time required for 4D reconstruction is 14 repeated scans of volume of interest.
FIG. 11.
Reconstructed 4D-MRI for one represents healthy volunteer in axial view (a), sagittal view (b), coronal view (c), and in comparison with T2-weighted cine in coronal view (d).
FIG. 12.
Critical structure trajectories from 4D-MRI matched well with those from single-slice cine MR. The error bar shows the motion range of one critical structure (vessel) measured on cine MR at different breathing cycles for each respiratory phase. This figure shows the results of one representative healthy volunteer.
4. DISCUSSION
In this study, we investigated the feasibility of a retrospective T2-weighted 4D-MRI phase sorting method. The scanning time required for 4D reconstruction was estimated and its relationships between each reconstruction parameter were explored. The preliminary results demonstrate that the phase sorting technique is feasible for MRI sequences with sequential image acquisition modes, including ascending, interleaved, and descending. The T2-weighted 4D-MRI technique can be applied on liver, pancreas, and many other abdominal regions, even the lung region. However, further development of image quality and decreasing the required scanning time could be desirable and promising for our future research. The image quality improvement could be achieved via many approaches,31 including hardware upgrades and software developments. Shortening the required scanning time would be achieved by a more comprehensive sorting technique, taking amplitude sorting or other sorting method into consideration.
Among the 12 healthy volunteers we tested on, only one (healthy volunteer number 6) failed to reach the 95% completeness threshold. The respiratory signal from this healthy volunteer was found to be very irregular. Several segments of breathing were shown as vibration with small amplitudes. These segments led to useless image data since it was difficult to calculate the phases for the images acquired during the vibration segments.
A result-driven sorting technique was introduced in this study. This result-driven strategy selects the most representative image from redundant images for each phase bin. The respiratory motion revealed in 4D-MRI will be closest to the average motion of the scanning period because the result-driven mechanism will choose the image with the minimum amplitude error as compared to the average breathing curve. With longer scanning time, more redundant images could be acquired. With more images, we have a larger pool of images to choose from the most representative images of a particular phase. That meant a larger probability of achieving a lower amplitude error as compared with the average breathing curve. This may lead to less volume inconsistency artifacts. Although acquiring more redundant MRI images will need a longer scanning time, larger radiation dose for human subjects is not a concern for 4D-MRI as opposed to 4D-CT. In addition, although the MRI scanning time could be relatively longer than 4D-CT, it should be under controlled considering human subjects’ tolerance for the scan heating. Therefore, the required scanning time and data sufficient condition study are necessary.
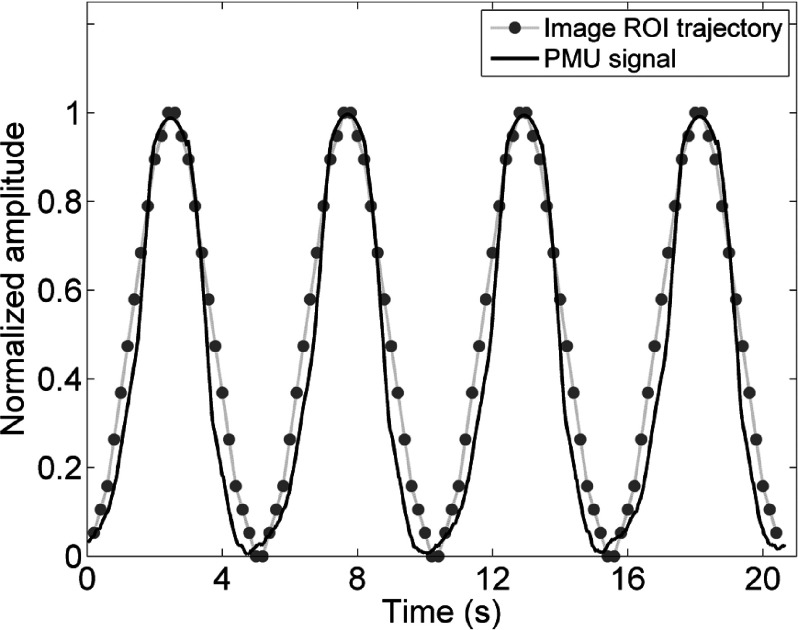
PMU is a widely used external surrogate for respiratory motion. It has been reported to be used in many studies.20,28,29 Although PMU has uncertainties, our method assumes that the PMU signal has constant gain (i.e., retains its amplitude calibration) over the duration of image acquisition. The uncertainties of PMU have limited impact on our study. In order to estimate the PMU accuracy for our study, a phantom study was conducted to compare PMU signal with phantom motion. The phantom was an in-house constructed MRI-compatible motion water phantom. It consisted of a MRI-compatible motion stage and a surgical low-elastic stick attached to it. The motion stage consisted of a supporting platform (2 cm foam slab), a foam motion box as a container with a 3 × 3 × 5 cm water phantom, and two bottles of water used to amplify MR signal. The motion stage was driven by a motor using the stick. The motor was set to move in a sinusoidal wave (peak-to-peak amplitude = 2.0 cm, period = 5 s), driving the motion stage to move in the same pattern. Consequently, the imaging object moved along the SI direction. During the MR experiments, the motion stage was placed in the MR scanner while the motor was placed approximately 3 m away from the center of the scanner. Sagittal single slice cine was acquired on a Siemens 3 T system using a TrueFISP/FIESTA sequence with head coil. Imaging parameters were TR/TE: 186.78/1.25 ms; FOV: 300 × 253.12 mm; flip angle: 52°; slice thickness: 5 mm; matrix: 192 × 162; pixel size 1.56 × 1.56 mm. Frame rate was approximately 5 frames/s. Sagittal cine was acquired for 21 s. The respiratory bellow was wrapped on the motor to measure the motion. The PMU signal was recorded and compared with ROI trajectory from cine. Figure 13 illustrated the PMU signal and ROI trajectory comparison. They matched well with each other. It can be observed that the peaks can be accurately determined from PMU signal, so PMU could be accurate enough for phase-based binning. It should be noticed that the average scanning time in our healthy volunteers study was about 8 min. The PMU signal can slowly drift over the time period of minutes. The drift has been reported to have a temporal scaling factor of about 1.003 or 0.3% per unit time.20,32 Dedrifting of PMU signal may help selecting the most representative image for each phase bin during the result-driven retrospective sorting process. Investigation of appropriate dedrifting methods will be included in our future study.
FIG. 13.
The comparison of the PMU signal with the ROI trajectory from sagittal cine images for a motion phantom. This phantom study was conducted to estimate PMU signal accuracy.
Our study has some similarities with other retrospective sorting studies regarding to needing of dealing with data redundancy problem. In Ref. 20, they deal with the problem by combining the redundant images in one phase bin at a slice location to derive a representative final image. However, in our present study, we assume that internal motion is correlated with the amplitude of the external surrogate. We select one “most representative” frame with minimum amplitude error as compared with average breathing curve. Furthermore, our study has major differences/improvements compared to the other 4D-MRI sorting techniques reported in the literature:20 (1) data sufficient condition was studied using the 29 patients’ breathing signals in our study. Relationship between scanning parameters and necessary 4D-MRI acquisition time was established. These are new and important developments compared to the technique introduced in Ref. 20; (2) all MRI sequences’ acquisition modes, ascending, interleaf, and descending have been incorporated into our phase sorting technique. Reference 20 only developed sorting technique for interleave mode of HASTE sequence. Although in Ref. 20, ascending mode has been studied for TrueFISP sequence, TrueFISP provides T2*/T1-w MRI not T2-w MRI. As we measured on 11 cancer patients, compared to their T2-w MRI, their T2*/T1-w MRI has significant (sign test p-value = 0.02) lower tumor-to-tissue contrast. The 11 cancer patients were enrolled in an IRB-approved retrospective study; (3) result-driven sorting method was a new sorting method that has been developed in our study; (4) our 4D-MRI sorting method was tested on 12 healthy volunteers using HASTE sequence, which provide T2-w MRI. The technique introduced in Ref. 20 was tested on only one human subject using HASTE sequence.
The technique we developed can be applied to other planes. However, our study is a feasibility study in which we applied the technique on axial plane as a test. We have done MRI studies on other planes.30 Applying our technique on other planes is in our future investigation plan.
4D-MRI aims at not only providing the respiratory motion trajectory information, the organ/tumor volume, and volume variations during respiratory are also important. Tracking the respiratory motion was simply used as our way to evaluate the 4D-MRI technique we developed. Acquiring the trajectory is not the aim of developing 4D-MRI.
Even though the preliminary results validated that the retrospective phase sorting is a good reconstruction for T2-weighted MRI, further investigation on patients is needed. There are still several problems to be clarified: (1) how does respiratory irregularity affect the image quality quantitatively? (2) The external surrogate was placed near but not in the volume of interest, will that affect the accuracy of phase calculation? In other words, what if the tumor motion is not correlated with the motion measured by the bellows system?23 (3) Is phase sorting a better resorting technique than other rebin techniques20–22,24–27 if only sequential image acquisition is available?
There are several limitations in this study. First, a signal threshold for the 4D dataset completeness was set. This threshold is determined by testing a regular breathing signal. However, each subject has a unique respiratory pattern that might be different from the regular representative respiratory signal. A self-adjusted threshold may be developed for the determination of threshold. Second, because of different breathing patterns for different subjects, the period for average breathing cycles could be considerably different. Determining a reasonable total number of phase bins specifically for each subject before 4D-MRI image acquisition using the breathing pattern analysis results could be our future study topic. Third, the average scanning time for the healthy volunteers in the study was about 8 minutes, which is still long for clinical use. It can be reduced by improving data utilization efficiency via sophisticated sorting algorithms and image post processing methods. The scanning procedure may also be simplified by using image-based respiratory surrogates13,33–35 to improve the convenience and efficacy of this technique for clinical use. Furthermore, the number of human subjects in our study is limited and there is no abdominal or lung cancer patient data. Although there are publications reporting that no significant difference of respiratory motion patterns is found between healthy subjects and abdominal or lung cancer patients,27 patient study is still desirable for the phase sorting technique on sequential image acquisition mode. Patient study is needed to verify the tumor contrast-to-noise ratio (CNR) improvement as compared to T2*/T1-based 4D-MRI. Further assessments are required to test the accuracy and robustness of the technique with a larger pool of healthy volunteers and patients.
5. CONCLUSION
In this study, a novel T2-weighted 4D-MRI retrospective phase sorting technique based on HASTE/SSFSE sequence has been developed. Compared to other 4D imaging techniques, this phase sorting technique can be successfully applied to T2-weighted MRI sequence HASTE/SSFSE which is devoid of cine mode. Scanning time required for 4D reconstruction has been evaluated. The feasibility has been demonstrated on digital phantom and healthy volunteers using bellows system as the surrogate for free breathing.
ACKNOWLEDGMENTS
This work is partly supported by funding from NIH (No. 1R21CA165384) and a research grant from the Golfers Against Cancer (GAC) Foundation.
REFERENCES
- 1.Hugo G. D. and Rosu M., “Advances in 4D radiation therapy for managing respiration: Part I–4D imaging,” Z. Med. Phys. 22(4), 258–271 (2012). 10.1016/j.zemedi.2012.06.009 [DOI] [PMC free article] [PubMed] [Google Scholar]
- 2.Keall P., “4-dimensional computed tomography imaging and treatment planning,” Semin. Radiat. Oncol. 14(1), 81–90 (2004). 10.1053/j.semradonc.2003.10.006 [DOI] [PubMed] [Google Scholar]
- 3.Low D. A., Nystrom M., Kalinin E., Parikh P., Dempsey J. F., Bradley J. D., Mutic S., Wahab S. H., Islam T., Christensen G., Politte D. G., and Whiting B. R., “A method for the reconstruction of four-dimensional synchronized CT scans acquired during free breathing,” Med. Phys. 30, 1254–1263 (2003). 10.1118/1.1576230 [DOI] [PubMed] [Google Scholar]
- 4.Mageras G. S., Pevsner A., Yorke E. D., Rosenzweig K. E., Ford E. C., Hertanto A., Larson S. M., Lovelock D. M., Erdi Y. E., Nehmeh S. A., Humm J. L., and Ling C. C., “Measurement of lung tumor motion using respiration-correlated CT,” Int. J. Radiat. Oncol., Biol., Phys. 60, 933–941 (2004). 10.1016/j.ijrobp.2004.06.021 [DOI] [PubMed] [Google Scholar]
- 5.Vedam S. S., Keall P. J., Kini V. R., Mostafavi H., Shukla H. P., and Mohan R., “Acquiring a four-dimensional computed tomography dataset using an external respiratory signal,” Phys. Med. Biol. 48(1), 45–62 (2003). 10.1088/0031-9155/48/1/304 [DOI] [PubMed] [Google Scholar]
- 6.Rietzel E., Pan T., and Chen G. T., “Four-dimensional computed tomography: Image formation and clinical protocol,” Med. Phys. 32, 874–889 (2005). 10.1118/1.1869852 [DOI] [PubMed] [Google Scholar]
- 7.Lu W., Parikh P. J., El Naqa I. M., Nystrom M. M., Hubenschmidt J. P., Wahab S. H., Mutic S., Singh A. K., Christensen G. E., Bradley J. D., and Low D. A., “Quantitation of the reconstruction quality of a four-dimensional computed tomography process for lung cancer patients,” Med. Phys. 32, 890–901 (2005). 10.1118/1.1870152 [DOI] [PubMed] [Google Scholar]
- 8.Gianoli C., Riboldi M., Spadea M. F., Travaini L. L., Ferrari M., Mei R., Orecchia R., and Baroni G., “A multiple points method for 4D CT image sorting,” Med. Phys. 38, 656–667 (2011). 10.1118/1.3538921 [DOI] [PubMed] [Google Scholar]
- 9.Hu Y., Caruthers S. D., Low D. A., Parikh P. J., and Mutic S., “Respiratory amplitude guided 4-dimensional magnetic resonance imaging,” Int. J. Radiat. Oncol., Biol., Phys. 86(1), 198–204 (2013). 10.1016/j.ijrobp.2012.12.014 [DOI] [PMC free article] [PubMed] [Google Scholar]
- 10.Vinogradskiy Y. Y., Balter P., Followill D. S., Alvarez P. E., White R. A., and Starkschall G., “Comparing the accuracy of four-dimensional photon dose calculations with three-dimensional calculations using moving and deforming phantoms,” Med. Phys. 36, 5000–5006 (2009). 10.1118/1.3238482 [DOI] [PubMed] [Google Scholar]
- 11.Pan T., Lee T. Y., Rietzel E., and Chen G. T., “4D-CT imaging of a volume influenced by respiratory motion on multi-slice CT,” Med. Phys. 31, 333–340 (2004). 10.1118/1.1639993 [DOI] [PubMed] [Google Scholar]
- 12.Tian Z., Jia X., Dong B., Lou Y., and Jiang S. B., “Low-dose 4DCT reconstruction via temporal nonlocal means,” Med. Phys. 38(3), 1359–1365 (2011). 10.1118/1.3547724 [DOI] [PubMed] [Google Scholar]
- 13.Cai J., Chang Z., Wang Z., Segars W. P., and Yin F., “Four-dimensional magnetic resonance imaging (4D-MRI) using image-based respiratory surrogate: A feasibility study,” Med. Phys. 38(12), 6384–6394 (2011). 10.1118/1.3658737 [DOI] [PMC free article] [PubMed] [Google Scholar]
- 14.Dinkel J., Hintze C., Tetzlaff R., Huber P. E., Herfarth K., Debus J., Kauczor H. U., and Thieke C., “4D-MRI analysis of lung tumor motion in patients with hemi-diaphragmatic paralysis,” Radiother. Oncol. 91, 449–454 (2009). 10.1016/j.radonc.2009.03.021 [DOI] [PubMed] [Google Scholar]
- 15.Blackall J. M., Ahmad S., Miquel M. E., McClelland J. R., Landau D. B., and Hawkes D. J., “MRI-based measurements of respiratory motion variability and assessment of imaging strategies for radiotherapy planning,” Phys. Med. Biol. 51, 4147–4169 (2006). 10.1088/0031-9155/51/17/003 [DOI] [PubMed] [Google Scholar]
- 16.Yang J., Cai J., Wang H., Chang Z., Czito B., Bashir M., and Yin F., “Four-dimensional magnetic resonance imaging using axial body area as respiratory surrogate: Initial patient results,” Int. J. Radiat. Oncol., Biol., Phys. 88(4), 907–912 (2014). 10.1016/j.ijrobp.2013.11.245 [DOI] [PMC free article] [PubMed] [Google Scholar]
- 17.Mattison G. R., Glazer G. M., Quint L. E., Francis I. R., Bree R. L., and Ensminger W. D., “MR imaging of hepatic focal nodular hyperplasia: Characterization and distinction from primary malignant hepatic tumors,” Am. J. Roentgenol. 148(4), 711–715 (1987). 10.2214/ajr.148.4.711 [DOI] [PubMed] [Google Scholar]
- 18.Sahani D. V. and Sanjeeva P. K., “Imaging the liver,” Oncologist 9(4), 385–397 (2004). 10.1634/theoncologist.9-4-385 [DOI] [PubMed] [Google Scholar]
- 19.Krinsky G. A., Lee V. S., Theise N. D., Weinreb J. C., Rofsky N. M., Diflo T., and Teperman L. W., “Hepatocellular carcinoma and dysplastic nodules in patients with cirrhosis: Prospective diagnosis with MR imaging and explantation correlation,” Radiology 219(2), 445–454 (2001). 10.1148/radiology.219.2.r01ma40445 [DOI] [PubMed] [Google Scholar]
- 20.Tryggestad E., Flammang A., Han-Oh S., Hales R., Herman J., McNutt T., Roland T., Shea S. M., and Wong J., “Respiration-based sorting of dynamic MRI to derive representative 4D-MRI for radiotherapy planning,” Med. Phys. 40, 051909(12pp.) (2013). 10.1118/1.4800808 [DOI] [PubMed] [Google Scholar]
- 21.Segars W. P., Sturgeon G., Mendonca S., Grimes J., and Tsui B. M., “4D XCAT phantom for multimodality imaging research,” Med. Phys. 37, 4902–4915 (2010). 10.1118/1.3480985 [DOI] [PMC free article] [PubMed] [Google Scholar]
- 22.Panta R. K., Segars P., Yin F. F., and Cai J., “Establishing a framework to implement 4D XCAT phantom for 4D radiotherapy research,” J. Cancer Res. Ther. 8(4), 565–570 (2012). 10.4103/0973-1482.106539 [DOI] [PMC free article] [PubMed] [Google Scholar]
- 23.Beddar A. S., Kainz K., Briere T. M., Tsunashima Y., Pan T., Prado K., Mohan R., Gillin M., and Krishnan S., “Correlation between internal fiducial tumor motion and external marker motion for liver tumors imaged with 4D-CT,” Int. J. Radiat. Oncol., Biol., Phys. 67(2), 630–638 (2007). 10.1016/j.ijrobp.2006.10.007 [DOI] [PubMed] [Google Scholar]
- 24.Olsen J. R., Lu W., Hubenschmidt J. P., Nystrom M. M., Klahr P., Bradley J. D., Low D. A., and Parikh P. J., “Effect of novel amplitude/phase binning algorithm on commercial four-dimensional computed tomography quality,” Int. J. Radiat. Oncol., Biol., Phys. 70(1), 243–252 (2008). 10.1016/j.ijrobp.2007.09.013 [DOI] [PMC free article] [PubMed] [Google Scholar]
- 25.Wink N. M., Panknin C., and Solberg T. D., “Phase versus amplitude sorting of 4D-CT data,” J. Appl. Clin. Med. Phys. 7(1), 77–85 (2006). 10.1120/jacmp.2027.25373 [DOI] [PMC free article] [PubMed] [Google Scholar]
- 26.Ehrhardt J., Werner R., Frenzel T., Säring D., Lu W., Low D. A., and Handels H., “Reconstruction of 4D-CT data sets acquired during free breathing for the analysis of respiratory motion,” Proc. SPIE 6144, 614414 (2006). 10.1117/12.651730 [DOI] [Google Scholar]
- 27.Lu W., Parikh P. J., Hubenschmidt J. P., Bradley J. D., and Low D. A., “A comparison between amplitude sorting and phase-angle sorting using external respiratory measurement for 4D CT,” Med. Phys. 33, 2964–2974 (2006). 10.1118/1.2219772 [DOI] [PubMed] [Google Scholar]
- 28.Verstynen T. D. and Vibhas D., “Using pulse oximetry to account for high and low frequency physiological artifacts in the BOLD signal,” NeuroImage 55(4), 1633–1644 (2011). 10.1016/j.neuroimage.2010.11.090 [DOI] [PubMed] [Google Scholar]
- 29.Wiebking C., Duncan N. W., Tiret B., Hayes D. J., Marjaǹska M., Doyon J., Bajbouj M., and Northoff G., “GABA in the insula—A predictor of the neural response to interoceptive awareness,” NeuroImage. 86, 10–18 (2014). 10.1016/j.neuroimage.2013.04.042 [DOI] [PMC free article] [PubMed] [Google Scholar]
- 30.Liu Y., Yin F. F., Chang Z., Czito B. G., Palta M., Bashir M. R., Qin Y., and Cai J., “Investigation of sagittal image acquisition for 4D-MRI with body area as respiratory surrogate,” Med. Phys. 41(10), 101902 (13pp.) (2014). 10.1118/1.4894726 [DOI] [PMC free article] [PubMed] [Google Scholar]
- 31.Liu Y., Yin F. F., Chen N. K., Chu M. L., and Cai J., “Four dimensional magnetic resonance imaging with retrospective k-space reordering: A feasibility study,” Med. Phys. 42(2), 534–541 (2015). 10.1118/1.4905044 [DOI] [PMC free article] [PubMed] [Google Scholar]
- 32.Tryggestad E., Flammang A., Hales R., Herman J., Lee J., McNutt T., Roland T., Shea S. M., and Wong J., “4D tumor centroid tracking using orthogonal 2D dynamic MRI: Implications for radiotherapy planning,” Med. Phys. 40(9), 091712(12pp.) (2013). 10.1118/1.4818656 [DOI] [PubMed] [Google Scholar]
- 33.Cai J., Chang Z., O’Daniel J., Yoo S., Ge H., Kelsey C., and Yin F. F., “Investigation of sliced body volume (SBV) as respiratory surrogate,” J. Appl. Clin. Med. Phys. 14(1), 71–80 (2013). 10.1120/jacmp.v14i1.3987 [DOI] [PMC free article] [PubMed] [Google Scholar]
- 34.Deng Z., Pang J., Yang W., Yue Y., Sharif B., Tuli R., Li D., Fraass B., and Fan Z., “Four-dimensional MRI using three-dimensional radial sampling with respiratory self-gating to characterize temporal phase-resolved respiratory motion in the abdomen,” Magn. Reson. Med. (12pp.) (2015). 10.1002/mrm.25753 [DOI] [PMC free article] [PubMed] [Google Scholar]
- 35.Liu Y., Yin F. F., Czito B., Bashir M., Palta M., and Cai J., “TH-CD-207–9: Retrospective 4D-MRI with a novel image-based surrogate: A sagittal-coronal-diaphragm point of intersection (SCD-PoI) motion tracking method,” Proceedings of 2015 AAPM Annual Meeting. [DOI] [PMC free article] [PubMed]


