Abstract
We develop a statistical line of response (LOR) estimator of the three-dimensional interaction positions of a pair of annihilation photons in a PET detector module with depth of interaction capability. The three-dimensional points of interaction of a coincidence pair of photons within the detector module are estimated by calculation of an expectation of the points of interaction conditioned on the signals measured by the photosensors. This conditional expectation is computed from estimates of the probability density function of the light collection process and a model of the kinetics of photon interactions in the detector module. Our algorithm is capable of handling coincidences where each annihilation photon interacts any number of times within the detector module before being completely absorbed or escaping. In the case of multiple interactions, our algorithm estimates the position of the first interaction for each of the coincidence photons. This LOR estimation algorithm is developed for a high-resolution PET detector capable of providing depth-of-interaction information. Depth of interaction is measured by tailoring the light shared between two adjacent detector elements. These light-sharing crystal pairs are referred to as dMiCE and are being developed in our lab. Each detector element in the prototype system has a 2 × 2 mm2 cross section and is directly coupled to a micro-pixel avalanche photodiode (MAPD). In this set-up, the distribution of the ratio of light shared between two adjacent detector elements can be expressed as a function of the depth of interaction. Monte Carlo experiments are performed using our LOR estimation algorithm and compared with Anger logic. We show that our LOR estimation algorithm provides a significant improvement over Anger logic under a variety of parameters.
1. Introduction
Our laboratory is developing a high-resolution PET detector capable of providing depth-of-interaction information (dMiCE (Miyaoka et al 1998, Lewellen et al 2004, 2007)) by tailoring the light shared between two adjacent detector elements. Each detector element in the prototype system has a 2 × 2 mm2 cross section and is directly coupled to a micro-pixel avalanche photodiode (MAPD) developed by Zecotek Photonics (figure 1). In this set-up, the distribution of the ratio of light shared between two adjacent detector elements can be expressed as a function of the depth of interaction.
Figure 1.
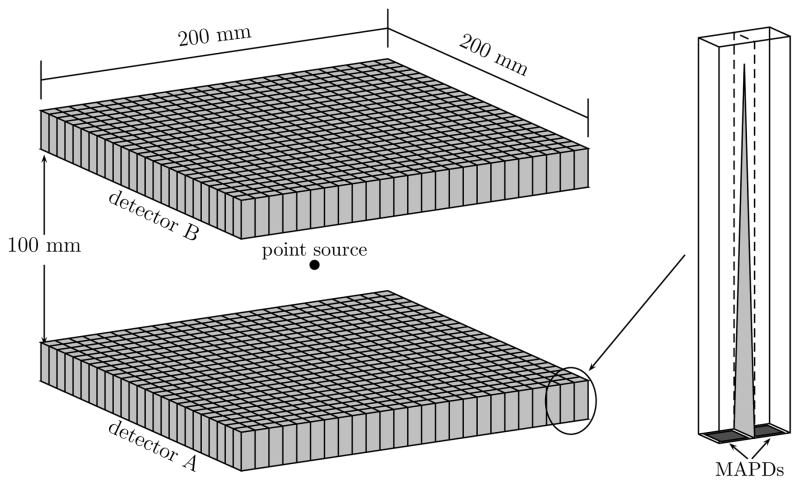
Left: simulated PET system utilized for initial testing of the DOI reconstruction algorithm. Right: diagram showing the dMiCE light-sharing crystal pair with a triangular-shaded light reflector. Individual crystals are of size 2 × 2 × 20 mm3.
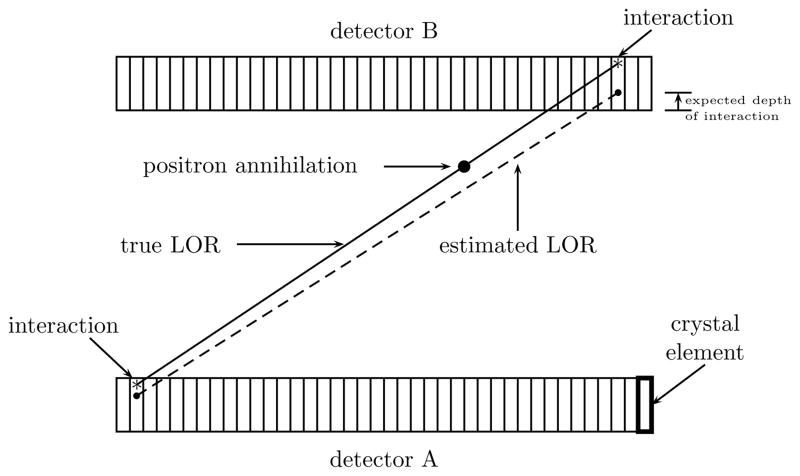
The motivation for estimating the depth of interaction (DOI) is to avoid the well-known parallax error (Wernick and Aarsvold 2004). Figure 2 provides an illustration of the parallax error. Several methods for DOI estimation have been evaluated for PET detector modules (Miyaoka et al 1998, Lewellen et al 2004, 2007, Dokhale et al 2006, Wang et al 2004, Huber et al 2001, McElroy et al 2005, Saoudi et al 1999, Inadama et al 2006, Pratx and Levin 2007, Du et al 2007, 2008, Yang et al 2009), but to our knowledge this use of a Bayesian estimator for the determination of a line of response from coincidence events is unique.
Figure 2.
Diagram showing the parallax error resulting from lack of depth of interaction information for oblique LORs. The solid line represents the true LOR and the dashed line represents the estimated LOR. The vertical lines in detector modules show optically separated detector pixels.
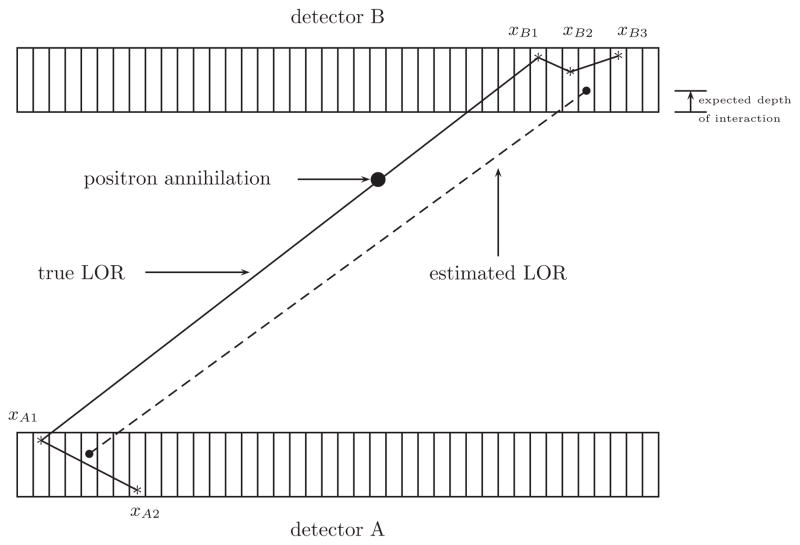
Conventional commercial PET scanners (which do not estimate the DOI) employ versions of Anger logic to position events (Cherry et al 2003, Wernick and Aarsvold 2004). Anger logic positions interactions by calculation of the energy-weighted centroid of the signals measured (figures 2 and 3). The depth of interaction is assigned a constant value for all events based on the attenuation coefficient of the detector crystal. Note that multiple interactions cause even further inaccuracies in the estimate of a line of response. Our LOR estimator sets out to overcome the loss of resolution inherent in Anger logic caused by unknown depth of interaction and multiple interactions.
Figure 3.
Anger logic can lead to gross LOR inaccuracies in the case of multiple interactions. Asterisks mark positions where the high-energy photon interacts with the scintillation crystal.
We determine a line of response (LOR) by estimating the three-dimensional interaction positions of a pair of annihilation photons in the detector module. The three-dimensional points of interaction of a coincidence pair of photons within the detector system are estimated by calculation of an expectation of the points of interaction conditioned on the signals measured by the MAPDs (this is known as Bayesian estimation). This conditional expectation is computed from estimates of the probability density functions of the light collection process and a model of the kinetics of photon interactions in the detector module. Our algorithm is capable of handling coincidences where each photon interacts any number of times within the detector module before being completely absorbed or escaping. In the case of multiple interactions, our algorithm estimates the position of the first interaction for each of the coincidence photons.
This paper is outlined as follows. In the following section we describe the methods used. Section 3 outlines the development of our Bayesian LOR estimation algorithm. Section 4 outlines some numerical experiments performed with simulated data, and we conclude with a short discussion of the results in section 5.
2. Methods
For this work we simulate a PET system (figure 1) comprised of a pair of detector modules with blocks of Lutetium Fine Silicate (LFS, Zecotek Photonics, Inc.) of size 200 × 200 × 20 mm3 with dMiCE crystals. The modules are separated by 100 mm. By using a pair of large panel detectors in close proximity we can test the effect of estimating LORs with a large oblique angle.
Basic statistics of the stochastic process of high-energy photon interactions in a detector module were explored. We simulated a beam of 511 keV photons normally incident on the center of one of the detector modules with our Monte Carlo-based INTERACT software (Ling 2007).
Let M = (Ma, Mb)T be a random variable for the signals measured by a dMiCE crystal pair, where
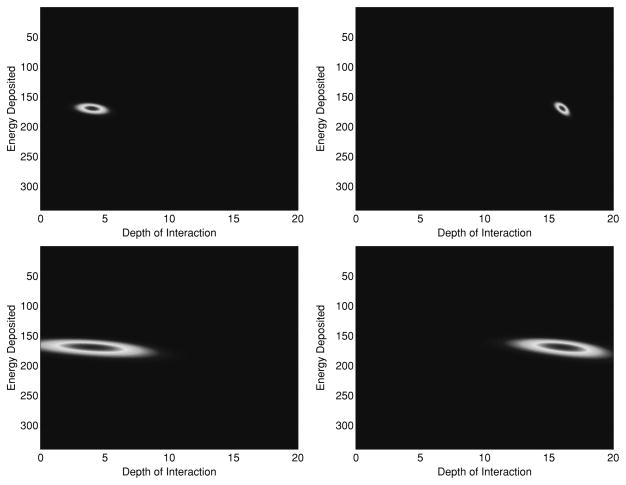
The primary detector pixel is the one in which the interaction occurred. To characterize the light response, a collimated beta source is directed at a single crystal pair. The light response is then recorded for depths varying over the entire long axis of the crystal pair. This experimental process will enable us to characterize the distribution of the signals given a certain depth (determined from the interaction position, x, and the position of the detector modules) and energy deposited (λ), i.e., we characterize the distribution of
The dMiCE crystal pairs are currently under evaluation. Based on initial testing results, we will model M|x, λ as a joint Gaussian whose mean and variance are described as follows. The mean light response is modeled to vary linearly with depth in a slope–intercept parameterization. Let rp and bp be the slope and intercept of the light response in the primary detector pixel, and rs and bs be the slope and intercept of the light response in the secondary detector pixel. Let d be the energy resolution and z be the depth of interaction which is determined from x, the position of interaction. The model is then given by
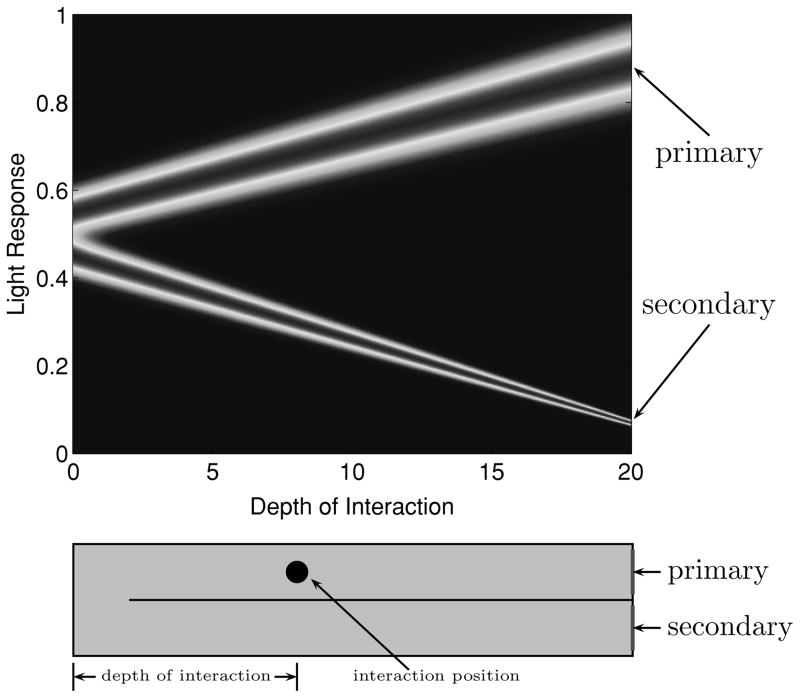
Figures 4 and 5 illustrate the characteristics of these distributions. For convenience, we let H = 20 mm denote the thickness of the detector crystal.
Figure 4.
Model for the distribution of the light response of the dMiCE crystal pair as a function of the depth of interaction. These particular plots show means given by and and 10% energy resolution (scheme I). For purposes of illustration, the plots have been normalized by λ.
Figure 5.
Plots of f(m|x, λ) for varying depth of interaction (x varies over the depth) and energy deposited (λ). Left: scheme I light response with m = (105.4, 62.9). Middle left: scheme I light response with m = (141.1, 22.1). Middle right: scheme IV light response with m = (96.9, 69.7). Right: scheme IV light response with m = (107.1, 49.3).
Four different light response schemes (table 1) were simulated and tested with Anger and Bayesian LOR estimation. Other than the depth of interaction, the detector signals do not tell us where in the crystal the interaction occurred. Thus, the Bayesian LOR estimator places estimates in the center of the plane perpendicular to the long axis of a detector pixel.
Table 1.
Parameters of the four light response schemes modeled.
| rp | bp | rs | bs | d | ||||
|---|---|---|---|---|---|---|---|---|
| Scheme I |
|
0.55 |
|
0.45 |
|
|||
| Scheme II |
|
0.55 |
|
0.45 |
|
|||
| Scheme III |
|
0.55 |
|
0.45 |
|
|||
| Scheme IV |
|
0.55 |
|
0.45 |
|
We also estimated the LORs with what we call the ideal estimator. This is a hypothetical estimator that always gives the correct order of interactions and the exact depth of interaction. Just like the Bayesian LOR estimator, the ideal estimator places the estimate in the center of the plane perpendicular to the long axis of the detector pixel. The purpose of the ideal estimator is to provide an upper limit on the performance of any LOR estimator on a PET system with dMiCE crystal pairs.
The LOR estimation algorithms were evaluated with data simulated from our test PET system (figure 1). A point source was placed halfway between the two detector panels, and one hundred thousand coincidences with an isotropic distribution (limited to the 60° acceptance angle) were simulated. Photon interactions within the detector modules were simulated with our Monte Carlo-based INTERACT software (Ling 2007). The output of this software was fed through a program that simulated the noisy detector signals. All coincidences were processed by our estimation algorithms, i.e., no LORs were filtered out due to the total amount of energy deposited in the detector module.
Our Bayesian LOR estimation algorithm estimates the first points of interaction of a photon coincidence pair by calculation of equation (6), and the signal pair order is estimated by (5). All integrals are computed using the trapezoid rule.
Performance of the various estimators was measured based on its ability to correctly position the first point of interaction and its overall effect at estimating an LOR.
The bias and variance of the estimated depth of interaction were measured by the sample mean and variance of the difference of the true and estimated depth of the first interaction. In the case of multiple interactions, our Bayesian LOR estimator not only estimates the depth of interaction, but also which interaction was first. We define the misorder rate to be the percentage of events in which the estimator incorrectly determined which interaction was first. Thus if î (a permutation) is the estimated ordering of the detector signal pairs and i is the correct ordering of the signal pairs, then the misorder rate is defined as P(î1 ≠ i1|N ≥ 2), where N is a random variable for the number of interactions within a detector module. The overall estimation error was measured by the sample mean of the difference between the true and estimated positions of the first interaction.
To illustrate the performance of each estimator in accurately estimating an LOR, we employed focal plane tomography. In focal plane tomography, the estimated LORs are backprojected onto the plane containing the point source and parallel to the face of the detector modules.
3. Statistical LOR estimation algorithm
In this section, we develop our Bayesian LOR estimation algorithm. All probability density functions (PDFs) will be denoted by f(·). We start by developing a probabilistic model of the photon process.
3.1. The photon process
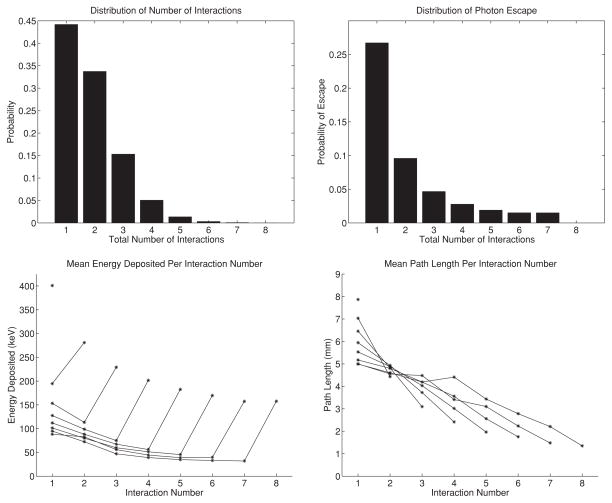
The process of photon interactions in matter is a well-developed stochastic process. For purposes of speed of computation, we use a simplified model of this process. Our model considers the energy-dependent distribution of photoelectric absorption and Compton scatter. Angular distributions of photons that undergo Compton scatter are modeled by the Klein–Nishina formula (Evans 1955). We do not consider positron range, non-colinearity of positron annihilation, photon polarization or coherent (Rayleigh) scatter. Some basic statistics of the photon process can be found in figure 6. Random variables will be denoted by capital letters, and realizations of random variables will be denoted by lower case letters.
Figure 6.
Statistics of photon interactions in a detector module. The bottom two plots show a different curve for photons that interact 1, 2, …, or 8 times in the detector module before being completely absorbed or escaping. These plots show the mean behavior, but we note that the variances are relatively large.
We start by defining the necessary random variables. Let Xk denote the three-dimensional interaction positions of an annihilation photon. For a coincidence pair, we will add subscripts to Xks (e.g. XAk, XBk) to denote the detector module where the annihilation photon interacts. Thus, XA2 denotes the position of the second interaction. Let Γk denote the energy (keV) of the photon after the kth interaction and Λk = Γk−1 − Γk denote the energy (keV) deposited by the kth interaction. The trajectory of the photon after the kth interaction will be denoted by the random variable . The random variable triplets (X0, Γ0, R0) are a special case and represent the position, energy and trajectory of the photon as it first enters the detector module.
Let μτ (γ) be the photo-electric absorption coefficient and μσ(γ) be the Compton scatter attenuation coefficient of the scintillation material. We also let the total attenuation coefficient be given by μ(γ)) = μτ (γ) + μσ (γ). The probability that a photon of energy γk−1 will have energy γk after undergoing Compton scatter is given by
This is known as the Klein–Nishina formula (Evans 1955). The angle of scatter is then given by
The term C(γk−1) is a normalizing factor such that
Note that
The probability density function of the photon process of a coincidence pair with k total interactions in detector A and l total interactions in detector B is given by
| (1) |
| (2) |
| (3) |
| (4) |
where δ(·) is the Dirac delta function. Note that
for i = 1, 2, …, k − 1 and
Similar equations exist for γ B,j and rB,0. The entrance positions xA,0 and xB,0 can be calculated from xA,1 and xB,1 and knowledge of the geometry of the scanner. We will assume that γA,0 = γ B,0 = 511.
Equations (2) and (4) account for the first k − 1 and l − 1 Compton scattering events. Equations (1) and (3) account for the final interaction which could be a photo-electric or Compton scattering event (in this case the photon escapes the detector). The exponential terms characterize the probability that a photon will travel a certain distance before going through a photo-electric absorption or Compton scattering event. If both photons of the coincidence pair interact exactly once, the above distribution reduces to
3.2. Bayes estimation of line of response
Our Bayesian LOR estimation algorithm is designed to estimate the first point of interaction of each photon in a coincidence pair. We assume that each signal pair was produced by exactly one interaction of a high-energy photon. With this assumption, the order of the interactions is equivalent to the order of the signal pairs produced.
The signal pairs generated by the sequences of high-energy photon interactions of a coincidence pair will be denoted by mA,1, …, mA,k and mB,1, …, mB,l. The numerical subscripts are arbitrary and do not imply the order of the signals. We must estimate the order of the signal pairs, since this information is unknown. Let i = (i1, i2, …, ik) be a permutation of (1, 2, …, k) and j = (j1, j2, …, jl) be a permutation of (1, 2, …, l). The order of interaction is estimated by
| (5) |
where the max is taken over all permutations of the signal pairs. The estimates of the first signal pairs for each of the coincidence photons are mî1 and mĵ1. Note that
is the probability that mA,2, mA,3, mA,1 are the first, second and third signal pairs produced in detector A, and mB,1, mB,2 are the first and second signal pairs produced in detector B. Thus, equation (5) is a type of maximum likelihood (ML) estimation because the order of the signals is implicitly assumed (i.e. in the above we implicitly conditioned on the order of the signals).
Consider an arbitrary ordering the signal pairs. For convenience, we let
We estimate the points of first interaction of a coincidence pair by Bayesian estimation which is given by
| (6) |
where
Note that
All of the above calculations can be done with knowledge of the photon process and detection process PDFs. In the above, we have implicitly assumed an ordering of the interactions. In practice, we compute (6) for all combinations of the permutations of the signals mA and mB. We then take the estimate that arose from the ordering that maximized f(mA, mB)as in equation (5).
Computing the integral (6) involves integrating the photon interaction positions over the spatial region that a particular crystal pair occupies. To speed up the computation of this integral, we restrict the integration over the regions with the largest probabilities.
With the detector geometry used here, changes in the depth of interaction of xB1 have little effect on changes of xA0 and rA0. Similarly, changes in the depth of interaction of xA1 have little effect on changes of xB0 and rB0. Thus to improve the computational complexity of the algorithm, the entrance position, xA0, and trajectory, rA0, will be computed from xA1 and the maximum likelihood estimation of xB1 and similarly xB0 and rB0 will be calculated from xB1 and the maximum likelihood estimation of xA1. This will enable us to split the photon process PDF into terms for the photon interactions in each detector module, i.e.,
where f(γAk, xA)is the product of equations (1) and (2), and f(γBl, xB) is the product of equations (3) and (4). This approximation enables us to decouple the integral (6) into a product of an integral over xA1, …, xAk, γAk and an integral over xB1, …, xBk, γBl.
4. Results
Some basic statistics of the photon process are shown in figure 6 and table 1. The mean energy deposited by a high-energy photon was 447 keV because approximately 16% of the photons escaped the detector module before depositing all of their energy. Note that the coincidences where each photon only interacts once in the detector module account for approximately 44% × 44% = 19% of the total coincidences.
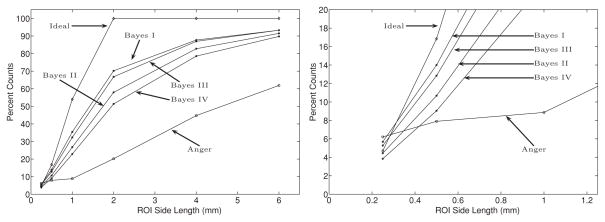
The results of the Bayesian LOR estimator with the data from schemes I, II, III, IV are denoted by Bayes I, Bayes II, Bayes III, Bayes IV, respectively. Since the results of Anger estimation did not vary with the data from the different schemes, we only show the results of Anger estimation with scheme I.
Statistics of the performance of the various estimators to correctly position the first point of interaction are shown in table 3. The misorder rates displayed in table 3 may seem high, but if one were to randomly guess which interaction was first, then the misorder rate would be approximately
Table 3.
Statistics of the estimation performance of various LOR estimation algorithms. The depth bias and variance are the sample mean and variance of the difference of the true and estimated depth of the first interaction. The mean position error is the sample mean of the (3D) euclidean norm of the difference between the true and estimated interaction positions.
| Depth bias | Depth variance | Misorder rate | Mean position error | |
|---|---|---|---|---|
| Anger | −0.15 mm | 28.00 mm2 | – | 5.40 mm |
| Bayes I | 0.16 mm | 2.42 mm2 | 23.54% | 1.62 mm |
| Bayes II | 0.16 mm | 3.94 mm2 | 24.22% | 2.01 mm |
| Bayes III | 0.15 mm | 2.66 mm2 | 23.53% | 1.70 mm |
| Bayes IV | 0.11 mm | 5.29 mm2 | 24.82% | 2.28 mm |
| Ideal | 0 mm | 0 mm2 | 0% | 0.77 mm |
In the above, we used the data from figure 6 to estimate P(N = n) and .
Focal plane tomography histograms using all the LOR estimation techniques are displayed in figure 7. We show (figure 8) the percentage of LORs that get backprojected into square-shaped regions of interest (ROI) centered at the location of the point source to quantify the focal plane tomography results. Note that figure 8 is a plot of the cumulative distribution functions (CDF) of each estimation method.
Figure 7.

Focal plane tomography results. The top row shows the 2D histograms and the bottom row shows a 1D profile of the histograms. From left to right, we have the Anger, Bayes I, Bayes IV and Ideal estimates.
Figure 8.
The percentage of LORs that get backprojected (using focal plane tomography) into square-shaped regions of interest (ROI) centered at the location of the point source. The plot on the right shows the lower left part of the left plot in detail.
Our model assumes that each signal pair was produced by exactly one high-energy photon interaction. Approximately 26% of the interaction sequences of the high-energy photons violate this assumption. Signals from two separate interactions within the same light-sharing crystal pair are summed together in our simulation. We will refer to the event where there are multiple interactions in one dMiCE crystal pair as pair-multiples.
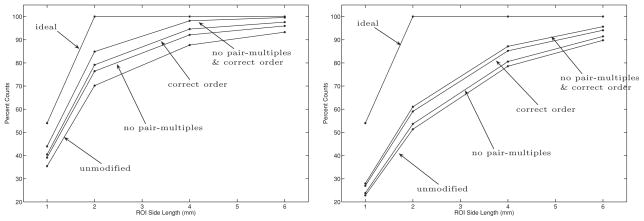
We filter out the coincidences with pair-multiples to quantify their effect on the accuracy of our algorithm. We also compute estimates of the coincidence data where we assume that the correct order of the signals is known. The results of filtering out the coincidences with pair-multiples and the estimates where the signal order is assumed to be known are shown in table 4 and figure 9. In practice, one cannot filter out the pair-multiple events or know the correct order of the signal pairs. We display these results only to help quantify the source of errors in our Bayesian LOR estimation algorithm.
Table 4.
Statistics of the estimation performance of the Bayesian LOR estimation algorithm on modified data. The data labeled no pair-multiples show the results of the coincidences without pair-multiple interactions. The data labeled correct order assume that the order of the signals is known.
| Depth bias | Depth variance | Misorder rate | Mean position error | |
|---|---|---|---|---|
| Bayes I, no pair-multiples | 0.02 mm | 0.77 mm2 | 19.62% | 1.36 mm |
| Bayes I, correct order | 0.13 mm | 2.49 mm2 | 0% | 1.29 mm |
| Bayes I, no pair-multiples and correct order | 0.02 mm | 0.87 mm2 | 0% | 1.08 mm |
| Bayes IV, no pair-multiples | −0.06 mm | 4.12 mm2 | 22.08% | 2.15 mm |
| Bayes IV, correct order | 0.04 mm | 5.40 mm2 | 0% | 1.97 mm |
| Bayes IV, no pair-multiples and correct order | −0.08 mm | 4.14 mm2 | 0% | 1.85 mm |
Figure 9.
The percentage of LORs that get backprojected (using focal plane tomography) into square-shaped regions of interest (ROI) centered at the location of the point source. The data labeled no pair-multiples show the results of the coincidences without pair-multiples interactions. The data labeled correct order assume that the order of the signals is known. The left plot shows the results with Bayes I and the right shows the results with Bayes IV.
The Bayesian LOR estimation software was written in C++ and experiments were run on a 2.3 GHz PowerPC G5 processor. One million coincidences were processed in about 4 h. No work has been done in optimizing the computational efficiency of the software.
5. Discussion and conclusion
We have developed a statistical LOR estimator for PET systems with dMiCE crystal pairs. The algorithm estimates an LOR by choosing the most likely order of interactions and then the first points of interaction for a pair of annihilation photons are calculated by Bayesian estimation. By estimating both photons of an annihilation pair simultaneously we have reduced the number of unknowns such as the trajectory and entrance position of the photons as they enter the detector modules. Initial numerical experiments illustrate the robustness of our Bayesian LOR estimation algorithm.
Although Anger estimation uses an energy-weighted centroid to position events, the estimator has a semi-discrete nature due to the pixelated detector pixels and the one-on-one readout scheme. This is the source of the peaked distribution in figure 7. One can also see two moderately large peaks to either side of the large central peak. Note that these secondary peaks appear larger on the left and right of the central peak than the peaks in front and back of it. These peaks are pronounced because the light-sharing crystal pairs blur the position of this event.
The distributions for the Anger and Bayesian focal plane tomography results are more sharply peaked than the distribution for the Ideal focal plane tomography results (figure 7). The CDF plots in figure 8 indicate that the Ideal estimate is indeed the best for ROIs of size greater than or equal to 0.5 mm, but is worse than Anger, Bayes I and Bayes III for ROIs smaller than 0.5 mm.
Our Bayesian LOR estimation algorithm was also tested with a more sophisticated PDF of the photon process which included a term that estimated the probability of photon escape in the case where the last interaction was a scattering event. The direction traveled by the photon after the last scattering event is limited to a cone whose aperture is determined by the final energy deposition in the detector. Thus, the probability of escape must be calculated by marginalizing over all the directions contained in this scattering cone. This turned out to be a significant computational burden on the estimation algorithm while providing no significant improvement in accuracy and thus was not considered in the numerical experiments described in this paper.
The model for the distributions of the light response function (the detection process) described in the results section was used in this paper to demonstrate the performance of our Bayesian LOR estimator, but it should be noted that any light response function that varies with depth of interaction could be employed. The model used in our numerical experiments is based on results of some initial testing on the distribution of the light response.
Bayesian estimation is the ideal estimation technique for an L2 cost function. A more appropriate cost function for a task such as LOR estimation would be L1 which would lead to an estimation based on a conditional median rather than a conditional expectation which is used with Bayesian estimation. Since the distributions used in our models were nearly symmetric and decayed exponentially, the difference between these two estimation methods is expected to be negligible. An L1 cost function also leads to a more computationally intensive algorithm.
A major source of error in our Bayesian LOR estimation seems to be the rate at which the order of interaction was incorrectly determined (i.e. the misorder rate). Future advancements will focus on improving this step of the estimation process and improving the computational efficiency of the code.
Table 2.
Mean of the total energy deposited for photons that interact 1, 2, …, or 8 times in the detector module before being completely absorbed or escaping.
| Total number of interactions | 1 | 2 | 3 | 4 | 5 | 6 | 7 | 8 |
| Total energy deposited (keV) | 401 | 476 | 496 | 503 | 506 | 507 | 508 | 511 |
Acknowledgments
This work is sponsored by NIH grants EB002117, EB001563, and CA74135 and Zecotek Photonics.
References
- Cherry SR, Sorenson JA, Phelps ME. Physics in Nuclear Medicine. Philadelphia, PA: Saunders; 2003. [Google Scholar]
- Dokhale P, Silverman R, Shah K, Farrell R, Mcclish M, Entine G, Cherry S. Intrinsic spatial resolution and parallax correction using depth-encoding PET detector modules based on position-sensitive APD readout. IEEE Trans Nucl Sci. 2006;53:2666–70. [Google Scholar]
- Du H, Yang Y, Cherry SR. Measurements of wavelength shifting (WLS) fibre readout for a highly multiplexed, depth-encoding PET detector. Phys Med Biol. 2007;52:2499–514. doi: 10.1088/0031-9155/52/9/011. [DOI] [PubMed] [Google Scholar]
- Du H, Yang Y, Cherry SR. Comparison of four depth-encoding PET detector modules with wavelength shifting (WLS) and optical fiber read-out. Phys Med Biol. 2008;53:1829–42. doi: 10.1088/0031-9155/53/7/002. [DOI] [PMC free article] [PubMed] [Google Scholar]
- Evans RD. The Atomic Nucleus. New York: McGraw-Hill; 1955. [Google Scholar]
- Huber J, Moses W, Andreaco M, Petterson O. An LSO scintillator array for a PET detector module with depth of interaction measurement. IEEE Trans Nucl Sci. 2001;48:684–8. [Google Scholar]
- Inadama N, Murayama H, Yamaya T, Kitamura K, Yamashita T, Kawai H, Tsuda T, Sato M, Ono Y, Hamamoto M. Preliminary evaluation of four-layer BGO DOI-detector for PET. IEEE Trans Nucl Sci. 2006;53:30–4. [Google Scholar]
- Lewellen T, Janes M, Miyaoka R. DMice—a depth-of-interaction detector design for PET scanners. IEEE Nucl Sci Symp Conf Rec. 2004;4:2388–92. doi: 10.1109/NSSMIC.2007.4436948. [DOI] [PMC free article] [PubMed] [Google Scholar]
- Lewellen T, MacDonald L, Miyaoka R, McDougald W, Champley K. New directions for dMiCE—a depth-of-interaction detector design for PET scanners. IEEE Nucl Sci Symp Conf Rec. 2007;5:3798–802. doi: 10.1109/NSSMIC.2007.4436948. [DOI] [PMC free article] [PubMed] [Google Scholar]
- Ling T. PhD Thesis. University of Washington; 2007. High resolution gamma detector for small-animal positron emission tomography. [Google Scholar]
- McElroy D, Pimpl W, Pichler B, Rafecas M, Schuler T, Ziegler S. Characterization and readout of MADPET-II detector modules: validation of a unique design concept for high resolution small animal PET. IEEE Trans Nucl Sci. 2005;52:199–204. [Google Scholar]
- Miyaoka R, Lewellen T, Yu H, McDaniel D. Design of a depth of interaction (DOI) PET detector module. IEEE Trans Nucl Sci. 1998;45:1069–73. [Google Scholar]
- Pratx G, Levin CS. Accurately positioning events in a high-resolution PET system that uses 3D CZT detectors. IEEE Nucl Sci Symp Conf Rec. 2007;4:2660–4. [Google Scholar]
- Saoudi A, Pepin C, Dion F, Bentourkia M, Lecomte R, Andreaco M, Casey M, Nutt R, Dautet H. Investigation of depth-of-interaction by pulse shape discrimination in multicrystal detectors read out by avalanche photodiodes. IEEE Trans Nucl Sci. 1999;46:462–7. [Google Scholar]
- Wang G, Huber J, Moses W, Choong W, Maltz J. Calibration of a PEM detector with depth of interaction measurement. IEEE Trans Nucl Sci. 2004;51:775–81. [Google Scholar]
- Wernick MN, Aarsvold JN. Emission Tomography. New York: Academic; 2004. [Google Scholar]
- Yang Y, Qi J, Wu Y, James SS, Farrell R, Dokhale PA, Shah KS, Cherry SR. Depth of interaction calibration for PET detectors with dual-ended readout by PSAPDs. Phys Med Biol. 2009;54:433–45. doi: 10.1088/0031-9155/54/2/017. [DOI] [PMC free article] [PubMed] [Google Scholar]


