Abstract
The mechanistic target of rapamycin (mTOR) integrates growth factor signaling, nutrient abundance, cell growth, and proliferation. On the basis of our interest in somatic growth in the late gestation fetus, we characterized the role of mTOR in the regulation of hepatic gene expression and translation initiation in fetal and adult rats. Our strategy was to manipulate mTOR signaling in vivo and then characterize the transcriptome and translating mRNA in liver tissue. In adult rats, we used the nonproliferative growth model of refeeding after a period of fasting and the proliferative model of liver regeneration following partial hepatectomy. We also studied livers from preterm fetal rats (embryonic day 19) in which fetal hepatocytes are asynchronously proliferating. All three models employed rapamycin to inhibit mTOR signaling. Analysis of the transcriptome in fasted-refed animals showed rapamycin-mediated induction of genes associated with oxidative phosphorylation. Genes associated with RNA processing were downregulated. In liver regeneration, rapamycin induced genes associated with lysosomal metabolism, steroid metabolism, and the acute phase response. In fetal animals, rapamycin inhibited expression of genes in several functional categories that were unrelated to effects in the adult animals. Translation control showed marked fetal-adult differences. In both adult models, rapamycin inhibited the translation of genes with complex 5′ untranslated regions, including those encoding ribosomal proteins. Fetal translation was resistant to the effects of rapamycin. We conclude that the mTOR pathway in liver serves distinct physiological roles in the adult and fetus, with the latter representing a condition of rapamycin resistance.
Keywords: liver, regeneration, fetus, protein synthesis, translation initiation, rapamycin
recent advances in transcriptomic and proteomic technologies have allowed the assessment of the degree to which transcription, mRNA processing and stability, and mRNA translation contribute to expression at the protein level (41). Among these processes, translation initiation has received considerable attention, in part because of the degree to which this process can be regulated at the physiological level (25). A major contributor to the regulation of translation by nutrient abundance and other environmental factors is the signaling network that has at its core the mechanistic target of rapamycin (mTOR) (33).
Recent years have also seen a growing appreciation for the complexity and diversity of mechanisms that control translation initiation (34). The conventional paradigm for the control of translation initiation involves the formation of the eukaryotic initiation factor 4F (eIF4F) complex, which recruits capped mRNAs to the ribosome (35). The mechanism for the regulation of cap-binding complex formation has been the subject of intense investigation for some 30 years (16). About 20 years ago, an alternative mechanism for translation initiation was identified, the recognition of mRNA by the ribosome at an internal ribosome entry site (IRES) (27). More recently, the mechanisms for the recruitment of mRNA to the ribosome have been recognized as involving a panoply of specialized RNA-binding proteins and a spectrum of mechanisms that can mediate 5′ cap-independent translation initiation (34).
mTOR is a serine/threonine protein kinase that serves as a nutrient and energy sensor for cells (22) with a particular role in amino acid sensing (1). It is the central component of two signaling complexes termed mTOR complex 1 (mTORC1) and mTOR complex 2 (mTORC2) (23). mTORC1, the canonical target of rapamycin and its analogs, is responsive to nutrient abundance, energy sufficiency, and growth factor signaling. It can directly phosphorylate the eIF4E binding-protein 1 (4E-BP1) (23). Phosphorylation of 4E-BP1 results in its dissociation from eIF4E, allowing the latter to associate with the scaffold for the cap-binding complex, eIF4G (9). The fully assembled cap-binding complex, eIF4F, has the binding and helicase activities required to recruit mRNA to the ribosome and initiate translation.
mTORC1 is also involved in the translation of mRNAs that have a highly complex 5′ region (18). More specifically, mTORC1 activation is associated with the translation of mRNAs with 5′ terminal oligopyrimidine tracts. The family of 5′TOP mRNAs disproportionately represents genes that encode ribosomal proteins and translation factors. Although it is well established that the relationship between mTORC1 signaling and 5′TOP translation contributes to the ability of mTORC1 to promote ribosomal biogenesis and global translation, the mechanism by which mTORC1 regulates 5′TOP translation has not been elucidated.
Our laboratory has long been interested in the nutrient regulation of somatic growth with a specific focus on late gestation and postnatal liver development in the rodent (2). Several years ago, we made the observation that late gestation fetal hepatocytes in vivo were resistant to the growth inhibitory effects of rapamycin (5). We went on to examine the hepatic translation control apparatus in the late gestation fetus (14). The results of our studies indicated resistance to the growth inhibitory effect of rapamycin at the level of G1 cell-cycle progression (13) and translation of 5′TOP mRNAs (12, 14). We have also had a long-standing interest in the regulation of hepatic gene expression by mTOR (13, 19, 21). In the present study, we have extended these observations by characterizing the effect of rapamycin on the hepatic transcriptome and translatome in the late gestation fetal rat and in the adult rat. Our results indicate a highly discordant role for mTOR during late fetal life relative to that in both nonproliferative and proliferative models of liver growth in the adult.
MATERIALS AND METHODS
Experimental design and animal studies.
The overall strategy for our studies was to manipulate the activity of mTOR signaling in vivo and then process liver tissue to generate preparations of total RNA and translating mRNA. We employed three animal models, two of which were carried out in adult rats. In the first, a nonproliferative model of liver growth (3), adult rats were fasted for 48 h, refed, and killed 3 h after refeeding. In the second model, animals underwent two-thirds partial hepatectomy (5) and were killed 24 h later. Rapamycin (250 μg per 100 g body wt) or DMSO vehicle was administered by intraperitoneal injection 15 or 60 min before the refeeding or partial hepatectomy, respectively. The third model employed fetal rats (embryonic day 19 to 20; E19–E20) that were administered rapamycin (5 μg) or DMSO vehicle by intraperitoneal injection in situ on E19 and harvested by cesarean section on E20 (5).
For all studies, Sprague-Dawley rats were obtained from Charles River Laboratories (Wilmington, MA). Adult studies used male rats weighing 125–150 g. Timed pregnant females were received on E12 and allowed to acclimate for a week before use. Unless otherwise specified, all animals were provided with standard laboratory chow and water ad libitum. For all studies, liver tissue was flash frozen in liquid nitrogen at the time of death and stored at −70°C until use. All animal studies were approved by the Rhode Island Hospital Animal Care and Use Committee.
Analytical methods.
Western immunoblotting for ribosomal protein S6 (phosphorylated and total) was carried out as previously described (5). For immunoblotting of 4E-BP1, SDS-PAGE was carried out using 18% gels. Following transfer, proteins were cross linked by incubating the PVDF with 0.05% glutaraldehyde in Tris-buffered saline with Tween 20 for 20 min. Detection used a rabbit polyclonal antibody directed against 4E-BP1 (SC-6936; Santa Cruz Biotechnology, Santa Cruz, CA).
Total RNA was isolated from frozen liver by homogenization in guanidinium thiocyanate followed by cesium chloride density centrifugation (6). RNA was further purified using the RNeasy Mini Kit (Qiagen, Valencia, CA). Translating polysomes were prepared and isolated by sucrose density centrifugation (14). RNA was extracted from pooled polysome preparations by acid-phenol:chloroform extraction followed by precipitation in ethanol plus ammonium acetate. Total RNA and RNA derived from translating polysomes were analyzed in parallel using Affymetrix Genechip Rat Gene ST 1.0 Arrays (Affymetrix, Santa Clara, CA). All microarray data are accessible through the NCBI's Gene Expression Omnibus (GEO; http://www.ncbi.nlm.nih.gov/geo/) using the accession number GSE67022.
Data and statistical analyses.
Heat maps and dendograms demonstrating hierarchical clustering were generated using GenePattern (29). Differentially expressed genes were selected with a false discovery rate (FDR) threshold of 5% (36).
Functional gene sets enriched for differentially expressed genes in microarray data sets were identified using Gene Set Enrichment Analysis (GSEA) (37). To display GSEA results, all categories with FDR Q values <0.01 were used to generate heat maps using GenePattern. Direction of change with rapamycin was incorporated into the analysis by entering positive Q values to represent increases associated with rapamycin and negative Q values to represent decreases. Gene sets not identified for a particular experimental condition were entered as 0.
We defined translation efficiency as the ratio of the translating RNA:total RNA signals for a particular gene. Assignment of gene ontology (GO) categories to translation efficiency data sets was accomplished using QIAGEN Ingenuity Pathway Analysis (IPA; Qiagen, Redwood City, CA; www.qiagen.com/ingenuity). Significance was only assigned to specific categories derived from an experimental data set if the P value for an individual category was lower than the P values for all categories obtained using five control data sets. As previously described (21), these control data sets, each of which was the same size as the corresponding experimental data set, were randomly selected from the list of genes that showed a fold change <1.1.
RESULTS
Validation of animal studies.
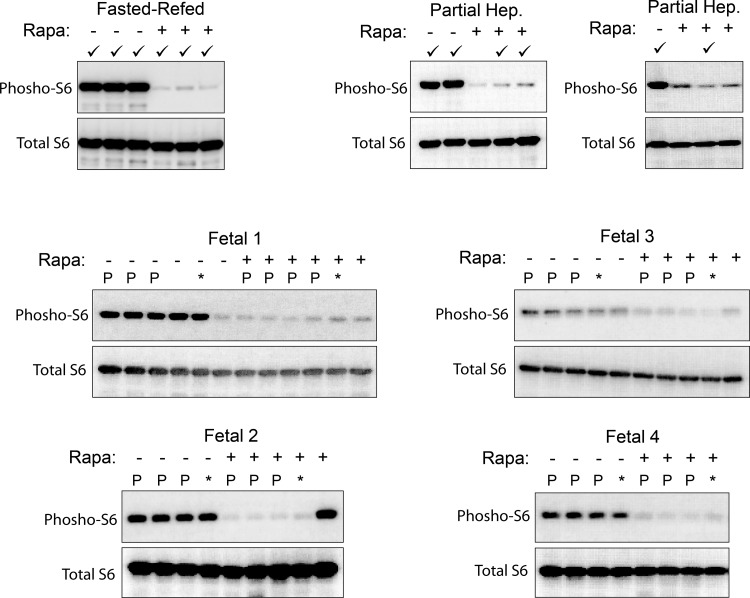
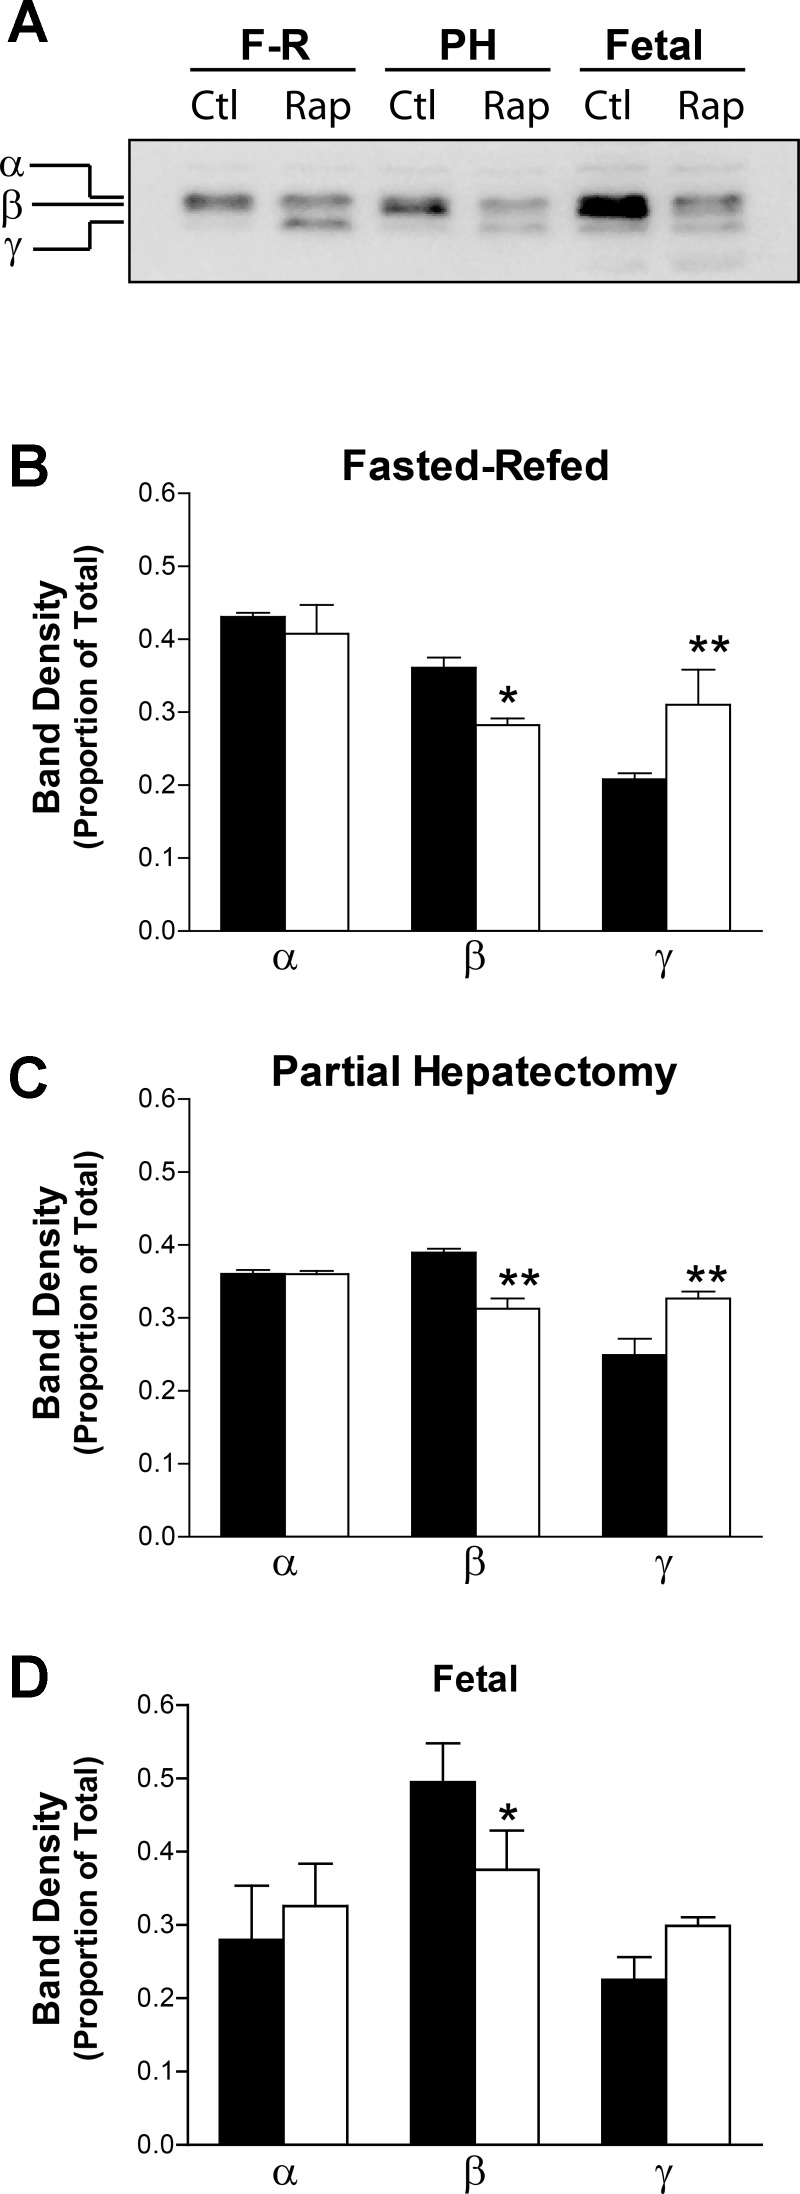
To establish the interpretability of our results, we first confirmed the efficacy of rapamycin in inhibiting mTORC1 signaling. In all three models, S6 phosphorylation was markedly, albeit incompletely, inhibited in rapamycin-administered fetuses and adult animals as demonstrated by Western immunoblotting (Fig. 1). The samples selected for further analysis were also analyzed for changes in the phosphorylation status of 4E-BP1. In all three animal models, rapamycin induced a similar reduction in the phosphorylation of the intermediate β band in a total 4E-BP1 immunoblot (Fig. 2). A reciprocal increase in the hypophosphorylated γ band was significant in the adult models. A similar increase in the mean intensity of γ did not quite reach the level of significance in the fetal samples owing to greater variance. There was no apparent effect of rapamycin on the hyperphosphorylated α band in any of the three models. These data were interpreted as a significant but small-in-magnitude effect of rapamycin on 4E-BP1 phosphorylation.
Fig. 1.
Confirmation of rapamycin (Rapa) effect. Liver samples from all study animals were analyzed by Western immunoblotting for phosphorylated ribosomal protein S6 and total S6. For the fasted-refed and partial hepatectomy results, each lane represents an individual animal. Samples used for further analysis are denoted by a checkmark. For the 4 fetal analyses, each lane represents an individual fetus, and each analysis represents a single dam. Samples that were used for polysome preparation are designated P. *Fetal samples that were used for preparation of total RNA.
Fig. 2.
Effect of rapamycin (Rap) on the phosphorylation status of eukaryotic initiation factor 4E (eIF4E) binding-protein 1 (4E-BP1). Western immunoblotting for total 4E-BP1 was carried out on the samples that were selected for microarray analysis. A: representative results for fasted-refed (F-R), partial hepatectomy (PH), and fetal samples. Labeling to the left of the immunoblot indicates the positions of the hyperphosphorylated (α), intermediate phosphorylated (β), and hypophosphorylated (γ) forms of the protein. The immunoblotting results were quantified by densitometry. The intensity of the α, β, and γ bands was determined as a proportion of the total of the 3. The bar graphs in B–D show results for the fasted-refed, partial hepatectomy, and fetal experiments, respectively. The solid bars show results for the DMSO controls, and the open bars show results for the rapamycin samples. Error bars represent 1 SD. *Significant difference from the corresponding control group based on 1-way ANOVA and a Tukey's post hoc test (*P < 0.05; **P < 0.01).
Characterization of the aggregate microarray data.
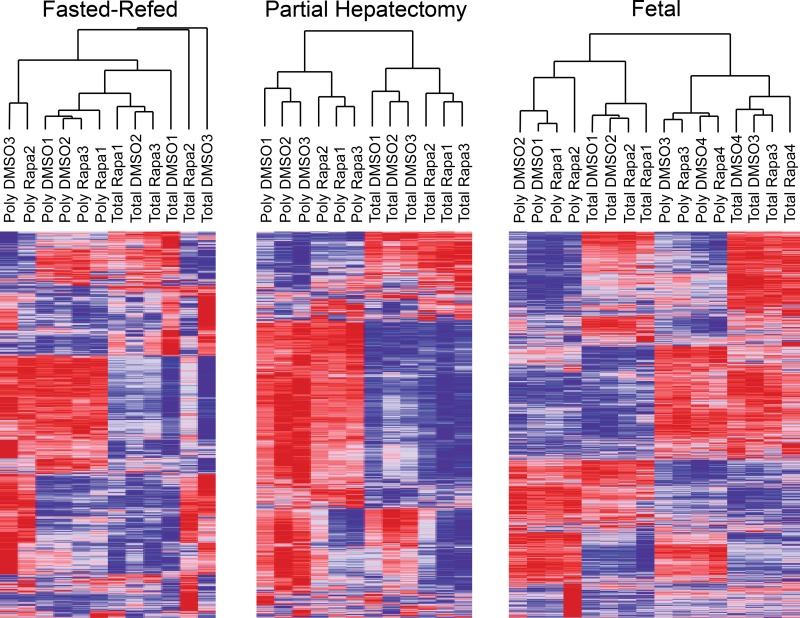
We examined the microarray results using heat maps and hierarchical clustering. To do so, we first calculated a coefficient of variation (CV) for each gene across all of the samples (total and translating RNA) in each group (fasted-refed, partial hepatectomy, and fetal). We then stratified the genes for CV. Using the 10% of the genes with the highest CV (Fig. 3), we observed qualitative differences between the three experimental groups. In the fasted-refed experiment, translating and total RNA did not cluster separately, nor did rapamycin samples segregate from the DMSO control samples for either total or translating RNA. The fetal samples showed a similar absence of clustering based on source of the RNA (total vs. polysomal) or DMSO vs. rapamycin. In contrast, the partial hepatectomy experiment showed distinct separation of polysome from total RNA samples and DMSO control from rapamycin. However, it should be noted that rapamycin administration in the latter model induces G1 cell-cycle arrest (5, 13). Thus we expected the DMSO and rapamycin samples to differ markedly based on their being derived from samples in which hepatocytes were proliferating vs. G1 arrested.
Fig. 3.
Heat maps and hierarchical clustering of all microarray results. The coefficient of variance was calculated for each gene within each experimental group. After we stratified the genes based on this metric, the 10% of genes with the greatest variance within each group were selected for inclusion in this analysis.
The effect of rapamycin on the hepatic transcriptome.
The total RNA microarray results were first analyzed to identify differentially expressed genes comparing rapamycin to DMSO control. No differentially expressed genes were identified for any of the three experimental conditions using the rigorous criterion of an FDR Q value <0.05. We therefore chose to perform further analysis of the transcriptome using GSEA. This method compares the distribution of a gene set of functional or biological significance with that of the entire set of genes on a microarray (37). In contrast to other analytical methods, it does not depend on the a priori identification of a set of significant genes to be interrogated. It is particularly effective for the identification of biologically significant changes in gene expression that are associated with relatively small effects across multiple members of a gene set.
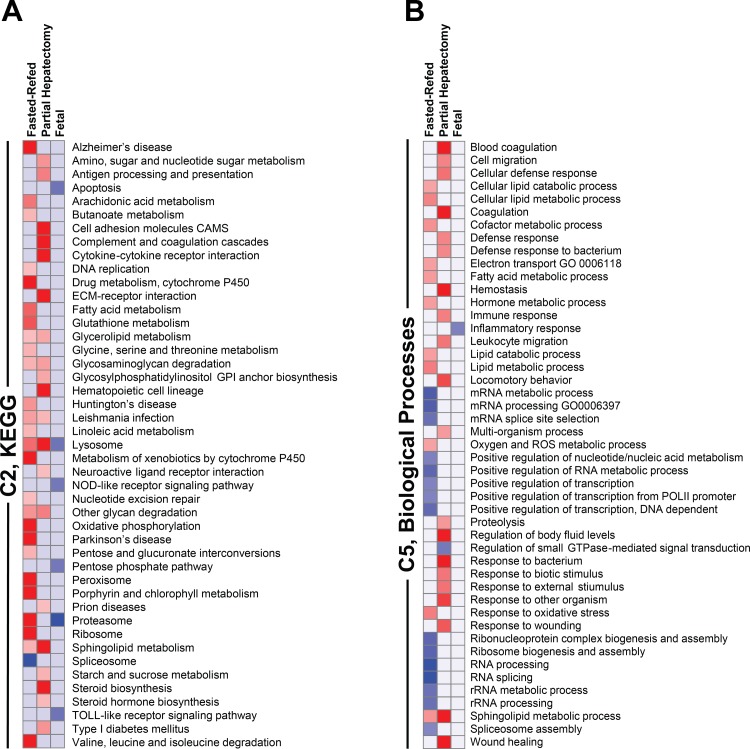
We first focused on the C2 curated gene sets in the MSigDB collection and, more specifically, the 186 gene sets in the Kyoto Encyclopedia of Genes and Genomes (KEGG) pathway database (http://www.genome.jp/kegg/pathway.html). The results of this analysis (Fig. 4A) showed a large number of gene sets that were significantly affected by rapamycin in the fasted-refed group. Only one of these, spliceosome, was downregulated. Of the 10 most significantly affected gene sets that were induced in response to rapamycin, four (oxidative phosphorylation, Parkinson's disease, Alzheimer's disease, and Val/Leu/Iso degradation) were accounted for by effects on nuclear-encoded mitochondrial genes, many of which were respiratory chain components. Also induced by rapamycin were gene sets reflecting changes in the expression of cytochrome P450 enzymes, constituents of the proteasome, and peroxisomal proteins.
Fig. 4.
Gene set enrichment analysis (GSEA) of rapamycin effect on the transcriptome in adult and fetal liver. Results are depicted as heat maps for the 3 experiments: fasting-refeeding in adult rats, partial hepatectomy in adult rats, and late-gestation fetal rats. The heat maps depict the response to rapamycin. All gene sets that were significant at Q < 0.01 are shown. Those that were enriched for upregulated genes are shown in red, and those that were enriched for downregulated genes are in blue. The intensity of the color is proportional to the degree of significance based on false discovery rate (FDR) Q value. All gene sets that were significant for any experiment are shown. Data are shown for the C2 Kyoto Encyclopedia of Genes and Genomes (KEGG) gene sets (A) and the C5 biological processes gene sets (B). ECM, extracellular matrix; NOD, nucleotide-binding oligomerization domain; GO, gene ontology; ROS, reactive oxygen species.
Rapamycin administration before partial hepatectomy produced effects that were, in part, distinct from those seen in the fasted-refed animals (Fig. 4A). The 19 gene sets induced by rapamycin at a high level of significance (Q < 0.01) included lysosome and lysosome-related gene sets (sphingolipid metabolism, glycosaminoglycan degradation, and glycerolipid metabolism) that were accounted for by enrichment of lysosomal enzymes. Also enriched were two gene sets encoding enzymes involved in steroid biosynthesis. A number of the gene sets [complement and coagulation cascades, cytokine-cytokine receptor interaction, extracellular matrix (ECM)-receptor interaction, hematopoietic cell lineage, Type 1 diabetes mellitus] reflected enrichment of genes encoding acute-phase reactants or upstream regulators of the acute-phase response. No KEGG gene sets were inhibited by rapamycin at a level of significance of Q < 0.01.
We considered the possibility that the differential effect of rapamycin in the two adult models might be accounted for by the differing durations of rapamycin effect. We analyzed additional microarray data (not shown) that we had obtained previously using fasting followed by refeeding for 24 h with or without rapamycin administration just before refeeding. GSEA (data not shown) at this longer time point revealed rapamycin-induced inhibition of KEGG pathways relating to intermediary metabolism. These effects did not coincide with either the fasting-refeeding 3-h results or the partial hepatectomy results. However, the 24-h rapamycin group showed enrichment of the KEGG ribosome gene set and the KEGG complement and coagulation cascades gene set. These effects coincided with the fasting-refeeding 3-h results and the partial hepatectomy results, respectively.
The significant (Q < 0.01) effects of rapamycin administration on KEGG pathways in the E19 fetal rats (Fig. 4A) reflected downregulation of a number of gene sets. Of note, the lysosome gene set, enriched in response to rapamycin in the partial hepatectomy experiment, was inhibited by rapamycin in the fetal experiment. In fact, all of the most highly significant effects involved gene set downregulation rather than enrichment. Again, these results did not recapitulate those seen in any of the adult experiments, fasting-refeeding (3 or 24 h) or partial hepatectomy.
The C3 motif gene sets in the MSigDB collection contain genes that share a conserved cis-regulatory motif. In the fasted-refed experiment, 52 such gene sets were downregulated by rapamycin (data not shown). Among the regulatory motifs associated with known transcription factors, in order of significance, were YY1 (Q < 0.001), HMX1 (Q < 0.001), MYC-MAX (Q = 0.005), the androgen receptor (AR, Q = 0.011), and E2F1 (Q = 0.027). No C3 gene sets were upregulated by rapamycin. In contrast to the results in the fasted-refed animals, there were no significant effects of rapamycin on C3 gene sets in the partial hepatectomy samples or in the fetal samples.
The analysis of fasted-refed animals for C5 biological process GO gene sets showed a combination of rapamycin-induced enrichment and downregulation (Fig. 4B). Of those that were downregulated, most could be accounted for by effects on RNA processing and splicing. Among the biological process GO categories potently enriched by rapamycin, most were related to lipid metabolism.
C5 biological process GO categories affected by rapamycin in the partial hepatectomy experiment (Fig. 4B) were consistent with the C2 KEGG pathway results. The majority of the categories enriched by rapamycin were related to acute-phase response (e.g., blood coagulation, hemostasis, and cellular defense) and signaling upstream from the acute-phase response. Only one GO biological process category, regulation of small GTPase-mediated signaling, was inhibited by rapamycin in the partial hepatectomy samples. There were no GO biological process categories upregulated by rapamycin in the fetal animals. However, the fetal samples showed rapamycin-associated inhibition of the inflammatory response, an effect that was consistent with the C2 KEGG results and, again, the reverse of that seen in adult animals (Fig. 4B).
Several C5 “cellular component” GO categories were significantly inhibited by rapamycin in the fasted-refed animals. Ribosomal subunit (Q < 0.001) is comprised of mitochondrial ribosomal proteins. Also inhibited was a large gene set termed mitochondrion (Q < 0.0001) that included a broad spectrum of genes encoding mitochondrial enzymes and transporter proteins. Finally, the gene set nucleolus was strongly inhibited by rapamycin (Q < 0.0001). It is composed of a large set of genes encoding intrinsic nucleolar proteins and proteins involved in nucleolar biogenesis.
The partial hepatectomy animals showed a similar rapamycin-induced inhibition of multiple C5 GO cellular component categories, all with Q values <0.001, that were accounted for by altered expression of mitochondrial ribosomal subunits. In contrast to the fasted-refed animals, the partial hepatectomy group showed rapamycin-associated enrichment of categories related to the acute-phase response, inflammatory signaling, and the lysosome. These results were consistent with results of the C2 KEGG pathway analysis.
Unlike the two adult animal experiments, the fetal data (not shown) yielded no significant C5 GO cellular component results.
The effect of rapamycin on the hepatic translatome.
To characterize the effect of rapamycin on translation, we used sucrose density centrifugation to fractionate liver homogenates. The polysome profiles (not shown) in the fetal animals showed a higher relative abundance of translating polysomes compared with the adult animals. In neither adult nor fetal experiments was rapamycin administration associated with a change in the profiles.
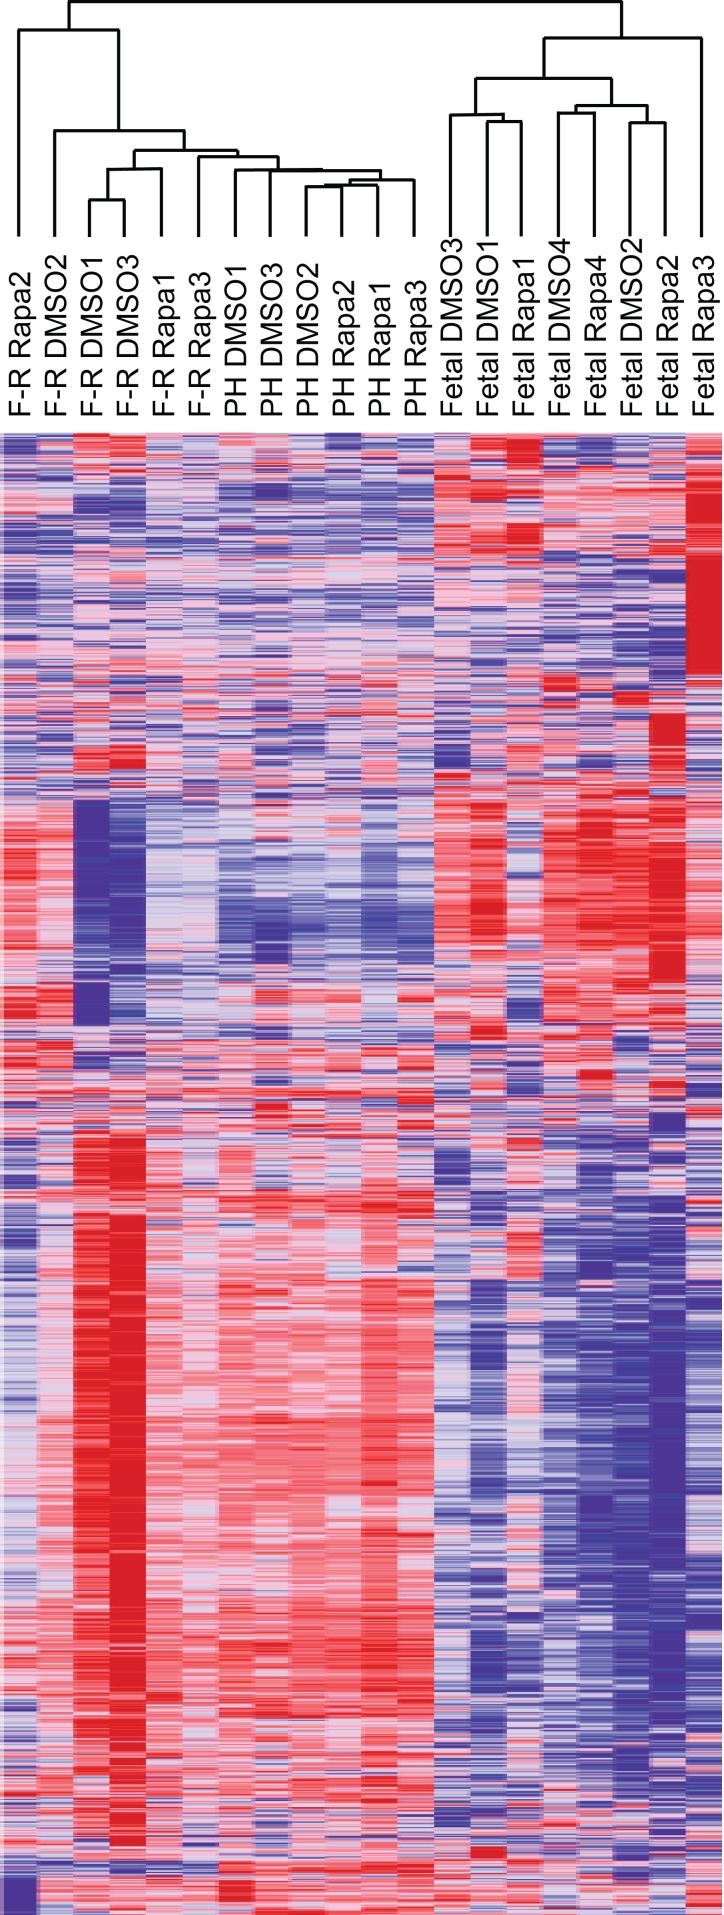
RNA extracted from translating polysomes was analyzed by microarrays that were paired with the total RNA arrays. Translation efficiencies were calculated as the ratio of the polysome RNA signal to the total RNA signal for each gene. We generated a heat map and hierarchical clustering of translation efficiencies using the 10% of all genes that had the highest CV across all samples (Fig. 5). Examination of the resulting dendograms showed that the fetal and adult experimental groups clustered separately. None of the groups showed a separation of the DMSO and rapamycin samples. We interpreted these results as indicating that any effects of rapamycin were limited to a small proportion of genes.
Fig. 5.
Heat map and hierarchical clustering of translation efficiencies. Translation efficiency was calculated for each gene as the ratio of the polysome mRNA microarray signal to the total RNA microarray signal. The coefficient of variance was calculated for each gene using data from all 20 conditions. After we stratified the genes based on this metric, the 10% of translation efficiencies that showed the greatest variance were selected for inclusion in this analysis.
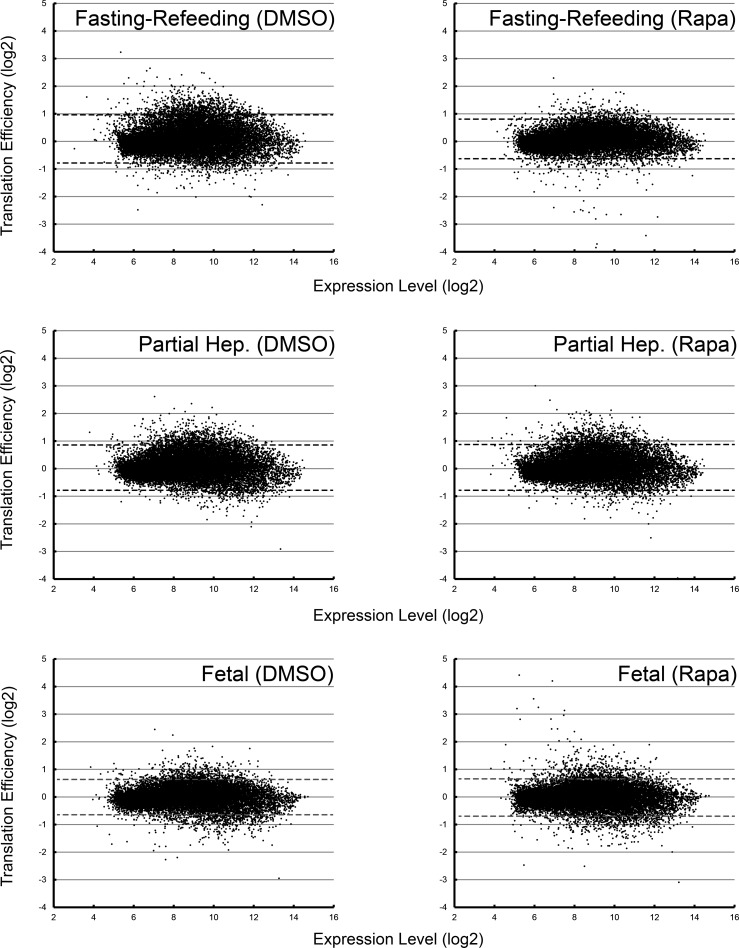
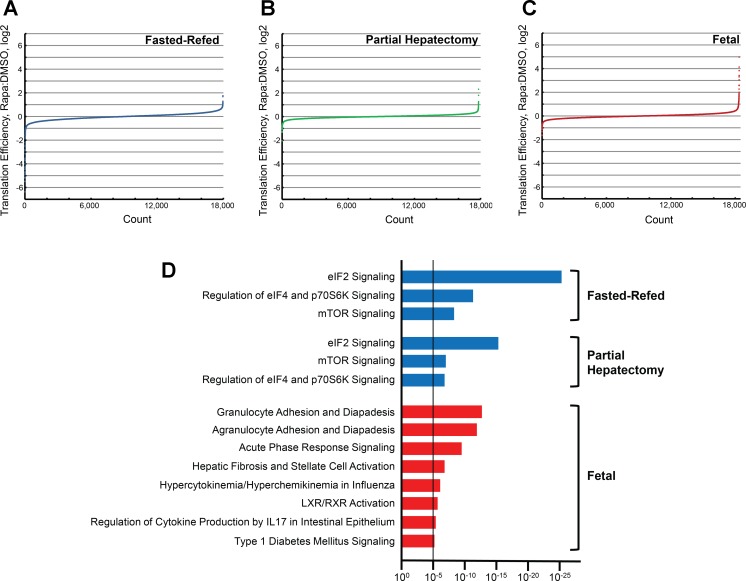
We next examined the distribution of translation efficiencies in the fasted-refed, partial hepatectomy, and fetal experiments. To most effectively visualize the effects of rapamycin, translation efficiency was stratified based on total RNA expression (Fig. 6). In the fasted-refed animals, rapamycin induced a subtle but readily apparent reduction in translation efficiency consistent with a role of mTORC1 in regulating global protein synthesis. However, this effect was not seen in the partial hepatectomy experiment or in the fetal samples. In fact, the latter showed the presence of a population of genes whose translation efficiency was increased with rapamycin administration (Fig. 7, A–C). There were 53 such genes that showed an increase in translation efficiency with rapamycin in the fetal experiment that was twofold or greater. For the fasted-refed and partial hepatectomy experiments, the numbers of genes that showed a twofold or greater increase in translation efficiency with rapamycin were 15 and 7, respectively.
Fig. 6.
Distribution of translation efficiencies stratified by expression level. Data are shown for all 6 experimental conditions. The dashed lines represent the mean ± 2 SDs for each data set.
Fig. 7.
Ingenuity Pathway Analysis (IPA) of translation efficiency. The input data for IPA was generated by selecting genes whose translation efficiency was most affected by rapamycin. Translation efficiency data from all 3 experiments were stratified for rapamycin effect (ratio of rapamycin:DMSO for the mean translation efficiency for each gene) and graphed from lowest to highest. Results are shown separately for the 3 experiments: fasted-refeeding (A), partial hepatectomy (B), and fetal (C). IPA was performed based on this stratification of rapamycin effect (D). Genes beyond 2 SDs from the mean for which rapamycin reduced translation efficiency (blue bars) or increased translation efficiency (red bars) were selected for analysis, as were 5 randomly selected control groups (rapamycin effect <1 SD from the mean). Results are shown for all canonical pathway categories that were significant based on a P value that was smaller than the lowest P value obtained for the control data sets (dashed line). mTOR, mechanistic target of rapamycin; LXR, liver X receptor; retinoid X receptor.
A cursory examination of the 53 genes that showed a rapamycin-induced increase in translation efficiency showed a predominance of chemokine ligands and acute-phase reactants. We considered it important to rigorously characterize the population of genes that were at the extremes of translational activation or inhibition in response to rapamycin in all groups. To do so, we utilized IPA. The input for the analysis consisted of genes that were beyond two standard deviations from the mean for each group (Supplemental Table S1; supplemental material for this article is available online at the American Journal of Physiology Regulatory, Integrative, and Comparative Physiology website). Results were only considered significant if the P value was smaller than any of those obtained using five comparably sized control input data sets (see materials and methods). For all three experiments, this threshold was at P = 10−5. The analysis (Fig. 7D) yielded similar results for the fasted-refed and partial hepatectomy experiments. Rapamycin was associated with reductions in three canonical pathway categories, all of which were accounted for by reduced translation efficiency of ribosomal proteins (Supplemental Table S2). Rapamycin effect on translation efficiency did not involve enrichment of any IPA canonical pathways.
The converse was the case in the fetal animals. No canonical pathways showed a significant reduction in translation efficiency in response to rapamycin. However, eight canonical pathways were significantly increased. These pathways were accounted for largely by the enhanced translation of genes associated with acute-phase response (Supplemental Table S2).
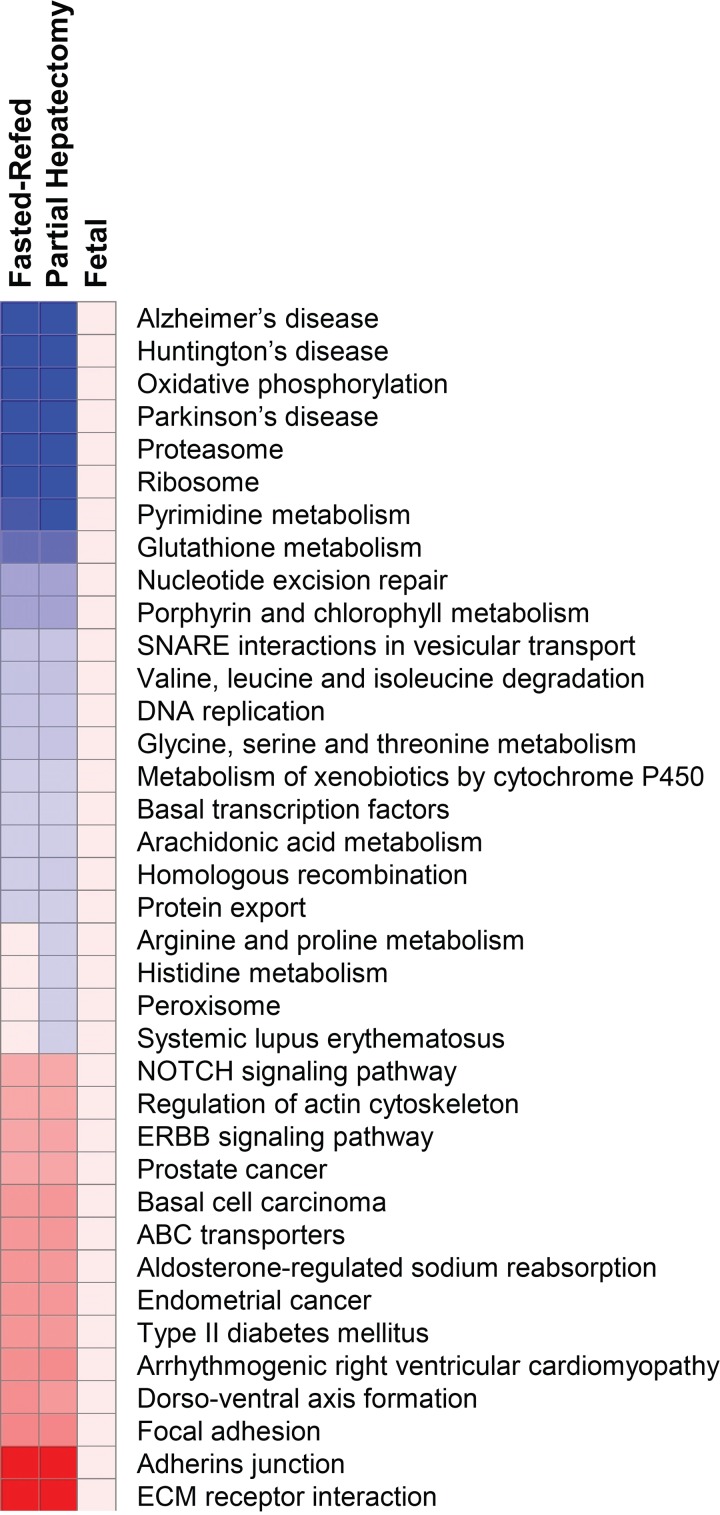
We analyzed the full spectrum of rapamycin effect in the three experiments by performing GSEA of the translation efficiency data using the C2 KEGG database. The results (Fig. 8) were striking in their contrast to the transcriptome analyses. Rapamycin effect was nearly identical in the fasted-refed and partial hepatectomy animals. The gene sets showing the most significant inhibition of translation efficiency were those related to mitochondrial metabolism as well as the proteasome, ribosome, and pyrimidine metabolism gene sets. Two gene sets, adherens junction and ECM-receptor interaction, showed highly significant increases in translation efficiency. In contrast, there were no significant C2 KEGG gene sets whose translation efficiency was significantly enhanced or inhibited by rapamycin administration in the fetal animals.
Fig. 8.
GSEA of translation efficiency. Translation efficiency data for all 3 experiments was analyzed by GSEA (C2 KEGG) and depicted as a heat map. All gene sets that were significant for any experiment are shown. The heat map depicts the response to rapamycin. Gene sets that were enriched for upregulated genes are shown in red, and those that were enriched for downregulated genes are in blue. The intensity of the color is proportional to the degree of significance based on FDR Q value.
The effect of rapamycin on specific gene sets representing functionally and structurally distinct mRNA populations.
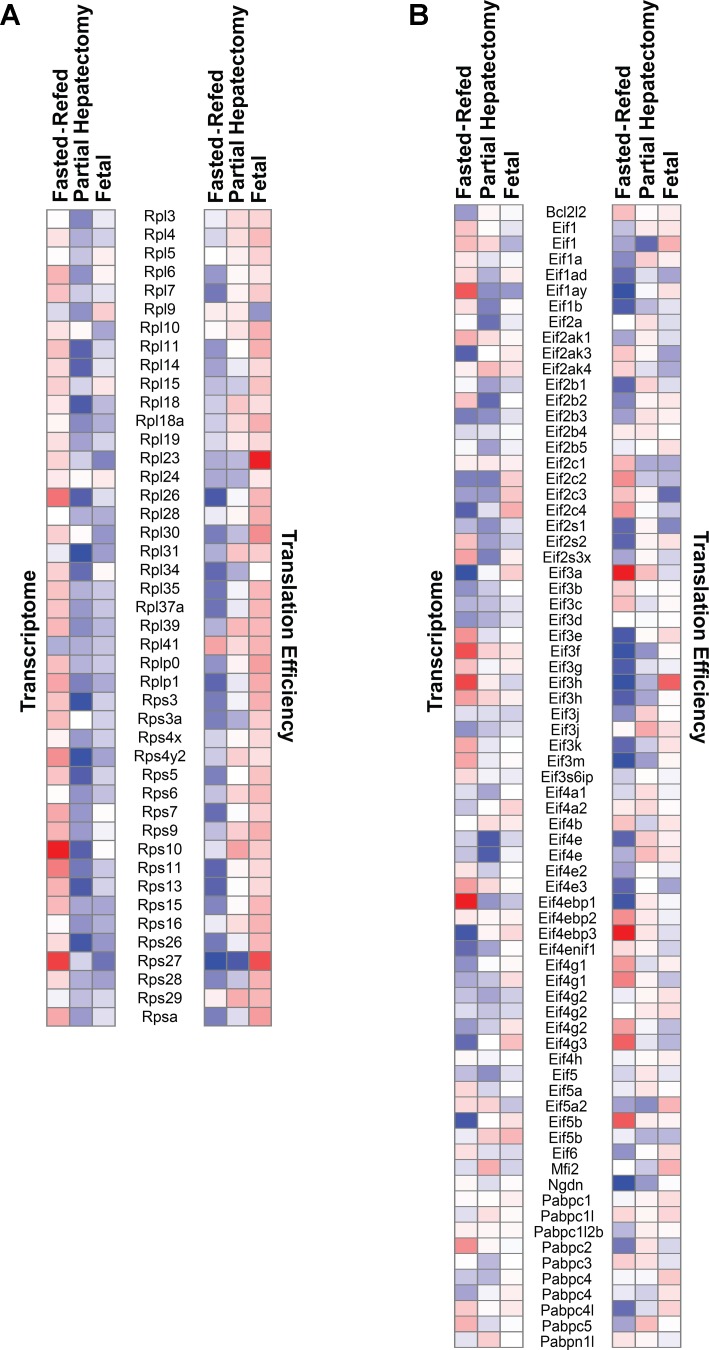
We performed separate analyses to examine the effect of rapamycin in all three experiments on the mRNA expression and translation efficiency of ribosomal proteins and translation-initiation factors. For the former, pseudogenes were excluded. For the latter gene set, we included all of the proteins identified as eIFs as well as proteins that have well-characterized roles in translation initiation.
Ribosomal proteins (Fig. 9A) showed relatively consistent rapamycin effects within experimental groups. In the fasting-refeeding experiment, the expression level of the ribosomal protein genes was generally increased by rapamycin. The converse was the case in the partial hepatectomy and fetal animals. In contrast, the translation efficiency of ribosomal protein mRNAs showed consistent inhibition in the fasting-refeeding model. Effects for the partial hepatectomy experiment were less consistent. Most striking was a nearly uniform rapamycin-induced increase in the translation efficiency of ribosomal protein mRNAs in the fetal animals.
Fig. 9.
Effect of rapamycin on the transcription and translation efficiency of ribosomal proteins and translation initiation factors. The heat maps depict the response to rapamycin for ribosomal proteins (A) and translation initiation factors (B). Genes that were upregulated are shown in red, and those that were downregulated are in blue. The intensity of the color is proportional to the magnitude of the rapamycin effect.
The effect of rapamycin on translation-initiation factor genes (Fig. 9B) was more complex and variable than was the case for ribosomal protein genes. In the fasted-refed group, rapamycin both induced and inhibited steady-state mRNA levels. The effect of rapamycin on the translation efficiency of the translation-initiation factors was also variable. In many cases, there was an apparent inverse relationship between expression levels and translation efficiency although some of the most marked effects on translation appeared to be independent of any change in steady-state mRNA level. There was, in general, a less potent and consistent effect of rapamycin on translation efficiency in the partial hepatectomy and fetal groups relative to the fasted-refed animals.
We further analyzed our data using GSEA to assess rapamycin effects on gene sets previously shown to be rapamycin sensitive or resistant by Thoreen et al. (39). These authors determined the effect of mTOR inhibition on translation efficiency and, in doing so, developed a model that accounts for the ability of mTORC1 to modulate the translation of specific mRNAs. Our analysis of our data vs. the gene sets generated by these authors showed a spectrum of rapamycin effects (Table 1). Consistent with the analyses described above, the rapamycin-treated fasted-refed animals showed enrichment of ribosomal protein mRNAs in the total mRNA preparation. Polysome RNA and translation efficiency were enriched in the DMSO group relative to the rapamycin group. Parallel results were seen for known 5′TOP mRNAs and mitochondrial ribosomal protein mRNAs. The translation efficiency of a broader set of previously unknown 5′TOP mRNAs plus 5′TOP-like mRNAs was also sensitive to rapamycin. In the partial hepatectomy animals, translation efficiency of the known 5′TOP mRNAs and ribosomal protein mRNAs was also rapamycin sensitive. In contrast, the only gene set for which translation efficiency in the fetal animals was rapamycin sensitive was that containing mRNAs whose translation is thought to be dependent on an IRES.
Table 1.
Effect of rapamycin on specific gene sets representing functionally and structurally distinct mRNA populations
| 5′TOP mRNAs; Previously Unknown 5′TOP and TOP-Like mRNAs | Known 5′TOP mRNAs | Ribosomal Protein mRNAs | Mitochondrial Ribosomal Protein mRNAs | IRES-Dependent mRNAs | Histone mRNAs | |
|---|---|---|---|---|---|---|
| Fasted-Refed | ||||||
| Total RNA | ||||||
| DMSO | — | — | — | — | 0.205 | — |
| Rapa | 0.056 | <0.001 | <0.001 | <0.001 | — | <0.001 |
| Polysome RNA | ||||||
| DMSO | 0.528 | <0.001 | <0.001 | <0.001 | 0.183 | — |
| Rapa | — | — | — | — | — | 0.001 |
| Translation efficiency | ||||||
| DMSO | 0.021 | <0.001 | <0.001 | <0.001 | — | 0.033 |
| Rapa | — | — | — | — | 0.548 | — |
| Partial hepatectomy | ||||||
| Total RNA | ||||||
| DMSO | 0.003 | 0.001 | 0.002 | <0.001 | 0.585 | <0.001 |
| Rapa | — | — | — | — | — | — |
| Polysome RNA | ||||||
| DMSO | 0.065 | <0.001 | <0.001 | <0.001 | 0.580 | <0.001 |
| Rapa | — | — | — | — | — | — |
| Translation efficiency | ||||||
| DMSO | — | <0.001 | <0.001 | — | 0.855 | — |
| Rapa | 0.127 | — | — | 0.067 | — | 0.007 |
| Fetal | ||||||
| Total RNA | ||||||
| DMSO | 1.000 | 1.000 | 1.000 | 0.035 | 0.960 | 1.000 |
| Rapa | — | — | — | — | — | — |
| Polysome RNA | ||||||
| DMSO | — | — | — | 0.087 | — | — |
| Rapa | 0.854 | 0.264 | 0.516 | — | 0.157 | 0.195 |
| Translation efficiency | ||||||
| DMSO | — | — | — | — | — | — |
| Rapa | 0.851 | 0.744 | 0.678 | 0.931 | 0.040 | 1.000 |
The current data sets were analyzed in Gene Set Enrichment Analysis using the gene sets generated by Thoreen et al. (39). Effects of rapamycin on total RNA, polysome RNA, and translation efficiency were examined for all 3 animal experiments. False discovery rate Q values are provided for all DMSO or rapamycin (Rapa) samples that showed relative enrichment vs. the gene sets identified at the top of the table. Cells in boldface font are those for which enrichment reached statistical significance. IRES, internal ribosome entry site.
DISCUSSION
Our previous studies on the regulation of liver growth in the late-gestation fetus provide a context for the present series of experiments. A number of years ago, we made the observation that fetal hepatocytes in vivo were resistant to the growth inhibitory effects of rapamycin despite the ability of the drug to potently inhibit mTORC1 signaling (5, 32). Further studies indicated that rapamycin induced hepatocyte cell-cycle arrest at the level of cyclin E-dependent kinase activity in rats that underwent partial hepatectomy and that fetal hepatocytes in vivo were resistant to this effect (13). We went on to show that the translation of 5′TOP mRNAs was similarly sensitive to rapamycin in adult rats that underwent partial hepatectomy but resistant in the late-gestation fetus (14). The goal of the present studies was to extend these observations to the effects of rapamycin on the full spectrum of mRNA translation. To do so required that we also characterize the effects of rapamycin on the transcriptome.
Our choice of models in the adult was based on the fact that E19–E20 in the fetal rat is a time when there is a high rate of asynchronous hepatocyte proliferation (11). The selection of the fasting-refeeding model in the adult was based on our prior data showing that a brief period of refeeding was associated with potent activation of mTORC1 signaling and mTORC1-dependent activation of translation (3). We deliberately selected this as a model of nonproliferative liver growth to control for the effects of cell-cycle activation in the partial hepatectomy model (3). The use of this model and a short time point were aimed at achieving conditions of maximal and maximally inhibited mTORC1. The liver regeneration model was chosen based on the ability of a single injection of rapamycin before partial hepatectomy to induce sustained mTORC1 inhibition under conditions of induced hepatocyte proliferation (5), thus providing a control for the sustained inhibition of TORC1 that we achieved with in situ fetal injections 24 h before cesarean delivery. Using flow cytometry, we have shown previously that about 60% of E19 fetal rat hepatocytes in vivo are in the G1 phase of the cell cycle and about one-third are in S phase (4, 12). We have also shown that hepatocytes at the 24-h time point following partial hepatectomy are similar with regard to the proportion in S phase (5). Given the analogous cell-cycle status and sustained mTORC1 inhibition in the two models, we reasoned that a comparison of the effects of rapamycin on translation would be informative. We also reasoned that 24 h would be a sufficient amount of time for fetuses to recover from the effects of the initial cesarean section.
Rapamycin-induced changes in the transcriptome differed between the fasted-refed and partial hepatectomy groups. We considered the possibility that this lack of concordance might be accounted for by the two different durations of rapamycin exposure. However, this possibility was not supported by an examination of the additional fasted-refed group that was exposed to rapamycin for 24 h. We are left attributing these differences to the fundamental differences between the three groups, namely perturbation of the acute response to fasting in the 3-h fasted-refed group, prolonged inhibition of the recovery of liver mass in the 24-h fasted-refed group, and tonic inhibition of cell-cycle progression in the partial hepatectomy group. These results do not mitigate the observation that the predominant effect on KEGG gene sets in the adult animals that received rapamycin was enrichment, whereas, in contrast, effects in the fetus were modest, and those beyond borderline significance were inhibitory. The GSEA C5 analysis for biological processes also showed, in general, enrichment of gene sets in the adult animals that received rapamycin. The gene sets that showed inhibition in the adult fasted-refed animals fell into two categories, RNA processing and regulators of several processes related to nucleic acid metabolism and transcription. These results were consistent with the C2 KEGG spliceosome inhibitory effect. Again, there were minimal effects of rapamycin on C5 biological processes in the fetus save the inhibitory effect on the inflammatory response gene set.
The GSEA C3 analysis of the fasted-refeeding experiment showed significant inhibition of genes with a YY1 regulatory motif. This effect, consistent with previously published data on transcriptional regulation by mTOR (24), was accounted for by reduced expression of genes associated with the spliceosome. However, mitochondrial genes, known YY1 targets, were enriched in response to rapamycin. In fact, the C3 motif gene set analysis showed downregulation of numerous gene sets, most consistent with reduced activity of an array of well-characterized transcription factors. This result was inconsistent with the C2 and C5 results.
These findings are in keeping with our previous studies on a panel of hepatic cell lines in which we showed that effects of rapamycin on gene expression disproportionately affected genes whose promoter regions contained E-boxes (19). Although this indicated the possibility of a transcriptional control mechanism involving c-Myc, we went on to show that the rapamycin-induced effects were independent of c-Myc. Although there is a body of data showing mTOR regulation of gene expression through specific transcription factors (24), our present and previous studies indicate regulatory mechanisms that are broad with regard to the range of genes affected and subtle in the degree to which expression is altered. This raises the possibility that mTORC1 exerts its effects on gene expression through epigenetic effects. DNA methylation and the posttranslational modification of histones are candidate mechanisms.
Like the regulation of transcription by mTORC1, control of translation occurs through both well-characterized signaling pathways and regulatory mechanisms that have been difficult to elucidate. The direct regulation of eIF4E through phosphorylation of eIF4E-binding proteins is an established mechanism by which mTOR regulates 5′cap-dependent translation (30). In contrast, the mechanism by which mTORC1 regulates the translation of 5′TOP mRNAs has been a source of controversy. Our own studies on fetal liver (5, 14) dissociated 5′TOP translation from phosphorylation of ribosomal protein S6 and other downstream targets of mTORC1.
Recent studies have indicated that the phosphorylation state of the eIF4E regulator, 4E-BP1, may be key to regulating 5′TOP translation (7, 39). Rapamycin, although effective in inhibiting the S6 kinase arm of the mTORC1 signaling pathway, is relatively ineffective in its ability to induce 5′ cap binding through steric hindrance of 4E-BP1 phosphorylation (7, 26). One explanation for the discordant effects of rapamycin on fetal translation is a difference in the effect of the drug on 4E-BP1. Ruling this out in a complex physiological system is beyond the scope of the present studies. However, our data are not supportive of the hypothesis that differential effects on 4E-BP1 account for the differential effects of rapamycin on translation. Moreover, it has become apparent in recent years that there is great diversity in the 5′ structure of mRNAs and in the translation-initiation mechanisms that mediate their recruitment to the ribosome (34). These observations are of relevance to the present studies given our central observation that mTORC1 signaling, although active in late gestation fetal liver (5, 12, 14), does not modulate translation of a spectrum of mRNAs in a manner similar to its actions in adult liver.
The recent studies by Thoreen et al. (39) may be relevant to the fetal-adult differences we observed. These authors studied the mechanism by which mTORC1 regulates translation. They used mouse embryonic fibroblasts for their studies, and they utilized the mTOR kinase inhibitor torin 1 to block mTOR signaling. Among their findings, they showed that RNAi-mediated depletion of eIF4G1 selectively suppressed the translation of 5′TOP mRNAs without affecting mTORC1 activity. We hypothesize that the fetal-adult differences in mTORC1-mediated regulation of 5′TOP translation that we have observed may be a function of the composition of translation-initiation complexes. eIF4G, a large scaffolding protein, interacts with eiF4E, eIF3, eIF4A, and poly(A)-binding protein (34). Mammalian eIF4G can also interact directly with mRNA via at least two sites on the protein (28). The protein complex that forms with eIF4G at its core provides for all of the functions required for translation-initiation binding of mRNA, interaction with the 40S subunit, helicase activity, and pseudocircularization of the mRNA.
Given the diversity of translation-initiation mechanisms, it may not be surprising that there is exceptionally broad diversity in the structure of eIF4G, which is more correctly referred to as the eIF4G family (34). Multiple isoforms, some resulting from alternative splicing, alternative promoters, or varying start sites, are present in mammalian cells. Also present in mammalian cells are proteins that share sequence homology with selected domains in eIF4G. Different members of the eIF4G family vary in their ability to bind other translation-initiation components, indicating that this key protein can mediate the translation of mRNAs that differ greatly in their requirement for specific initiation factors (28, 34). In addition, virus proteases and mammalian caspases can mediate posttranslational proteolytic processing of eIF4G, resulting in modulation of the translation of specific mRNAs (28).
The spectrum of proteins that associate with the mRNA 5′ cap has broadened as the diversity of translation-initiation mechanisms has become better appreciated (34). Most recently, Tcherkezian et al. (38) performed a proteomic analysis of cap-binding complexes. They identified ∼160 proteins in m7GTP affinity-purified preparations. Of these, about a third dissociated from the m7GTP beads upon nuclease treatment, indicating the interaction of these proteins with mRNA.
In the face of this level of complexity, one of our prior observations takes on particular importance. Using Western immunoblotting of m7GTP affinity-purified preparations, we compared the forms of eIF4G present in late-gestation fetal and adult rat liver (14). Results showed the presence of multiple forms of eIF4G1 that were present in high abundance in fetal liver but absent in adult liver. Western immunoblotting of the 40S complex also showed marked differences between the two. We similarly showed a difference in eIF4A isoforms with eIF4A1 present in fetal liver and eIF4A2 in adult. This was consistent with a prior report showing that the expression of eIF4A isoforms is linked to cellular growth status (42). On the basis of these observations, we hypothesize that marked differences in the composition of translation-initiation complexes and, in particular, the forms of eIF4G in fetal vs. adult liver may account for profound differences in the physiological regulation of translation initiation.
In conclusion, on the basis of our previous observations on the apparent resistance of late gestation fetal hepatocytes to the antigrowth and antiproliferative effects of rapamycin in the rat, we set out to more carefully characterize the effects of rapamycin on translation in fetal and adult liver. Doing so required that we obtain data on the effects of rapamycin on the transcriptome. Results indicated marked differences in the response to the drug across our two adult and our fetal models of in vivo rapamycin effect. However, the effects on the translatome showed remarkable consistency between the two adult models despite their substantial underlying differences, namely nonproliferative vs. proliferative liver growth and different durations of rapamycin exposure. Fetal liver was indeed resistant to the inhibitory effects of rapamycin on a defined subset of RNA species with complex 5′ untranslated regions. Aside from our observations on late-gestation liver development, observations on rapamycin resistance have been confined to cancer pathophysiology (13). Determination of the mechanisms accounting for the physiological changes in mTORC1 regulation of gene expression and translation during the fetal-to-adult transition may be important to understanding the dysregulation of translation and cell proliferation that occurs in hepatocellular carcinoma (31) and other forms of cancer (40). Our findings illustrate the degree to which a common signaling mechanism can diverge in its downstream effects depending on the physiological context. Given the relationship between rapamycin resistance (13, 17, 20) and the dysregulation of mTOR signaling in cancer (8, 10, 15, 23), elucidation of new regulatory mechanisms for mTOR-mediated regulation of gene expression and mRNA translation across the developmental spectrum offers the potential for new therapeutic modalities for cancer and other growth disorders.
GRANTS
This work was supported by NIH grants R01HD24455 (to P. Gruppuso and J. Sanders) and R01DK100301 (to J. Sanders and P. Gruppuso) and by P30GM103410 provided through the Genomics Core Facility of Brown University Center for Genomics and Proteomics.
DISCLOSURES
No conflicts of interest, financial or otherwise, are declared by the authors.
AUTHOR CONTRIBUTIONS
Author contributions: J.M.B., J.A.S., and P.A.G. conception and design of research; J.M.B. and J.A.S. performed experiments; J.M.B., N.N., and P.A.G. analyzed data; J.M.B., J.A.S., N.N., and P.A.G. interpreted results of experiments; J.M.B. and P.A.G. drafted manuscript; J.M.B., J.A.S., and N.N. edited and revised manuscript; J.M.B., J.A.S., N.N., and P.A.G. approved final version of manuscript; P.A.G. prepared figures.
ACKNOWLEDGMENTS
We thank Heather Francois-Vaughan for invaluable contribution to the animal studies. We also thank Dr. Christoph Schorl of Brown University Genomics Core Facility for advice and for performance of the microarray analyses.
REFERENCES
- 1.Abraham RT. Making sense of amino acid sensing. Science 347: 128–129, 2014. [DOI] [PubMed] [Google Scholar]
- 2.Anand P, Boylan JM, Ou Y, Gruppuso PA. Insulin signaling during perinatal liver development in the rat. Am J Physiol Endocrinol Metab 283: E844–E852, 2002. [DOI] [PubMed] [Google Scholar]
- 3.Anand P, Gruppuso PA. Rapamycin inhibits liver growth during refeeding in rats via control of ribosomal protein translation but not cap-dependent translation initiation. J Nutr 136: 27–33, 2006. [DOI] [PMC free article] [PubMed] [Google Scholar]
- 4.Awad MM, Gruppuso PA. Cell cycle control during liver development in the rat: evidence indicating a role for cyclin D1 posttranscriptional regulation. Cell Growth Differ 11: 325–334, 2000. [PubMed] [Google Scholar]
- 5.Boylan JM, Anand P, Gruppuso PA. Ribosomal protein S6 phosphorylation and function during late gestation liver development in the rat. J Biol Chem 276: 44457–44463, 2001. [DOI] [PubMed] [Google Scholar]
- 6.Braun L, Gruppuso P, Mikumo R, Fausto N. Transforming growth factor beta 1 in liver carcinogenesis: messenger RNA expression and growth effects. Cell Growth Differ 1: 103–111, 1990. [PubMed] [Google Scholar]
- 7.Choo AY, Yoon SO, Kim SG, Roux PP, Blenis J. Rapamycin differentially inhibits S6Ks and 4E-BP1 to mediate cell-type-specific repression of mRNA translation. Proc Natl Acad Sci USA 105: 17414–17419, 2008. [DOI] [PMC free article] [PubMed] [Google Scholar]
- 8.Cornu M, Albert V, Hall MN. mTOR in aging, metabolism, and cancer. Curr Opin Genet Dev 23: 53–62, 2013. [DOI] [PubMed] [Google Scholar]
- 9.Dever TE. Gene-specific regulation by general translation factors. Cell 108: 545–556, 2002. [DOI] [PubMed] [Google Scholar]
- 10.Efeyan A, Sabatini DM. mTOR and cancer: many loops in one pathway. Curr Opin Cell Biol 22: 169–176, 2010. [DOI] [PMC free article] [PubMed] [Google Scholar]
- 11.Gruppuso PA, Awad M, Bienieki TC, Boylan JM, Fernando S, Faris RA. Modulation of mitogen-independent hepatocyte proliferation during the perinatal period in the rat. In Vitro Cell Dev Biol Anim 33: 562–568, 1997. [DOI] [PubMed] [Google Scholar]
- 12.Gruppuso PA, Boylan JM, Anand P, Bienieki TC. Effects of maternal starvation on hepatocyte proliferation in the late gestation fetal rat. Pediatr Res 57: 185–191, 2005. [DOI] [PubMed] [Google Scholar]
- 13.Gruppuso PA, Boylan JM, Sanders JA. The physiology and pathophysiology of rapamycin resistance: Implications for cancer. Cell Cycle 10: 1050–1058, 2011. [DOI] [PMC free article] [PubMed] [Google Scholar]
- 14.Gruppuso PA, Tsai SW, Boylan JM, Sanders JA. Hepatic translation control in the late-gestation fetal rat. Am J Physiol Regul Integr Comp Physiol 295: R558–R567, 2008. [DOI] [PMC free article] [PubMed] [Google Scholar]
- 15.Guertin DA, Sabatini DM. Defining the role of mTOR in cancer. Cancer Cell 12: 9–22, 2007. [DOI] [PubMed] [Google Scholar]
- 16.Hershey JW. Translational control in mammalian cells. Annu Rev Biochem 60: 717–755, 1991. [DOI] [PubMed] [Google Scholar]
- 17.Huang S, Bjornsti MA, Houghton PJ. Rapamycins: mechanism of action and cellular resistance. Cancer Biol Ther 2: 222–232, 2003. [DOI] [PubMed] [Google Scholar]
- 18.Jefferies HB, Reinhard C, Kozma SC, Thomas G. Rapamycin selectively represses translation of the “polypyrimidine tract” mRNA family. Proc Natl Acad Sci USA 91: 4441–4445, 1994. [DOI] [PMC free article] [PubMed] [Google Scholar]
- 19.Jimenez RH, Lee JS, Francesconi M, Castellani G, Neretti N, Sanders JA, Sedivy J, Gruppuso PA. Regulation of gene expression in hepatic cells by the mammalian Target of Rapamycin (mTOR). PLoS One 5: e9084, 2010. [DOI] [PMC free article] [PubMed] [Google Scholar]
- 20.Kurmasheva RT, Huang S, Houghton PJ. Predicted mechanisms of resistance to mTOR inhibitors. Br J Cancer 95: 955–960, 2006. [DOI] [PMC free article] [PubMed] [Google Scholar]
- 21.Lamming DW, Demirkan G, Boylan JM, Mihaylova MM, Peng T, Ferreira J, Neretti N, Salomon A, Sabatini DM, Gruppuso PA. Hepatic signaling by the mechanistic target of rapamycin complex 2 (mTORC2). FASEB J 28: 300–315, 2013. [DOI] [PMC free article] [PubMed] [Google Scholar]
- 22.Laplante M, Sabatini DM. mTOR signaling. Cold Spring Harb Perspect Biol 4: a011593, 2012. [DOI] [PMC free article] [PubMed] [Google Scholar]
- 23.Laplante M, Sabatini DM. mTOR signaling in growth control and disease. Cell 149: 274–293, 2012. [DOI] [PMC free article] [PubMed] [Google Scholar]
- 24.Laplante M, Sabatini DM. Regulation of mTORC1 and its impact on gene expression at a glance. J Cell Sci: 1713–1719, 2013. [DOI] [PMC free article] [PubMed] [Google Scholar]
- 25.Liu B, Qian SB. Translational regulation in nutrigenomics. Adv Nutr 2: 511–519, 2011. [DOI] [PMC free article] [PubMed] [Google Scholar]
- 26.Livingstone M, Bidinosti M. Rapamycin-insensitive mTORC1 activity controls eIF4E:4E-BP1 binding. F1000Res 1: 4, 2012. [DOI] [PMC free article] [PubMed] [Google Scholar]
- 27.Pestova TV, Kolupaeva VG, Lomakin IB, Pilipenko EV, Shatsky IN, Agol VI, Hellen CU. Molecular mechanisms of translation initiation in eukaryotes. Proc Natl Acad Sci USA 98: 7029–7036, 2001. [DOI] [PMC free article] [PubMed] [Google Scholar]
- 28.Prevot D, Darlix JL, Ohlmann T. Conducting the initiation of protein synthesis: the role of eIF4G. Biol Cell 95: 141–156, 2003. [DOI] [PubMed] [Google Scholar]
- 29.Reich M, Liefeld T, Gould J, Lerner J, Tamayo P, Mesirov JP. GenePattern 2.0. Nat Genet 38: 500–501, 2006. [DOI] [PubMed] [Google Scholar]
- 30.Richter JD, Sonenberg N. Regulation of cap-dependent translation by eIF4E inhibitory proteins. Nature 433: 477–480, 2005. [DOI] [PubMed] [Google Scholar]
- 31.Sanders JA, Gruppuso PA. Hepatic, pancreatic and biliary cancers. In: Translation and Its Regulation in Cancer Biology and Medicine, edited by Parsyan A. London, UK: Springer, 2014. [Google Scholar]
- 32.Sanders JA, Lakhani A, Phornphutkul C, Wu KY, Gruppuso PA. The effect of rapamycin on DNA synthesis in multiple tissues from late gestation fetal and postnatal rats. Am J Physiol Cell Physiol 295: C406–C413, 2008. [DOI] [PMC free article] [PubMed] [Google Scholar]
- 33.Sengupta S, Peterson TR, Sabatini DM. Regulation of the mTOR complex 1 pathway by nutrients, growth factors, and stress. Mol Cell 40: 310–322, 2010. [DOI] [PMC free article] [PubMed] [Google Scholar]
- 34.Shatsky IN, Dmitriev SE, Andreev DE, Terenin IM. Transcriptome-wide studies uncover the diversity of modes of mRNA recruitment to eukaryotic ribosomes. Crit Rev Biochem Mol Biol 49: 164–177, 2014. [DOI] [PubMed] [Google Scholar]
- 35.Sonenberg N, Hinnebusch AG. Regulation of translation initiation in eukaryotes: mechanisms and biological targets. Cell 136: 731–745, 2009. [DOI] [PMC free article] [PubMed] [Google Scholar]
- 36.Storey JD, Tibshirani R. Statistical significance for genomewide studies. Proc Natl Acad Sci USA 100: 9440–9445, 2003. [DOI] [PMC free article] [PubMed] [Google Scholar]
- 37.Subramanian A, Kuehn H, Gould J, Tamayo P, Mesirov JP. GSEA-P: a desktop application for Gene Set Enrichment Analysis. Bioinformatics 23: 3251–3253, 2007. [DOI] [PubMed] [Google Scholar]
- 38.Tcherkezian J, Cargnello M, Romeo Y, Huttlin EL, Lavoie G, Gygi SP, Roux PP. Proteomic analysis of cap-dependent translation identifies LARP1 as a key regulator of 5′TOP mRNA translation. Genes Dev 28: 357–371, 2014. [DOI] [PMC free article] [PubMed] [Google Scholar]
- 39.Thoreen CC, Chantranupong L, Keys HR, Wang T, Gray NS, Sabatini DM. A unifying model for mTORC1-mediated regulation of mRNA translation. Nature 485: 109–113, 2012. [DOI] [PMC free article] [PubMed] [Google Scholar]
- 40.Villa N, Fraser CS. Diverse mechanisms of translation regulation and their role in cancer. In: Translation and Its Regulation in Cancer Biology and Medicine, edited by Parsyan A. London, UK: Springer, 2014, p. 39–72. [Google Scholar]
- 41.Vogel C, Marcotte EM. Insights into the regulation of protein abundance from proteomic and transcriptomic analyses. Nat Rev Genet 13: 227–232, 2012. [DOI] [PMC free article] [PubMed] [Google Scholar]
- 42.Williams-Hill DM, Duncan RF, Nielsen PJ, Tahara SM. Differential expression of the murine eukaryotic translation initiation factor isogenes eIF4A(I) and eIF4A(II) is dependent upon cellular growth status. Arch Biochem Biophys 338: 111–120, 1997. [DOI] [PubMed] [Google Scholar]


