

Significance
Theory holds that sympatric large mammalian herbivores (LMH) must partition food resources to coexist, and traditional frameworks categorize LMH along a spectrum from grass-eating grazers to non–grass-eating browsers. Yet it has never been clear how finely LMH partition the enormous species diversity subsumed within these two broad plant types. By sequencing plant DNA from LMH fecal samples, we analyzed the diets of an LMH assemblage in Kenya. Diet composition was similar within species and strongly divergent across species, irrespective of feeding guild: Grazers ate similar total amounts of grass but different suites of grass species. These results suggest that species-specific plant traits may be key to understanding the dietary differences thought to underpin LMH diversity.
Keywords: African savannas, body size, competition, coexistence, ungulates
Abstract
Niche partitioning facilitates species coexistence in a world of limited resources, thereby enriching biodiversity. For decades, biologists have sought to understand how diverse assemblages of large mammalian herbivores (LMH) partition food resources. Several complementary mechanisms have been identified, including differential consumption of grasses versus nongrasses and spatiotemporal stratification in use of different parts of the same plant. However, the extent to which LMH partition food-plant species is largely unknown because comprehensive species-level identification is prohibitively difficult with traditional methods. We used DNA metabarcoding to quantify diet breadth, composition, and overlap for seven abundant LMH species (six wild, one domestic) in semiarid African savanna. These species ranged from almost-exclusive grazers to almost-exclusive browsers: Grass consumption inferred from mean sequence relative read abundance (RRA) ranged from >99% (plains zebra) to <1% (dik-dik). Grass RRA was highly correlated with isotopic estimates of % grass consumption, indicating that RRA conveys reliable quantitative information about consumption. Dietary overlap was greatest between species that were similar in body size and proportional grass consumption. Nonetheless, diet composition differed between all species—even pairs of grazers matched in size, digestive physiology, and location—and dietary similarity was sometimes greater across grazing and browsing guilds than within them. Such taxonomically fine-grained diet partitioning suggests that coarse trophic categorizations may generate misleading conclusions about competition and coexistence in LMH assemblages, and that LMH diversity may be more tightly linked to plant diversity than is currently recognized.
Dietary niche partitioning contributes to the origin and maintenance of biodiversity by alleviating competition and allowing ecologically similar consumers to coexist (1–3). Of the many faunas in which this mechanism is thought to play a major structuring role, few have inspired as much research and debate as the diverse assemblages of large mammalian herbivores (LMH) (≥5 kg) that occur in African savannas and that were globally widespread before the Pleistocene extinctions (4–7). These assemblages often comprise 10–25 species (8, 9) that forage within the same areas. How can so many apparently generalist consumer species coexist on a limited range of resource types?
Attempts to address this question have yielded several key insights. One is that sympatric LMH vary in their proportional consumption of grasses versus browse (i.e., all nongrasses, including trees, shrubs, and forbs) (10). Thus, LMH can achieve dietary separation along a spectrum from pure grazers to pure browsers, and species can be categorized as predominantly grazers, browsers, or mixed feeders. In recent decades, stable-isotope analysis of C3 (browse) versus C4 (grass) consumption has been used to quantify this continuum (7, 11, 12). Although feeding guilds have been defined in various ways, and although LMH diets vary seasonally and spatially, the grazer–browser continuum has been documented repeatedly and remains central to theories of LMH community structure and diversification (8, 13–16).
A second set of insights linked dietary niche structure to LMH body size, morphology, and digestive strategy (i.e., ruminant vs. nonruminant). The Jarman–Bell Principle holds that larger species and hindgut-fermenting nonruminants subsist on larger quantities of lower quality forage than do smaller species and ruminants (13, 17–21). This can lead to spatiotemporal partitioning of food resources via microhabitat selection, grazing succession, and sward-height specialization (17, 22, 23). Similarly, browsing stratification enables partitioning of forage in vertical space, as taller LMH can access higher vegetation (13).
Notably, these mechanisms require only two broad groups of plants, grass and browse, to maintain LMH diversity. Both of these groups encompass enormous taxonomic, phylogenetic, and trait diversity, yet few studies have evaluated resource partitioning at the plant-species level (20, 24). Interspecific differences in dietary species richness and composition have been proposed to structure LMH assemblages (10, 18), but theoretical and empirical evaluation of this hypothesis is underdeveloped relative to mechanisms operating at both coarser (e.g., grazer–browser continuum) and finer (e.g., sward partitioning) taxonomic levels (13, 23, 25–27).
The paucity of species-level accounts stems from the difficulty of constructing high-resolution diet profiles for LMH, which are highly mobile, hard to observe at close range, and feed on diverse and often inconspicuous plant species. Most such studies have used one of two methods: direct observation of foraging animals (e.g., 20, 28) or microhistology, in which plant parts from feces are visually identified (e.g., 24, 29, 30). These methods have well-known limitations (31). Direct observation requires high visibility and is prone to omission (e.g., of foraging at night or on uncommon plants). Histology is effort-intensive and is often inaccurate and/or imprecise (32). DNA metabarcoding outperforms these traditional methods in many respects (31, 33) and may prove at least as good at revealing relative quantities of plant types in diets (30, 33, 34). However, to date DNA metabarcoding has been used primarily in single-species studies rather than to test hypotheses about niche relationships in diverse assemblages, and few studies have attempted to cross-validate DNA-based inferences about quantitative consumption patterns.
We quantified diet composition and overlap of seven sympatric LMH species in semiarid Kenyan savanna using DNA metabarcoding and stable-isotope analyses. We sequenced plant DNA from 292 fecal samples collected over a 152-km2 area (SI Appendix, Fig. S1) during a wet season at Mpala Research Centre (0°17’N, 37°52’E). Collectively, these seven species comprise 99% of LMH individuals and 94% of LMH biomass in this ecosystem (35), include grazing and browsing ruminants and nonruminants, represent three taxonomic orders, and span >2 orders of magnitude in mass from 5-kg dik-dik (Madoqua guentheri) to 1,725-kg elephant (Loxodonta africana). Of these species, plains zebra (Equus quagga, 200 kg), Grevy’s zebra (Equus grevyi, 375 kg), buffalo (Syncerus caffer, 450 kg), and domestic Boran cattle (Bos indicus, 322 kg) are traditionally considered grazers. Elephant and impala (Aepyceros melampus, 40 kg) are usually classified as mixed feeders and dik-dik as browsers; for simplicity, we refer to these three species as “nongrazers.”
We tested a series of specific, theoretically motivated predictions: (i) LMH species vary along a grazer–browser continuum, and (ii) their position on this continuum can be measured by the proportion of grass DNA in fecal samples (i.e., relative read abundance, RRA); (iii) larger LMH have greater dietary species richness (i.e., niche breadth); dietary dissimilarity increases with the (iv) size disparity between species and (v) geographic distance between samples; and (vi) there is strong interspecific partitioning of plant species within feeding guilds, (vii) even after accounting for effects of body size, digestive strategy, and spatial proximity.
Results
DNA Metabarcoding of LMH Diets.
We collected spatially overlapping (SI Appendix, Fig. S1) sets of fresh fecal samples (n = 27–52 per species) and analyzed them using a broad-spectrum DNA metabarcode marker: the P6 loop of the chloroplast trnL(UAA) intron, hereafter trnL(UAA)-P6 (36) (SI Appendix, Text S1 and Table S1). Although the plant DNA-barcoding community promotes the matK and rbcL loci, we selected trnL-P6 for dietary analysis due to its shorter length, conserved primer sites, and interspecific variation (33, 36). Most samples were collected after observing defecation, but we also opportunistically collected fresh dung and identified it by appearance. Because buffalo and cattle are the only species in our study with similar dung, we used DNA minibarcodes [mitochondrial cytochrome c oxidase subunit 1 (COI)] to verify the source of 41 putative buffalo samples, only two of which were incorrect and reassigned to cattle (>95% accuracy; SI Appendix, Text S1).
DNA metabarcoding requires comparing unknown sequences to a DNA reference library. In total, we obtained 110 unique trnL-P6 sequences (i.e., putative plant species; 32–62 per LMH species; SI Appendix, Table S2) and identified them using two reference libraries. Our primary library comprised trnL-P6 sequences from our local collection of 1,369 plant specimens representing ≥291 species (of ∼480 known from the area; SI Appendix, Text S2; see Data Deposition). Of these reference sequences, 77% corresponded to a single species/morphospecies, which indicates that our approach yields high-resolution identifications and is consistent with prior evaluations of this marker (33, 36) (SI Appendix, Text S3). A second reference library was constructed by extracting all trnL-P6 sequences from the global European Molecular Biology Laboratory database, which we used to identify taxa absent from our local library (SI Appendix, Text S3). All 110 dietary sequences were identified to family level or better and represented 25 plant families (SI Appendix, Table S3); 70 dietary sequences (64%) perfectly matched the local library and an additional seven (cumulatively, 70%) perfectly matched the global library (SI Appendix, Table S3). Twenty-four dietary sequences perfectly matched >1 species in the local database and thus represent supraspecific taxa (SI Appendix, Table S3).
Dietary Richness and Guild Evaluation.
We quantified diet composition using two distinct metrics: (i) sequence occurrence (i.e., presence/absence), which when averaged across all samples yields relative frequency of occurrence (FOO), and (ii) sequence RRA, defined as the proportion of unique Illumina sequence reads in a sample divided by the final (i.e., after quality control) number of sequence reads in that sample. We conservatively based most of our inferences on occurrence data, because RRA may not always accurately reflect the relative intake of plant species (33). However, we used mean RRA at the level of plant families to infer quantitative patterns of consumption (30, 34) and at the level of unique sequences to assess the robustness of our occurrence-based results.
Sample-based species-accumulation curves approached asymptotes (SI Appendix, Fig. S2A), indicating adequate sampling of LMH diets (37). Dietary richness was greatest for buffalo and impala and least for the two zebras (SI Appendix, Fig. S2B); thus, we found no evidence that diet breadth increases monotonically with body size. LMH species overlapped considerably in plant taxa consumed (Fig. 1)—all ate at least some grasses, forbs, and trees—but diverged in FOO of different plant types. The plants with the highest overall FOO included some of the most common in the area (38): the grasses Cynodon spp., Pennisetum spp., and Digitaria spp. (FOO = 0.47–0.76); the forbs Indigofera spp. (0.66); and the tree Acacia brevispica (0.46; SI Appendix, Table S3).
Fig. 1.

Bipartite networks depicting diet composition and overlap of grazers (Left) and nongrazers (Right). Lines connect LMH species (outer boxes) to dietary plant sequences (inner boxes), which are colored by plant family. Widths of inner boxes are scaled to reflect how frequently each sequence was detected across all samples from all LMH species; line widths show how frequently each plant was detected in samples from each LMH species. Plants detected in both grazer and nongrazer diets appear in both networks. Boxes are ordered to minimize overlapping lines.
To test support for conventional LMH feeding guilds, we compared RRA of the main dietary plant families within and across LMH species (Fig. 2). As expected, mean RRA of Poaceae (grasses) was greatest (>96%) for the two zebras (nonruminant grazers), less for the ruminant grazers (55–59%), lesser still for impala and elephant (29–33%), and least for dik-dik (<1%; Fig. 2A). Roughly the reverse was true for Fabaceae (legumes) RRA, which was lowest in zebras and highest in elephants and dik-dik (Fig. 2B). Mean RRA of Malvaceae also differed among LMH species, comprising >10% for only buffalo and dik-dik (Fig. 2C). Cumulative mean RRA of the remaining 23 plant families was greatest for dik-dik [26%, with Dyschoriste radicans (Acanthaceae) being most abundant at 5.3%], and ≤10% for all other LMH species (Fig. 2D). These data support coarse grazing (>50% mean grass RRA) and nongrazing (<50%) guilds but also reveal dietary nuance within guilds.
Fig. 2.

Mean RRA per sample for (A) Poaceae, (B) Fabaceae, (C) Malvaceae, and (D) all remaining plant families (±1 SEM) for each LMH species. Each comparison revealed significant differences (ANOVA, all F6,285 ≥ 14.1, P < 0.001). Letters above bars denote significant differences (Tukey's HSD). (E) Correlation of proportional C4 consumption estimated from stable isotopes vs. grass consumption estimated from mean RRA in a subset of samples from each species (mean ± SD). The trend line fit to the data (dashed; slope = 0.98, F1,5 = 27.9, R2 = 0.85 P < 0.01) nearly overlaps with the 1:1 line (solid).
We cross-validated these inferences using fecal stable-isotope analysis (δ13C), a common measure of grass:browse ratios in African savanna LMH diets (7, 39). Raw δ13C values from a subset of samples (n = 33) differed significantly among species and were positively correlated with grass RRA values (SI Appendix, Text S4, Table S4, and Fig. S3). Proportional C4-plant consumption, estimated from δ13C using a Bayesian mixing model (40) (SI Appendix, Text S4), was likewise highly correlated with mean grass RRA across LMH species (Fig. 2E). Thus, RRA provides a reliable proxy for grass:browse consumption ratios.
Quantifying Diet Composition and Overlap.
We measured intraspecific (among-individual) variability and interspecific niche separation using Bray–Curtis dissimilarities (41), which range from 0 (complete overlap) to 1 (complete nonoverlap). Dietary dissimilarities were lower (i.e., diets more similar) within LMH species than among them (mean dissimilarity = 0.428 vs. 0.678; Table 1). Intraspecific dietary dissimilarity differed among species, from 0.297 in plains zebra (most consistent among individuals) to 0.541 in dik-dik (most variable among individuals; Table 1). Interspecific niche separation occurred across the grazer–browser continuum, being least between the two zebras (0.434) and nearly complete between plains zebra and dik-dik (0.988; Table 1).
Table 1.
Intra- and interspecific dietary overlap calculated using occurrence- (below diagonal) and RRA-based data (above diagonal)
| Grazers | Nongrazers | |||||||
| Species | Plains zebra | Grevy’s zebra | Cattle | Buffalo | Dik-dik | Impala | Elephant | Intraspecific means* |
| Plains zebra | 0.720 | 0.815 | 0.778 | 0.997 | 0.898 | 0.910 | 0.484d | |
| Grevy’s zebra | 0.434 | 0.717 | 0.798 | 0.987 | 0.793 | 0.843 | 0.589c | |
| Cattle | 0.579 | 0.512 | 0.718 | 0.881 | 0.684 | 0.847 | 0.516c | |
| Buffalo | 0.577 | 0.609 | 0.564 | 0.921 | 0.793 | 0.860 | 0.654b | |
| Dik-dik | 0.988 | 0.959 | 0.823 | 0.832 | 0.795 | 0.791 | 0.732a | |
| Impala | 0.747 | 0.679 | 0.558 | 0.629 | 0.640 | 0.720 | 0.632bc | |
| Elephant | 0.728 | 0.684 | 0.697 | 0.679 | 0.750 | 0.579 | 0.508b | |
| Intraspecific means* | 0.297d | 0.396c | 0.408c | 0.467b | 0.541a | 0.427bc | 0.466b | |
Values are weighted means of Bray–Curtis dissimilarities (low values = high overlap).
Superscripts reflect significant pairwise differences in intraspecific variation, measured as dispersion (occurrence-based permutation test, F6,285 = 16.94, P ≤ 0.001; RRA-based permutation test F6,285 = 12.88, P ≤ 0.001).
We compared diet composition among species using adonis, a permutational (per)MANOVA that can accommodate both categorical and continuous predictor variables (41). As expected, LMH of similar body mass had similar diets (pseudo F1,290 = 75.9, R2 = 0.21, P ≤ 0.0001; Fig. 3). This association remained statistically significant (pseudo F1,288 = 101.7, R2 = 0.21, P ≤ 0.0001) even after accounting for effects of feeding guild (pseudo F1,288 = 75.2, R2 = 0.15, P ≤ 0.0001) and the Guild × Body Mass interaction (pseudo F1,288 = 25.0, R2 = 0.05, P ≤ 0.0001).
Fig. 3.

Correlation between mean pairwise dietary dissimilarities (Table 1) and body mass differences (35) among LMH species. Colored points show intraspecific comparisons (body mass difference = 0); shapes show interspecific comparisons within and between grazer and nongrazer guilds (body mass difference > 0). Regressions are fit both for all comparisons (solid, F1,26 = 42.71, R2 = 0.62, P < 0.001) and for interspecific comparisons only (dashed, F1,19 = 17.89, R2 = 0.49, P < 0.001).
To visualize patterns in dietary dissimilarity within and among species, we used nonmetric multidimensional scaling (NMDS). Diets differed strongly among LMH species, with minor overlap of samples from species with similar feeding strategies; interspecific groups of samples showed clear separation from near-exclusive grazers to progressively less-exclusive grazers (Fig. 4A). To elucidate within-guild niche segregation, we ran perMANOVA and NMDS analyses for grazers and nongrazers separately. Diets differed significantly within both guilds (Fig. 4 B and C).
Fig. 4.
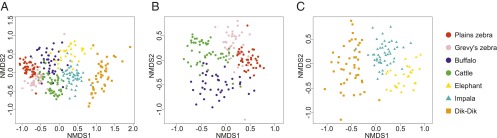
Niche partitioning within and among feeding guilds. NMDS of occurrence-based Bray–Curtis dissimilarity of samples from (A) all seven LMH species (adonis pseudo F6,285 = 59.0, R2 = 0.55, P ≤ 0.0001), (B) only grazers (pseudo F3,167 = 36.6, R2 = 0.40, P ≤ 0.0001), and (C) only nongrazers (pseudo F2,118 = 31.2, R2 = 0.35, P ≤ 0.0001). Symbols distinguish “grazers” (circles), “mixed feeders” (triangles), and “browsers” (squares).
We evaluated how strongly sample compositions reflected their spatial proximity. Because diet composition is influenced by relative availability of spatially variable forage types, we sampled each LMH species as evenly as possible across the study area. Although this area is small relative to most African protected areas, intraspecific dietary dissimilarity increased significantly with distance between samples for all species except the zebras (Mantel tests, r = 0.06–0.58; SI Appendix, Fig. S4).
We used two complementary analyses to examine the sensitivity of our inferences about within-guild niche partitioning to (i) spatial heterogeneity and (ii) LMH body size and digestive strategy. First, we compared two pairs of focal grazer species roughly matched in size and digestive strategy: plains versus Grevy’s zebra (nonruminant grazers ∼200–375 kg) and cattle versus buffalo (ruminant grazers ∼320–450 kg). For each pair, we analyzed dietary dissimilarity of samples collected near (0–2.3 km) and far (>2.3 km) from each other, using permutation tests (2.3 km matches zebra mean daily movement diameter and is ∼10% of the maximum distance between samples; SI Appendix, Text S5 and Table S5). Within species, samples were significantly more similar than expected at both scales (SI Appendix, Fig. S5). Between species, distant samples differed significantly for both focal pairs; nearby samples differed significantly between cow and buffalo but nonsignificantly between the two zebras.
Second, for the zebras only, we compared subsets of samples from two spatially discrete clusters (again ∼2.3-km diameter) using adonis. Diet composition differed between the two species (pseudo F1,30 = 5.2, R2 = 0.13, P = 0.0002) and across the two locations (pseudo F1,30 = 3.8, R2 = 0.09, P = 0.0058), with no significant Species × Location interaction (pseudo F1,30 = 2.2, R2 = 0.05, P > 0.07). Thus, although intraspecific diets varied spatially, the observed within-guild niche separation was not simply an artifact of interspecific differences in body size, digestive strategy, or microhabitat affiliation.
To explore the biological basis of this within-guild niche partitioning, we used indicator-species analyses (42). Fifteen plant taxa differed significantly in FOO between the two zebra species (33% of 45 total taxa detected; 14 grasses, one forb; SI Appendix, Table S6). Ten of these had higher FOO in Grevy’s (notably Cynodon plectostachyus and Indigofera spp.) and five in plains (notably Themeda triandra; SI Appendix, Table S6). Similarly, 35 taxa differed between cattle and buffalo (46% of 76). Twenty-two of these had higher FOO in buffalo than cattle samples, including 12 grasses (notably Pennisetum stramineum) and four trees (notably A. brevispica; SI Appendix, Table S6). Of the 13 taxa more frequent in cattle diets, seven were grasses and six were forbs (notably Indigofera spp.; SI Appendix, Table S6).
We considered whether incidental ingestion, environmental DNA deposition, and/or PCR-amplification bias potentially exaggerated the niche-partitioning signal in our analyses of occurrence-based trnL-P6 data by further analyzing (i) RRA-based trnL-P6 data (SI Appendix, Text S4) and (ii) sequence data from three plant family-specific internal transcribed spacer (ITS) markers (SI Appendix, Text S6). Patterns were qualitatively similar in each analysis (SI Appendix, Table S7 and Figs. S6 and S7).
Discussion
Comparing Diets Within and Among Guilds.
In several respects, our data are consistent with predictions from prior work: LMH were arrayed across a grazer–browser continuum (Figs. 1 and 2), and species closer in body size (Table 1 and Fig. 3) and individuals occurring closer in space (SI Appendix, Figs. S4 and S5) had more similar diets. However, DNA metabarcoding also yielded insights that have implications for our understanding of competition and coexistence in diverse LMH assemblages. Most importantly, we found marked differences in dietary richness (SI Appendix, Fig. S2) and composition (Fig. 4 and SI Appendix, Table S6) within guilds. Indeed, each species had distinctive diets, and overall compositional similarity was in some cases as great across guilds as within them (Table 1).
A key advantage of DNA metabarcoding relative to stable-isotope analysis (7, 11, 12) is taxonomic resolution. In our study, RRA-based grass consumption nicely paralleled isotopic estimates and implied three conventional feeding guilds (browsers, mixed feeders, and grazers; Fig. 2E). However, compositional differences occurred between species at all points along the grazer–browser continuum (Figs. 2 and 4): The diets of two zebra species differed despite containing near-identical proportions of grasses, and the same was true for buffalo and cattle, and for impala and elephant. We were able to pinpoint the source of these differences. For example, Grevy’s and plains zebra diets differed in FOO of 14 grass taxa but had similar FOO of the abundant grass P. stramineum (0.97 vs. 0.98, respectively; SI Appendix, Table S6). Field observations and microhistology, which afford some taxonomic precision but are biased toward high-visibility and/or low-digestibility resources (31, 32), may often fail to identify such fine-grained niche separation.
Our data also reveal dietary similarities that cross guild boundaries. Compositional similarity between cattle and impala diets was at least as great as that between cattle and other grazers (Table 1), irrespective of grass:browse ratios (Fig. 2 A and E). Cross-guild similarities were also evident in the FOO of certain forage species, such as the legumes Indigofera spp. (fourth-highest total FOO), which were frequently eaten by ruminant grazers (0.85 buffalo, 1.0 cattle), mixed feeders (0.98 impala), and browsers (0.87 dik-dik; SI Appendix, Table S3). This finding accords with traditional knowledge—Wodaabe pastoralists in Niger credit Indigofera with maintaining cattle condition when grass is scarce (44)—and with work showing that grazing ruminants supplement grass diets with forbs to maintain protein–energy balance (45). Similarly, although dik-dik consumed little grass (Fig. 2), the grass-specific ITS marker revealed two common grasses in >90% of dik-dik samples (Digitaria sp. and Pennisetum spp.; SI Appendix, Table S7), perhaps because digestible grasses mitigate the metabolic cost of excess protein consumption (15, 45).
DNA metabarcoding is thought to have a limited ability to reveal relative amounts of foods consumed due to variation in DNA content across plant species and tissues, variation in digestion efficiency (but see ref. 16), and/or bias introduced by laboratory procedures—including the possibility that primer mismatches inhibit amplification of some plant species (33). Although it remains unclear how accurately RRA reflects relative consumption of individual plant species, our correlations between dietary C4 estimates from RRA and δ13C (Fig. 2E and SI Appendix, Fig. S3) add to a growing body of evidence (30, 34) that RRA is a reliable proxy for relative consumption of grass versus other plant families. Thus, DNA metabarcoding can reveal as much about quantitative consumption patterns as do common isotopic analyses.
Alternative Hypotheses and Future Directions.
The observed dietary partitioning could be due to three non-mutually exclusive mechanisms: (i) divergent forage preferences or constraints, (ii) competitive displacement, and/or (iii) spatial variation in the availability of different foods. We cannot evaluate i vs. ii: The former requires independent resource availability and/or quality measures, the latter experimental removal of competing LMH species. However, several lines of evidence suggest our results are not solely a byproduct of (iii) spatial segregation. First, we sampled only within a single dominant habitat, which supports a characteristic flora with similar relative abundances across the study area (46). This does not control for animals’ prior movements, but LMH fecal material typically reflects consumption over ∼24–48 h (47). Long-distance movements within such short time intervals are rare for territorial antelope (dik-dik, impala), zebra (mean daily extent = 2.3 km), and cattle (which return to corrals nightly). Thus, short-term integration of dietary DNA should limit the influence of such movements on our results. We further accounted for variation in microhabitat use by showing that grazers’ diets differed both within and across a 2.3-km range.
Although LMH diets vary seasonally, our data are from a wet season when food was abundant, and available evidence suggests that our results are therefore likely to conservatively describe dietary separation. Stable-isotope studies show that nongrazers consume more grass in the wet season, potentially increasing overlap with grazers (16). Observational (20) and microhistological (29) studies also suggest LMH dietary segregation is more pronounced in the dry season (but see ref. 48). Thus, the niche partitioning documented here may be stronger in the dry season.
Our findings are not inconsistent with models of the evolution and maintenance of LMH diversity that emphasize differences in diet type and/or quality, mediated by body size and/or digestive physiology (13, 14, 16–18, 49). However, our study departs from prior work in elucidating taxonomic patterns of diet composition, breadth, and overlap that are not captured in prevailing conceptual frameworks. Species-level accounting of food plants offers a precise way of integrating diet type with the plant traits that determine diet quality (nutrients, digestibility, defenses), which will help resolve long-standing debates over the primacy of these two factors in shaping LMH diversity (16). Taxonomic, phylogenetic, and trait-based analyses of insect herbivore–plant interactions have yielded key insights about the global diversity of plants and animals (50, 51) and may similarly transform our understanding of LMH and the ecosystems they inhabit (14, 16, 49).
As demonstrated by our analysis of domestic cattle, our approach could be applicable to environmental management. Wildlife and livestock overlap in rangelands worldwide (52), and resource competition between them (both real and perceived) is a major source of human–wildlife conflict (53). However, the extent of dietary overlap is poorly resolved due to the difficulty of studying wildlife diets (52). Controlled studies using DNA metabarcoding could elucidate the mechanisms of facilitative and competitive interactions as well as identify important forage species, thereby informing management strategies.
Materials and Methods
Identifying Dietary Plant Species by DNA Metabarcoding.
Fecal samples were collected in June–July 2013 from seven of the 10 highest biomass LMH at Mpala Research Centre (35). Plant DNA was amplified using trnL-P6 and family-specific ITS markers for grasses, sedges, and asters and then sequenced on an Illumina HiSeq 2500 (36, 43) (SI Appendix, Text S1). Sequence demultiplexing, identifications, and quality controls (i.e., removing sequences with Illumina fastq quality scores <30, shorter lengths than expected, and putative errors) were performed using obitools software (SI Appendix, Text S3). Sequences removed during quality control steps were excluded from RRA calculations.
Dietary Richness and Guild Evaluation.
We assessed sampling sufficiency and dietary richness in EstimateS 9.1 (54). We built bipartite networks to visualize links between LMH species and their shared or exclusive foods within guilds using bipartite (55) in R (56). We tested for differences among LMH species in RRA of the three most abundant plant families in our samples as well as the combined RRA of remaining families, using ANOVA. We cross-validated family-level RRA comparisons using stable-isotopes (δ13C) analyzed at the University of California Santa Cruz Stable Isotope Facility (SI Appendix, Text S4). We tested for differences in δ13C between species (ANOVA) and the correlation between δ13C and grass RRA in each sample (linear regression). We then regressed mean species-level grass RRA against proportional C4 consumption, as estimated by a two-source Bayesian mixing model using local C3 and C4 plants as endpoints (SI Appendix, Text S4).
Quantifying Diet Composition and Overlap.
We measured Bray–Curtis dissimilarity in vegan (41). Pairwise differences in intraspecific dietary variation (i.e., dispersion) were tested using the functions betadisper and permutest with 999 permutations and bias adjustment. Differences in diet composition were analyzed as independent functions of (i) LMH species and (ii) body size using adonis with 9,999 permutations in vegan. In the analysis by species, we separately tested for differences among species within guilds. In the analysis by body size, we also grouped species into feeding guilds and tested the Size × Guild interaction. We performed NMDS in vegan. To assess the robustness of our main results (occurrence-based trnL-P6 data), we performed bipartite-network, adonis, and NMDS analyses on (i) RRA trnL-P6 data (SI Appendix, Text S4) and (ii) family-specific ITS markers (SI Appendix, Text S6).
We assessed the influence of samples’ spatial proximity on dietary dissimilarity for each LMH species using Mantel tests with 999 permutations in vegan. For focal pairs of grazers (plains vs. Grevy’s zebra, cattle vs. buffalo), we tested for differences in sample composition across small (0–2.3 km) and large (>2.3 km) distances (SI Appendix, Text S5 and Table S5). We generated a null distribution of Bray–Curtis dissimilarities across these distance classes using 999 permutations and compared the null distribution to the observed dissimilarity of intra- and interspecific samples within distance classes (57). We standardized results by the mean dissimilarity of all samples from each species pair, such that positive values indicate that diets are more similar than the null and vice versa. We identified two discrete clusters of zebra samples, each ∼2.3-km diameter (as above) and separated by >3.9 km, that contained 34 samples (24 plains, 10 Grevy’s). We used adonis to test for differences by species, location, and Species × Location.
To determine which plant taxa most contributed to niche partitioning between the focal grazer pairs, we performed indicator species analyses. These analyses comprised one-sided tests of the null hypothesis that the FOO of a plant taxon in samples from one species is not greater than its FOO in the other. We used the signassoc function with 999 permutations and Sidak’s correction for multiple comparisons in indicspecies v.1.7.2 (42).
Supplementary Material
Acknowledgments
B. von Holt, K. Fox-Dobbs, R. Kartzinel, R. Long, the Lewis Sigler Institute, M. Musili, H. Oyieke, and the KenBOL Project assisted with data collection and analysis. M. Brown, G. Charles, E. DeFranco, V. Ezenwa, A. Hassan, R. Hohbein, S. Kurukura, and M. Mohamed provided field support. I. Lopez produced silhouette images (Fig. 1). T. Young and three reviewers provided helpful comments. We thank the Government of Kenya for permission to conduct this research, which was supported by Grants to R.M.P. from the Princeton Environmental Institute, US National Science Foundation (DEB-1355122), and National Geographic Society (9291-13).
Footnotes
The authors declare no conflict of interest.
This article is a PNAS Direct Submission.
Data deposition: The data reported in this article have been deposited in Dryad Digital Repository, datadryad.org (dx.doi.org/10.5061/dryad.2fg10).
See Commentary on page 7890.
This article contains supporting information online at www.pnas.org/lookup/suppl/doi:10.1073/pnas.1503283112/-/DCSupplemental.
References
- 1.Hutchinson GG. Homage to Santa Rosalia or why are there so many kinds of animals? Am Nat. 1959;93(870):145–159. [Google Scholar]
- 2.Schoener TW. Resource partitioning in ecological communities. Science. 1974;185(4145):27–39. doi: 10.1126/science.185.4145.27. [DOI] [PubMed] [Google Scholar]
- 3.Ricklefs RE. Disintegration of the ecological community. Am Nat. 2008;172(6):741–750. doi: 10.1086/593002. [DOI] [PubMed] [Google Scholar]
- 4.Jarman PJ, Sinclair ARE. Feeding strategy and the patternof resource partitioning in ungulates. In: Sinclair ARE, Norton-Griffiths M, editors. Serengeti: Dynamics of an Ecosystem. University of Chicago Press; Chicago: 1979. pp. 130–163. [Google Scholar]
- 5.Belovsky GE. Generalist herbivore foraging and its role in competitive interactions. Animal Zool. 1986;26(1):51–69. [Google Scholar]
- 6.Uno KT, et al. Late Miocene to Pliocene carbon isotope record of differential diet change among East African herbivores. Proc Natl Acad Sci USA. 2011;108(16):6509–6514. doi: 10.1073/pnas.1018435108. [DOI] [PMC free article] [PubMed] [Google Scholar]
- 7.Codron D, et al. Diets of savanna ungulates from stable carbon isotope composition of feces. J Zool (Lond) 2007;273(1):21–29. [Google Scholar]
- 8.McNaughton SJ, Georgiadis NJ. Ecology of African grazing and browsing mammals. Annu Rev Ecol Syst. 1986;17(1):39–65. [Google Scholar]
- 9.Sinclair ARE, Mduma S, Brashares JS. Patterns of predation in a diverse predator-prey system. Nature. 2003;425(6955):288–290. doi: 10.1038/nature01934. [DOI] [PubMed] [Google Scholar]
- 10.Lamprey HF. Ecological separation of the large mammal species in the Tarangire Game Reserve, Tanganyika. East African Wildlife Journal. 1963;1(1):63–92. [Google Scholar]
- 11.Ambrose SH, DeNiro MJ. The isotopic ecology of East African mammals. Oecologia. 1986;69(3):395–406. doi: 10.1007/BF00377062. [DOI] [PubMed] [Google Scholar]
- 12.Cerling TE, Harris JM, Passey BH. Diets of east African Bovidae based on stable isotope analysis. J Mammal. 2003;84(2):456–470. [Google Scholar]
- 13.du Toit JT, Olff H. Generalities in grazing and browsing ecology: Using across-guild comparisons to control contingencies. Oecologia. 2014;174(4):1075–1083. doi: 10.1007/s00442-013-2864-8. [DOI] [PubMed] [Google Scholar]
- 14.Hofmann RR. Evolutionary steps of ecophysiological adaptation and diversification of ruminants: A comparative view of their digestive system. Oecologia. 1989;78(4):443–457. doi: 10.1007/BF00378733. [DOI] [PubMed] [Google Scholar]
- 15.Codron D, Lee-Thorp JA, Sponheimer M, Codron J. Nutritional content of savanna plant foods: Implications for browser/grazer models of ungulate diversification. Eur J Wildl Res. 2007;53(2):100–111. [Google Scholar]
- 16.Codron D, et al. Significance of diet type and diet quality for ecological diversity of African ungulates. J Anim Ecol. 2007;76(3):526–537. doi: 10.1111/j.1365-2656.2007.01222.x. [DOI] [PubMed] [Google Scholar]
- 17.Bell RHV. A grazing ecosystem in the Serengeti. Sci Am. 1971;225(1):86–93. [Google Scholar]
- 18.Jarman PJ. The social organization of antelope in relation to their ecology. Behaviour. 1974;48(1):215–267. [Google Scholar]
- 19.Arsenault R, Owen-Smith N. Resource partitioning by grass height among grazing ungulates does not follow body size relation. Oikos. 2008;117(11):1711–1717. [Google Scholar]
- 20.Kleynhans EJ, Jolles AE, Bos MRE, Olff H. Resource partitioning along multiple niche dimensions in differently sized African savanna grazers. Oikos. 2011;120(4):591–600. [Google Scholar]
- 21.Duncan P, Foose TJ, Gordon IJ, Gakahu CG, Lloyd M. Comparative nutrient extraction from forages by grazing bovids and equids: A test of the nutritional model of equid/bovid competition and coexistence. Oecologia. 1990;84(3):411–418. doi: 10.1007/BF00329768. [DOI] [PubMed] [Google Scholar]
- 22.Vesey-FitzGerald DF. Grazing succession among East African game animals. J Mammal. 1960;41(2):161–172. [Google Scholar]
- 23.Farnsworth KD, Focardi S, Beecham JA. Grassland-herbivore interactions: How do grazers coexist? Am Nat. 2002;159(1):24–39. doi: 10.1086/324114. [DOI] [PubMed] [Google Scholar]
- 24.de longh HH, et al. Resource partitioning among African savanna herbivores in North Cameroon: The importance of diet composition, food quality, and body mass. J Trop Ecol. 2011;27(5):503–513. [Google Scholar]
- 25.Cromsigt JPGM, Olff H. Resource partitioning among savanna grazers mediated by local heterogeneity: an experimental approach. Ecology. 2006;87(6):1532–1541. doi: 10.1890/0012-9658(2006)87[1532:rpasgm]2.0.co;2. [DOI] [PubMed] [Google Scholar]
- 26.Owen-Smith N. 1985. Niche separation among African ungulates. Species and Speciation, Transvaal Museum Monograph 4, ed Vrba ES (Transvaal Museum Pretoria, South Africa), pp 167–171.
- 27.Bagchi S, Ritchie ME. Body size and species coexistence in consumer-resource interactions: A comparison of two alternative theoretical frameworks. Theor Ecol. 2012;5(1):141–151. [Google Scholar]
- 28.Perrin MR, Brereton-Stiles R. Habitat use and feeding behaviour of the buffalo and the white rhinoceros in the Hluhluwe-Umfolozi Game Reserve. S Afr J Wildl Res. 1999;29(3):72–80. [Google Scholar]
- 29.Prins HHT, et al. Co-existence and niche segregation of three small bovids in southern Mozambique. J Af Ecol. 2006;44(2):186–198. [Google Scholar]
- 30.Soininen EM, et al. Analysing diet of small herbivores: The efficiency of DNA barcoding coupled with high-throughput pyrosequencing for deciphering the composition of complex plant mixtures. Front Zool. 2009;6:16. doi: 10.1186/1742-9994-6-16. [DOI] [PMC free article] [PubMed] [Google Scholar]
- 31.Newmaster SG, et al. Examination of two new technologies to assess the diet of woodland caribou: Video recorders attached to collars and DNA barcoding. Can J For Res. 2013;43(10):897–900. [Google Scholar]
- 32.Carrière S. Photographic key for the microhistological identification of some Artic vascular plants. Arctic. 2002;55(3):247–268. [Google Scholar]
- 33.Pompanon F, et al. Who is eating what: Diet assessment using next generation sequencing. Mol Ecol. 2012;21(8):1931–1950. doi: 10.1111/j.1365-294X.2011.05403.x. [DOI] [PubMed] [Google Scholar]
- 34.Willerslev E, et al. Fifty thousand years of Arctic vegetation and megafaunal diet. Nature. 2014;506(7486):47–51. doi: 10.1038/nature12921. [DOI] [PubMed] [Google Scholar]
- 35.Augustine DJ. Response of native ungulates to drought in semi-arid Kenyan rangeland. Afr J Ecol. 2010;48(4):1009–1020. [Google Scholar]
- 36.Taberlet P, et al. Power and limitations of the chloroplast trnL (UAA) intron for plant DNA barcoding. Nucleic Acids Res. 2007;35(3):e14. doi: 10.1093/nar/gkl938. [DOI] [PMC free article] [PubMed] [Google Scholar]
- 37.Colwell RK, et al. Models and estimators linking individual-based and sample-based rarefaction, extrapolation, and comparison of assemblages. J Plant Ecol. 2012;5(1):3–21. [Google Scholar]
- 38.Goheen JR, et al. Piecewise disassembly of a large-herbivore community across a rainfall gradient: The UHURU experiment. PLoS ONE. 2013;8(2):e55192. doi: 10.1371/journal.pone.0055192. [DOI] [PMC free article] [PubMed] [Google Scholar]
- 39.Codron D, et al. Assessing diet in savanna herbivores using stable carbon isotope ratio of faeces. Koedoe. 2005;48(1):115–124. [Google Scholar]
- 40.Parnell A, Jackson A. 2013. siar: Stable Isotope Analysis in R, v. 4.2. Available at cran.r-project.org/web/packages/siar/index.html.
- 41.Oksanen J, et al. 2013 vegan: Community Ecology Package. Available at CRAN.R-project.org/package=vegan.
- 42.De Cáceres M, Legendre P. Associations between species and groups of sites: Indices and statistical inference. Ecology. 2009;90(12):3566–3574. doi: 10.1890/08-1823.1. [DOI] [PubMed] [Google Scholar]
- 43.De Barba M, et al. DNA metabarcoding multiplexing and validation of data accuracy for diet assessment: Application to omnivorous diet. Mol Ecol Resour. 2014;14(2):306–323. doi: 10.1111/1755-0998.12188. [DOI] [PubMed] [Google Scholar]
- 44.Krätli S, Schareika N. Living off uncertainty: The intelligent animal production of dryland pastoralists. Eur J Dev Res. 2010;22(5):605–622. [Google Scholar]
- 45.Odadi WO, Karachi MK, Abdulrazak SA, Young TP. Protein supplementation reduces non-grass foraging by a primary grazer. Ecol Appl. 2013;23(2):455–463. doi: 10.1890/12-0878.1. [DOI] [PubMed] [Google Scholar]
- 46.Augustine DJ. Spatial heterogeneity in the herbaceous layer of a semi-arid savanna ecosystem. Plant Ecol. 2003;167(2):319–332. [Google Scholar]
- 47.Steuer P, et al. Is there an influence of body mass on digesta mean retention time in herbivores? A comparative study on ungulates. Comp Biochem Physiol A Mol Integr Physiol. 2011;160(3):355–364. doi: 10.1016/j.cbpa.2011.07.005. [DOI] [PubMed] [Google Scholar]
- 48.Hansen RM, Mugambi MM, Bauni SM. Diets and trophic ranking of ungulates of the Northern Serengeti. J Wildl Manage. 1985;49(3):823–829. [Google Scholar]
- 49.Gordon IJ, Illius AW. The nutritional ecology of African ruminants: A reinterpretation. J Anim Ecol. 1996;65(1):18–28. [Google Scholar]
- 50.Novotny V, et al. Why are there so many species of herbivorous insects in tropical rainforests? Science. 2006;313(5790):1115–1118. doi: 10.1126/science.1129237. [DOI] [PubMed] [Google Scholar]
- 51.Forister ML, et al. The global distribution of diet breadth in insect herbivores. Proc Natl Acad Sci USA. 2015;112(2):442–447. doi: 10.1073/pnas.1423042112. [DOI] [PMC free article] [PubMed] [Google Scholar]
- 52.Prins HHT. Competition between wildlife and livestock in Africa. In: Prins HHT, editor. Wildlife Conservation by Sustainable Use. Kluwer Academic Publishers; Boston: 2000. [Google Scholar]
- 53.Odadi WO, Karachi MK, Abdulrazak SA, Young TP. African wild ungulates compete with or facilitate cattle depending on season. Science. 2011;333(6050):1753–1755. doi: 10.1126/science.1208468. [DOI] [PubMed] [Google Scholar]
- 54.Colwell RK. 2013. EstimateS: Statistical Estimation of Species Richness and Shared Species From Samples. Version 9. Available at purl.oclc.org/estimates.
- 55.Dorman CF, Gruber B, Fruend J. Introducing the bipartite package: Analysing ecological networks. R News. 2008;8(2):8–11. [Google Scholar]
- 56.R Core Development Team . R: A Language and Environment for Statistical Computing. R Foundation for Statistical Computing; Vienna, Austria: 2013. [Google Scholar]
- 57.Legendre P, Fortin M-J. Spatial pattern and ecological analysis. Vegetatio. 1989;80(2):107–138. [Google Scholar]
Associated Data
This section collects any data citations, data availability statements, or supplementary materials included in this article.