Significance
Clinical studies report that a single, low dose of ketamine produces a rapid antidepressant response in treatment-resistant depressed patients. Although rodent studies have begun to elucidate the molecular mechanisms underlying the behavioral actions of ketamine, the brain regions and cellular mechanisms have not been defined. Using a combination of pharmacological silencing and optogenetic stimulation approaches, the results of the current study demonstrate that ketamine infusion or optogenetic stimulation of the infalimbic prefrontal cortex produces antidepressant behavioral and synaptic responses similar to the actions of systemic ketamine. These findings further elucidate the mechanisms underlying the therapeutic actions of ketamine and will enhance the development of safer rapid-acting and efficacious agents.
Keywords: prefrontal cortex, synapse, neural depolarization, antidepressant, glutamate
Abstract
Ketamine produces rapid and sustained antidepressant actions in depressed patients, but the precise cellular mechanisms underlying these effects have not been identified. Here we determined if modulation of neuronal activity in the infralimbic prefrontal cortex (IL-PFC) underlies the antidepressant and anxiolytic actions of ketamine. We found that neuronal inactivation of the IL-PFC completely blocked the antidepressant and anxiolytic effects of systemic ketamine in rodent models and that ketamine microinfusion into IL-PFC reproduced these behavioral actions of systemic ketamine. We also found that optogenetic stimulation of the IL-PFC produced rapid and long-lasting antidepressant and anxiolytic effects and that these effects are associated with increased number and function of spine synapses of layer V pyramidal neurons. The results demonstrate that ketamine infusions or optogenetic stimulation of IL-PFC are sufficient to produce long-lasting antidepressant behavioral and synaptic responses similar to the effects of systemic ketamine administration.
The NMDA receptor antagonist ketamine produces rapid and robust therapeutic responses in treatment-resistant (1, 2) as well as bipolar depressed patients (3). Preclinical studies report that ketamine also rapidly increases the number and function of spine synapses in the medial prefrontal cortex (mPFC) and that these effects are associated with rapid antidepressant behavioral responses in rodent models (4). These findings represent a major advance for the treatment of depression, although the widespread use of ketamine is limited by side effects (e.g., psychotomimetic and dissociative symptoms) and abuse potential. Further studies of the mechanisms underlying the actions of ketamine could lead to novel rapid antidepressant treatments with fewer side effects.
Neuroimaging studies in humans demonstrate that ketamine increases the activity of PFC (5–7), consistent with evidence of rapid increases of glutamate transmission in rodent PFC (8, 9). In addition, depressed patients are reported to have reduced activity in the PFC (10) that is normalized with treatment (11). Rodent studies also demonstrate that long-term stress causes neuronal atrophy of mPFC neurons (12, 13) that is rapidly reversed by ketamine (14). Subregions of the mPFC, including infralimbic (IL) and prelimbic (PrL), have been implicated in diverse cognitive and emotional processes, including fear learning, extinction, and anxiety (15–18). However, the role of PFC activity in the behavioral responses to ketamine has not been examined.
Here we examined the antidepressant behavioral effects of neuronal inactivation or direct infusions of ketamine into the IL-PFC and compared these effects with PrL-PFC. Using optogenetics, we also examined the antidepressant and anxiolytic effects of neuronal activation in IL-PFC and determined the impact on pyramidal cell spine number and function to assess long-term neuroplasticity.
Methods and Materials
Animals, Surgery Microinfusions, and Optical Stimulation.
Adult male Sprague–Dawley rats (Charles River Laboratories) weighing 150–250 g were pair-housed on a 12-h light/dark cycle (lights on 07:00 h) with food and water available ad libitum. All procedures were done in accordance with the NIH guidelines for the care and use of laboratory animals and the Yale University Institutional Animal Care and Use Committee. Rats were anesthetized with pentobarbital (50 mg/kg, i.p.) and implanted with bilateral guide cannula positioned 1 mm above the site of infusion in either IL [+2.8 mm AP (anteroposterior); ±3.1 mm ML (mediolateral); 3.8 mm DV (dorsoventral); angled at 30°] or PrL (+3.0 mm AP; ±0.50 mm ML; 2.8 mm DV) (12). An angled placement was used for IL. Microinfusions were performed bilaterally into IL or PrL (0.2 μL, 0.1 μL/min) 7 d after surgery. The infusion sites and volumes were based on previous reports demonstrating restricted spread and subregion-specific inactivation following muscimol infusion in the IL or PrL (19, 20). Muscimol (1.25 μg/0.2 μL per hemisphere) or vehicle were microinfused 30 min before ketamine (10 mg/kg, i.p.), a dose that produces antidepressant responses (4). Microinfusion of ketamine included 3, 10, or 30 ng/0.2 μL per hemisphere.
For optogenetic stimulation, rAAV2/CaMKIIa-ChR2(H134R)-eYFP (University of North Carolina Viral Core) or a control vector expressing GFP (rAAV2-GFP, in-house) were infused. Rats were anesthetized with ketamine (80 mg/kg) and xylazine (6 mg/kg); this anesthetic dose of ketamine does not produce antidepressant actions (4). Virus was infused (0.5 µL, 0.1 μL/min) into the IL (+3.2 mm AP; ±0.8 mm ML; 5.5 mm DV) or PrL (+3.2 mm AP; ±0.8 mm ML; 3.0 mm DV) (12), and optical fibers were placed 0.2 mm above the virus injection site and attached to the skull. For optical stimulation, rats were lightly anesthetized (isoflurane) to attach the fiberoptic, and animals with both control and active virus received blue light pulses (pulse width, 15 ms; frequency, 10 Hz; intensity, 5 mW; 473-nm laser) for 60 min (1 min on and 1 min off for 30 cycles). Stimulation settings were based on firing patterns of mPFC pyramidal neurons induced by NMDA receptor antagonism (9) and optogenetic settings necessary to reproduce this firing pattern (21).
Brain Slice Preparation, Recordings, and Spine Analysis.
Whole-cell recordings were obtained from layer V pyramidal cells in acute brain slices from rats that had been stereotaxically injected into the IL with rAAV2-ChR2-eYFP or rAAV2-GFP as previously described (14, 22). One day later, brains from stimulated rats were sectioned (400-µm-thick coronal mPFC sections). YFP+ or GFP+ pyramidal neurons in layer V were visualized by infrared differential interference contrast video microscopy using an Olympus microscope with a 60× lens and YFP filter cube. Neurobiotin (0.3%; Vector Laboratories) was added to the pipette solution to mark selected cells for later processing and imaging. Whole-cell recordings were done with an Axoclamp-2B amplifier (Molecular Devices). Postsynaptic currents were recorded in the continuous single-electrode voltage-clamp mode (3,000 Hz low-pass filter) (SI Materials and Methods). Photostimulation of the slice was performed using a 100-mW, 473-nm laser (OEM optics) driven at 10 Hz by an interval generator (pulse width, 15 ms). After completion of recording, slices were processed to visualize spines for analysis. For further details, see SI Materials and Methods. Results were expressed as spine density per 10 μm.
Behavioral Studies.
Rats were subjected to a series of depression- and anxiety-like behaviors. The forced swim test (FST) was conducted as previously described (4). Briefly, 24 h after preswim, rats received drug treatments or optogenetic stimulation and 24 h later underwent a 10-min test swim; some cases as indicated were subjected to a second test on day 17. Sessions were video recorded and data analyzed by an experimenter blinded to the treatment groups. Total immobility time during the 10-min testing period was analyzed. The novelty-suppressed feeding test (NSFT) is a measure of anxiety that is responsive to chronic administration of typical antidepressants (23) or a single dose of ketamine (4). NSFT was performed as previously described (4) with some modifications. On the test day, rats were placed in an open field (76.5 cm × 76.5 cm × 40 cm; Plexiglas) with a small amount of food in the center. Animals were allowed to explore the open field for 15 min. The latency to approach and consume (seconds) was determined after video recording. Home cage intake was measured as a control. The sucrose preference test (SPT), elevated plus maze, and ambulation tests were conducted as previously described (14).
Histology and Immunohistochemistry.
Sections of perfused brains were examined for cannula placements, and animals with incorrect placement were not included. As a measure of neuronal activation, Fos immunoreactivity was determined after microinfusions or optogenetic stimulation (SI Materials and Methods).
Statistics.
For muscimol microinfusions, two-way analysis of variance (ANOVA) was carried out (factors, microinfusion and systemic injection). For experiments containing three groups, one-way ANOVA was performed, followed by Fisher’s protected least significant difference (pLSD) post hoc test (P < 0.05). Experiments containing two groups were analyzed by independent t test.
SI Materials and Methods
Brain Slice Preparation and Whole-Cell Recordings.
Whole-cell recordings were done with an Axoclamp-2B amplifier (Molecular Devices). The output signal was low-pass filtered at 3 kHz and digitized at 15 kHz; data were acquired by pClamp 9.2/Digidata 1320 software (Molecular Devices). Series resistance, which was monitored throughout the experiment, was usually between 4 MΩ and 8 MΩ. Postsynaptic currents were recorded in the continuous single-electrode voltage-clamp mode (3,000 Hz low-pass filter) clamped near resting potential (75 mV ± 5 mV). Photostimulation of the slice was performed using a 100-mW, 473-nm laser (OEM Optics) driven at 10 Hz by an interval generator (pulse width, 15 ms). The fiber optic was placed just above the slice, submerged in the ACSF of the recording chamber.
Spine Analysis.
After completion of recording, slices were transferred to 4% (wt/vol) paraformaldehyde (0.1 mol/L phosphate buffer) and stored overnight at 4 °C. Slices were then processed with streptavidin conjugated to the fluorophore Alexa594 (1:1,000), which enabled visualization of even the most distant spines in the apical tuft. Labeled neurons within layer V of IL medial PFC were imaged with a two-photon Ti:sapphire laser scanning system (810 nanometers; Mai Tai, Spectra Physics) coupled to a direct detection Radiance 2000 BioRad laser scanner (Zeiss Micromaging) mounted on a Olympus BX50WI microscope, using a 60× (0.9 numerical aperture) water-immersion objective. For spine density analysis, z stacks usually consisted of two to five scans at high zoom at 1-μm steps in the z axis. The image capture and measurement were done blind to treatment. Spine density was sampled in apical tuft dendrites. For controls, 7–8 dendrites from two to three neurons were imaged for each animal (n = 6 animals) for control, and total imaged number was 45; n = 8 for laser-stimulated animals, and the total imaged number was 62. Under the present analysis, the average dendritic segment was 40–50 μm in length. Spine density and diameter were analyzed by automated Neuroleucida software (Autoneuron/Autospine; MBF Bioscience). Results were expressed as spine density per 10 μm.
Additional details of the methods used for spine analysis included the following: (i) For controls, 7–8 dendrites from two to three neurons were imaged for each animal (n = 6 animals) for control, and the total imaged number was 45; n = 8 for laser-stimulated animals, and the total imaged number was 62. Under the present analysis, the average dendritic segment was 40–50 μm in length. (ii) Spine analysis was performed using Neurolucida Software 10.2 (MicroBrightField); the length of the branch was traced using AutoNeuron, after which the total spine number and spine head diameter for each branch were traced using Autospine, which manually corrected any errors in spine identification. (iii) The data were loaded into NeuroExplorer software for automated measurement of spine density and spine head diameter. (iv) The image capture and measurement were done blind to treatment. (v) We used quick measure circle and quick measure line to remeasure the spine head diameter again. (vi) To ensure that the dendrite segments chosen for analysis have similar trunk diameter, which correlates well with spine density, we analyzed the diameter of the dendrite segments used for analysis and found no difference (Fig. S7).
Fig. S7.
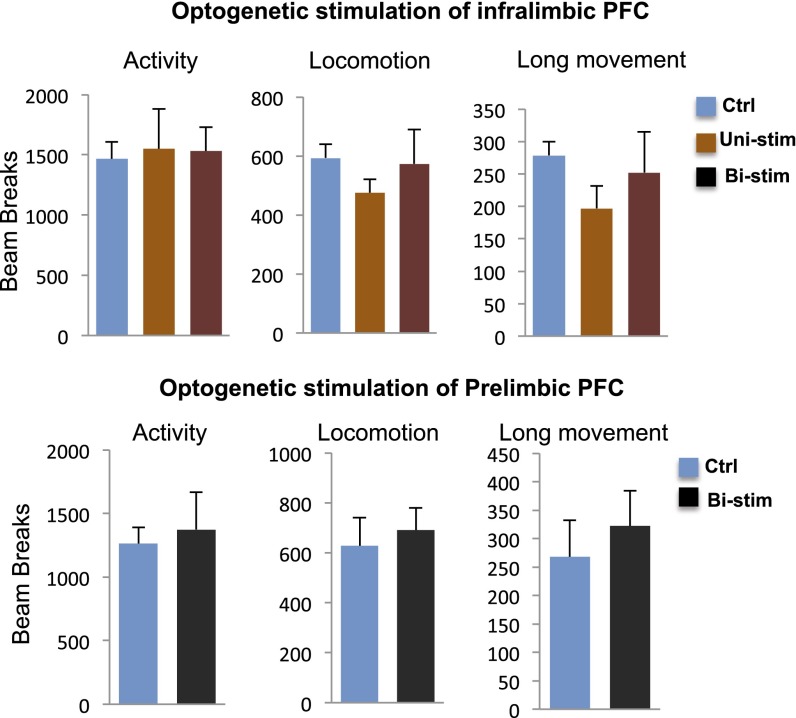
Influence of optogenetic stimulation of IL or PrL on locomotor activity. Optogenetic stimulation of pyramidal neurons in IL or PrL had no significant effect on locomotion, which was measured on day 6 after laser stimulation. The effects of optogenetic stimulation in IL (p, t20 = 0.331, P = 0.744; q, F2,21 = 0.054, P = 0.948) and in PrL (r, t6 = 0.339, P = 0.746) on the number of total beam breaks in10 min are shown.
Histology and Immunohistochemistry.
Rats were anesthetized (chloral hydrate, 250 mg/kg, i.p.) and transcardially perfused with ice-cold PBS followed by 10% (vol/vol) buffered formalin. Brains were removed and postfixed in the same fixative for 48–72 h at 4 °C and then cryoprotected in 20% (vol/vol) glycerol–0.1 M phosphate buffer for 48–72 h. Sections (40 µm) were cut using a sliding microtome. Cannula placements were verified in sections, and animals with incorrect placement were not included in the study.
For IL-PFC infusion studies, endogenous peroxidase activity was quenched for 10 min in a solution of 0.6% H2O2 in PBST (PBS + 0.1% Triton X-100), and then slices were placed in 5% (wt/vol) normal goat serum and 2% (wt/vol) BSA in PBST for 1 h. Slices were then incubated for 2 d with primary antibody (rabbit anti–c-Fos 1:20,000; Calbiochem) in 0.1% sodium azide at 4 °C. After three washes in PBST, slices were incubated with secondary antibody (1:500 biotinylated goat anti-rabbit; Vector Laboratories) for 2 h at room temperature, followed by three more washes in PBST. Slices were then incubated with avidin–biotin complex (ABC Elite Kit, Vector Laboratories) and visualized with 3–3′-diaminobenzidene. For PrL-PFC infusion studies, a similar but modified approach was used for Fos immunohistochemistry because the manufacturer stopped supplying the Fos antibody and we had to optimize conditions for a new Fos antibody (Santa Cruz Biotechnology). Briefly, endogenous peroxidase activity was quenched for 20 min in a solution of 1% H2O2 and 1% NaOH, and then slices were placed in PBST (PBS + 0.1% Triton X-100) with 5% (wt/vol) normal goat serum for 1.5 h and then incubated overnight with primary antibody (rabbit anti-c-Fos 1:500; Santa Cruz Biotechnology) and PBST at 4 °C. After three washes in PBS, slices were incubated with secondary antibody (1:500 biotinylated goat anti-rabbit, Vector Laboratories) in PBST for 2 h at room temperature, followed by three more washes in PBS. Slices were then incubated with avidin–biotin complex (ABC Elite Kit, Vector Laboratories) and visualized with 3–3′-diaminobenzidene.
Sections were collected at ∼3.2 mm anterior to bregma (12). The boundaries of each area for counting were manually drawn and were held constant between sections. Tissue was visualized using a fluorescent microscope (Zeiss) using standard FITC and TRITC filters, and c-Fos expression was determined using image analysis software (ImageJ 1.35, National Institute of Mental Health); the mean pixel value and SD of background staining were calculated. A threshold function was used to make the image field binary. The mean background pixel values of all sections were within 2–3 SD, so the threshold was set as 4 SDs above the mean of background, so that only cells that were stained brightly were counted. These parameters produced a close agreement between manual and computer-counted c-Fos–positive cells in the PFC. Mean number of positive cells in each hemisphere of each animal was counted automatically from four coronal sections. Data are expressed as mean positive cells per 0.1 mm2.
Quantification of c-Fos–Positive Cells.
We collected 40-μm sections at ∼3.0 mm anterior to bregma. Tissue was visualized using a brightfield microscope (Zeiss). The boundaries of each area for counting were manually drawn and were held constant between sections. Darkly stained cells were counted manually in 10× magnification images from four coronal sections per animal. To achieve a consistent standard for counting throughout each image, image analysis software (ImageJ 1.35, National Institute of Mental Health) was then used to make the image field binary, and a threshold function was used to visualize and count all cells with a density equal to or greater than the manually counted cells. The counted cells were then checked against the original image to ensure that there were no extraneous counts. Data are expressed as mean positive cells per 10× field.
Results
Neuronal Inactivation of IL-PFC Blocks the Effects of Systemic Ketamine.
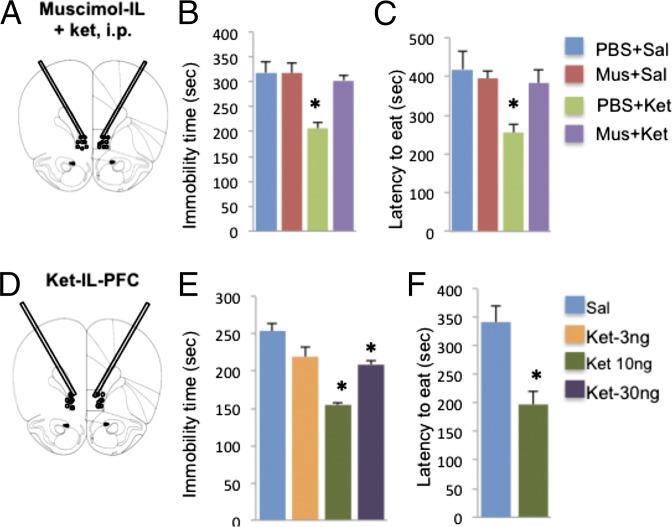
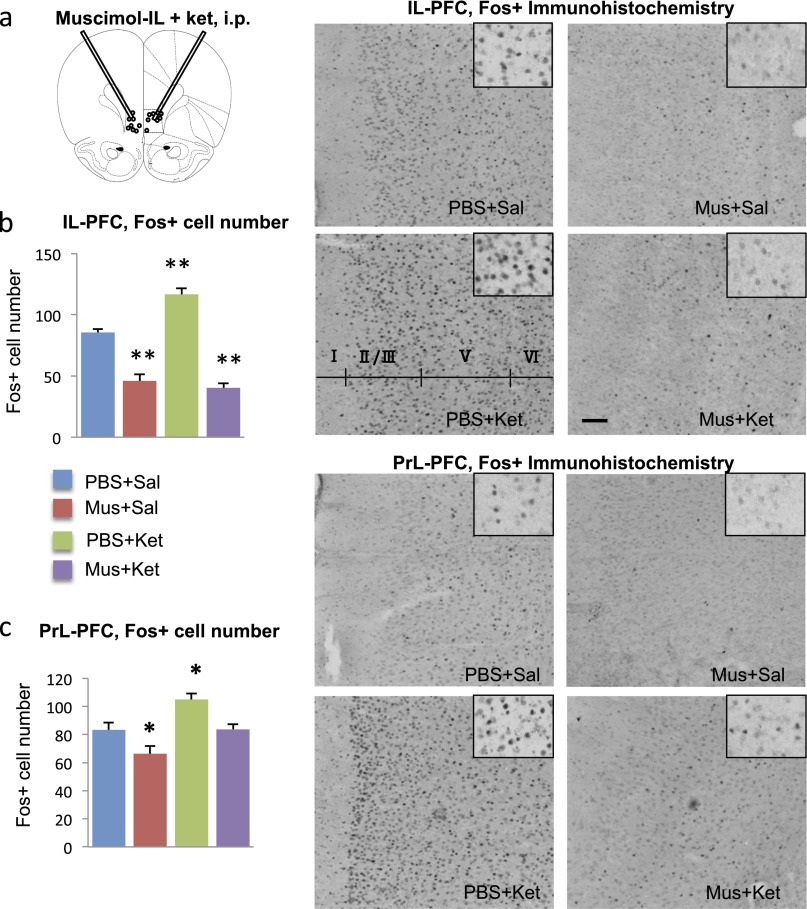
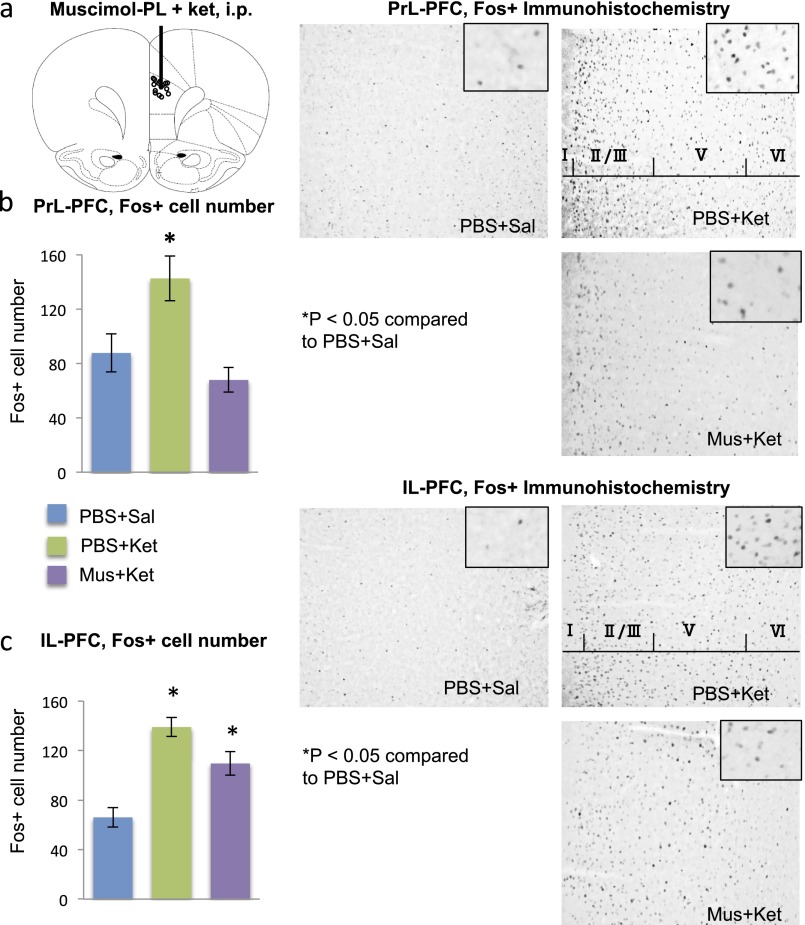
For neuronal silencing, a GABA receptor agonist, muscimol, was infused into IL before systemic injection of ketamine. IL microinfusions were angled to avoid damaging the overlying PrL (Fig. 1). The dose and route of muscimol are based on previous studies of IL as well as PrL in fear extinction (19, 20). Studies to verify neuronal silencing demonstrated that muscimol preinfusion significantly decreases ketamine (i.p.) induction of Fos+ immunolabeling in the IL (Fig. S1). Induction of Fos in the adjacent PrL is also blocked by infusion of muscimol into the IL-PFC, possibly due to silencing of neurons with axon collaterals from IL to PrL.
Fig. 1.
IL-PFC stimulation is necessary and sufficient for the antidepressant behavioral actions of ketamine. (A–C) Neuronal silencing by muscimol infusion (1.25 µg per side) into the IL blocks the effects of ketamine (10 mg/kg, i.p.) in the FST (B) and NSFT (C). Immobility times in the FST or the latency to eat in NSFT are shown as the mean ± SEM (n = 4–10 per group). *P < 0.05, compared with PBS + Sal; analysis of variance (two-way or one-way ANOVA with LSD post hoc test). (D–F) Ketamine microinfusions into the IL produce an antidepressant response in the FST (E) and an anxiolytic effect in the NSFT (F). Doses of 10 and 30 ng per side produced a significant response in the FST, and the 10-ng dose was used for subsequent studies in the NSFT. Means are derived from 4–8 rats per group. *P < 0.05, compared with PBS; analysis of variance (one-way ANOVA with LSD post hoc test) or independent t test (C, E, and F). Ket, ketamine; Mus, muscimol; Sal, saline.
Fig. S1.
Muscimol infusions into the IL block the induction of Fos+ cell labeling by systemic ketamine administration. (A) Location of microinfusion. (B and C) Influence of muscimol preinfusion (30 min) on ketamine induction of Fos+ labeling in the (B) IL-PFC and (C) PrL-PFC, determined 1 h after ketamine administration. Right panels show representative Fos+ immunolabeling in the IL under the indicated conditions. *P < 0.05, compared with PBS + Sal; analysis of variance (two-way ANOVA with LSD post hoc test). Ket, ketamine; Mus, muscimol; Sal, saline.
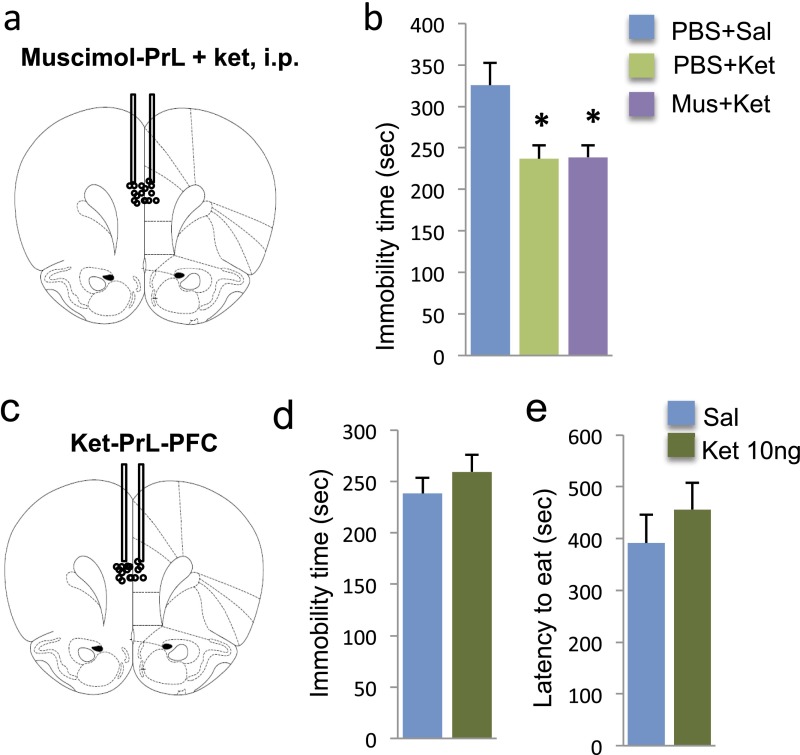
To determine the influence of neuronal silencing on behavioral responses, muscimol was infused into IL 1 h before systemic ketamine administration, and behavior was assessed 24 h after dosing to avoid the acute effects of drug treatments (Fig. 1 A–C). The results demonstrate that muscimol infusion into the IL completely blocks the antidepressant effect of ketamine in the FST (Fig. 1D) (interaction, F1,33 = 7.50, P < 0.05). Muscimol infusions into the IL of saline-injected rats had no significant effect on behavior at the time of testing (24 h after infusions) (Fig. 1B) (P = 0.994). There were no significant effects of muscimol microinfusions into IL on locomotor activity in saline or ketamine-treated rats (determined at the same time as behavioral tests, 24 h after drug treatment) (ANOVA, F2,15 = 0.578, P = 0.575) (Fig. S2). In addition, infusion of muscimol into PrL before ketamine had no effect on the response to systemic ketamine in the FST even though it blocked the induction of Fos in PrL; there was no effect on Fos induction in IL (Figs. S3B and S4).
Fig. S2.

Influence of muscimol microinfusions and systemic ketamine administration on locomotor activity. Muscimol microinfusions into IL in the absence or presence of systemic ketamine administration had no effect on locomotor activity. Activity measures were determined 24 h after muscimol and ketamine infusions, the same time point used for analysis of FST and NSFT. Results are the mean ± SEM of controls.
Fig. S3.
Influence of ketamine and muscimol infusions into the Prl on immobility in the FST. (A) Location of muscimol microinfusion into PrL. (B) Muscimol infusion into the PrL had no effect on the antidepressant actions of ketamine in the FST. (C) Microinfusions of ketamine (10 ng per side) into the PrL had no effect on immobility in the FST (D) or latency to feed in the NSFT (E). Immobility times in the FST or latency to feed in NSFT are shown as the mean ± SEM (n = 4–10 per group). *P < 0.05, compared with PBS; analysis of variance (one-way ANOVA with LSD post hoc test, B) or independent t test (D and E). Ket, ketamine; Mus, muscimol; Sal, saline.
Fig. S4.
Muscimol infusion into the PrL blocks the induction of Fos+ cell labeling by systemic ketamine administration. (A) Location of microinfusion. (B and C) Influence of muscimol preinfusion (30 min) on ketamine induction of Fos+ labeling in the (B) PrL-PFC and (C) IL-PFC, determined 1 h after ketamine administration. Right panels show representative Fos+ immunolabeling in the PrL and IL under the indicated conditions. *P < 0.05, compared with PBS + Sal; analysis of variance (one-way ANOVA with LSD post hoc test). Ket, ketamine; Mus, muscimol; Sal, saline.
The effect of muscimol infusions on NSFT, a measure of anxiety, was also examined. The latency to feed in a novel environment is decreased by a single dose of ketamine (4) but requires chronic administration of a typical antidepressant (23). Preinfusion of muscimol into the IL completely blocked the effects of ketamine on the latency to feed in the NSFT (interaction, F1,27 = 3.93, P < 0.05; Fig. 1C) but had no effect in saline-treated animals.
To further examine the role of IL in the actions of ketamine, the effects of different microinfusion doses (3, 10, and 30 ng, bilateral) were examined. These doses were based on the concentration of ketamine in the brain after systemic injection (24) and the dose required to produce antidepressant responses (4). Ketamine microinfusions into IL produced significant dose-dependent antidepressant effects in the FST (Fig. 1E) (ANOVA, F3,16 = 25.690, P < 0.01; LSD post hoc analysis P < 0.01 for 10 ng and P < 0.05 for 30 ng compared with PBS). The dose–response appears to be an inverted U-shaped curve, similar to the antidepressant behavioral actions of systemic ketamine (4). In the NSFT, microinfusion of ketamine (10 ng) into the IL significantly reduced the latency to feed (t15 = 3.94, P < 0.01; Fig. 1F). In contrast, microinfusion of ketamine (10 ng) into PrL had no effect on behavior in either the FST (P = 0.381) or latency to feed in the NSFT (P = 0.410) (Fig. S3 D and E).
In Vitro Characterization of IL Neuronal Optical Stimulation.
The requirement for neuronal activation is consistent with reports that ketamine increases extracellular glutamate in the mPFC (8). To directly test if neuronal depolarization of IL produces antidepressant effects, we used an optogenetic approach. For ChR2-induced depolarization of neurons, we infused rAAV2/CaMKIIα-ChR2(H134R)-eYFP, which responds to blue laser stimulation or control vector (rAAV2-GFP). In vitro brain slice electrophysiology studies were conducted to verify the function of ChR2-eYFP. At the completion of recording, neurobiotin-labeled cells were stained with streptavidin Alexa594 (red fluorescence); the merged ChR2-eYFP + Alexa594 images appear as yellow (Fig. 2A). Patch-clamp recording shows that blue laser stimulation (15 ms pulse width, 10 Hz) consistently produced action potentials triggered by ChR2-induced depolarization (Fig. 2C) similar to those induced physiologically in the same cell by a depolarizing pulse (Fig. 2B). Voltage-clamp recording in the same cell (Fig. 2D) shows the magnitude of ChR2 currents.
Fig. 2.
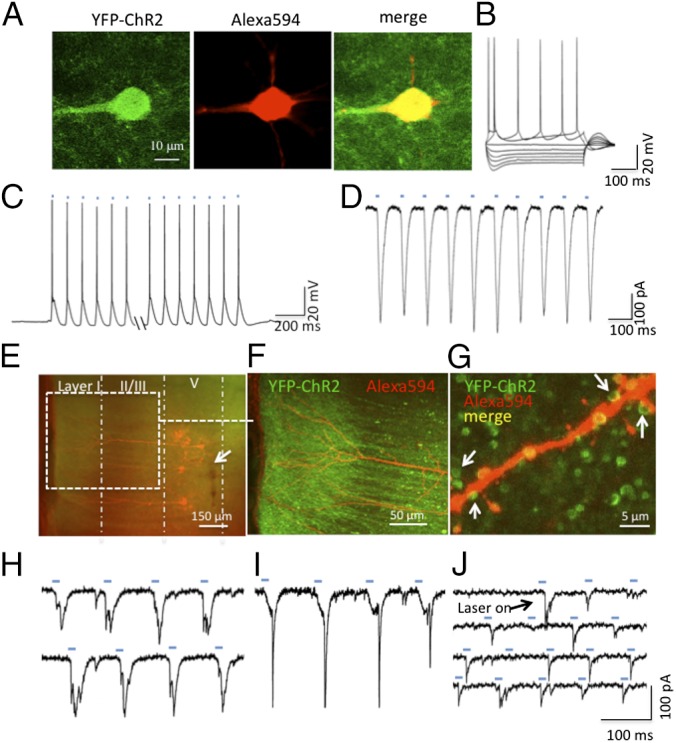
Electrophysiological validation of ChR2 activity in IL layer V pyramidal cells. (A) Two-photon image of a recorded ChR2-eYFP–expressing cell in layer V of IL (green fluorescence, Left), colabeling with neurobiotin/strepavidin-Alexa594 (red fluorescence, Middle), and merged image showing double labeling (Right). (B) Spikes induced in this cell by depolarizing pulses. (C) Whole-cell recordings showing spikes or (D) ChR2 slow-wave currents induced in this cell by laser pulses (15 ms, 10 Hz, marked by blue dashes). (E) A low-magnification (5×) fluorescence image in a PFC slice expressing ChR2-eYFP in the IL; a cloud of green fluorescence can be seen both in in the layer I (apical tuft) and in the layer V (cell body) region. Recorded cells are indicated by the presence of Alexa594-labeled cells; arrow shows track of injection needle. (F) Confocal image (20×) of the apical shaft and apical tuft of double-labeled recorded cells (expanded from area within white box in E). (G) High-magnification (100×) merged image shows punctate green ChR2-eYFP fluorescence surrounding an apical branch of a double-labeled recorded cell; arrows show green punctate labeling in close proximity to neurobiotin/Alexa594-labeled spines; these may represent collateral synaptic connections with nearby unlabeled cells. (H and I) Traces showing laser-induced EPSCs that are evoked in cells with discernable ChR2 slow-wave currents. (J) Example of a cell that does not have detectable ChR2 currents but in which laser stimulation evokes EPSCs; note the variable frequency and amplitude of EPSCs by light pulses (blue dashes). The EPSCs may be generated through axon collaterals of neighboring cells that do express ChR2-eYFP.
The placement of the viral injection cannula in deep layer V is shown in Fig. 2E (arrow) (also see Fig. 3A and Fig. S5 for viral spread). A zone of ChR2-eYFP signal (green) can also be seen in layer I surrounding the apical tuft dendrites of the recorded cells (Fig. 2F), indicating export of ChR2-eYFP to the distal dendrites, which is enhanced as a result of the export signal included in the viral ChR2-eYFP construct. A high-magnification merged confocal image (Fig. 2G) illustrates representative images of green punctate fluorescence in close proximity to an apical dendritic branch of one of the recorded cells. Whole-cell recordings show that blue light stimulation (15 ms, 10 Hz lasting 20 s) can evoke EPSCs that overlap with but are distinct from the ChR2-eYFP slow wave currents that are induced in response to the blue light pulses (Fig. 2 H and I). Interestingly, EPSCs of variable amplitude were also observed in cells that lack detectable ChR2 currents (Fig. 2J). These experiments indicate that laser stimulation can affect cells not only directly through activation of ChR2 but also via axon collaterals within the zone of ChR2-eYFP expression.
Fig. 3.
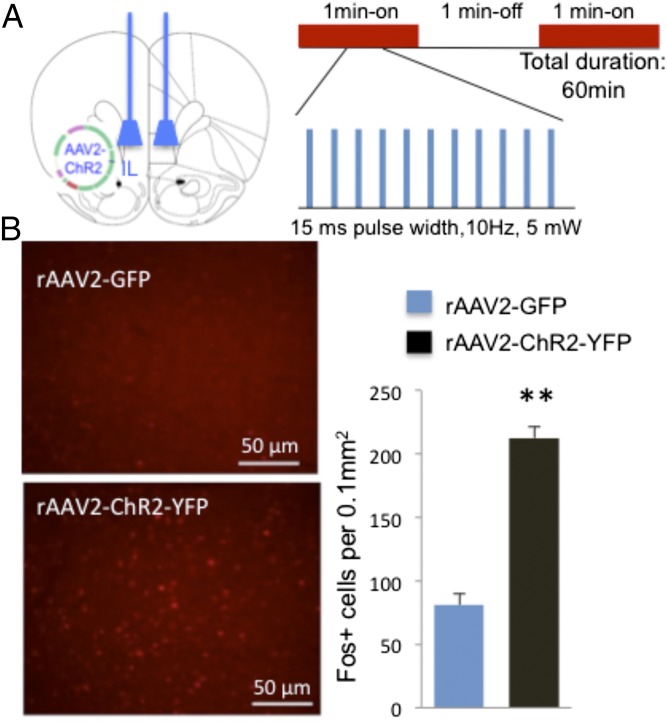
Optogenetic stimulation of IL and induction of Fos+ labeling. Control (rAAV2-GFP) or active (rAAV2-ChR2-eYFP) viral vectors were infused into the IL-PFC, and 2 wk were allowed for viral infection. (A) Location of viral infusions and conditions for in vivo optogenetic stimulation of IL. Both rAAV2-GFP and rAAV2-ChR2-eYFP animals received laser stimulation. (B) Influence of laser stimulation on Fos+ cell labeling. Representative images of Fos+ expression after photostimulation of IL in rAAV2-ChR2-eYFP and rAAV2-GFP control animals (×20). (Scale bar, 50 μm.) Optical stimulation in IL significantly increased the number of Fos+ cells in IL (t16 = 9.760, P < 0.01).
Fig. S5.
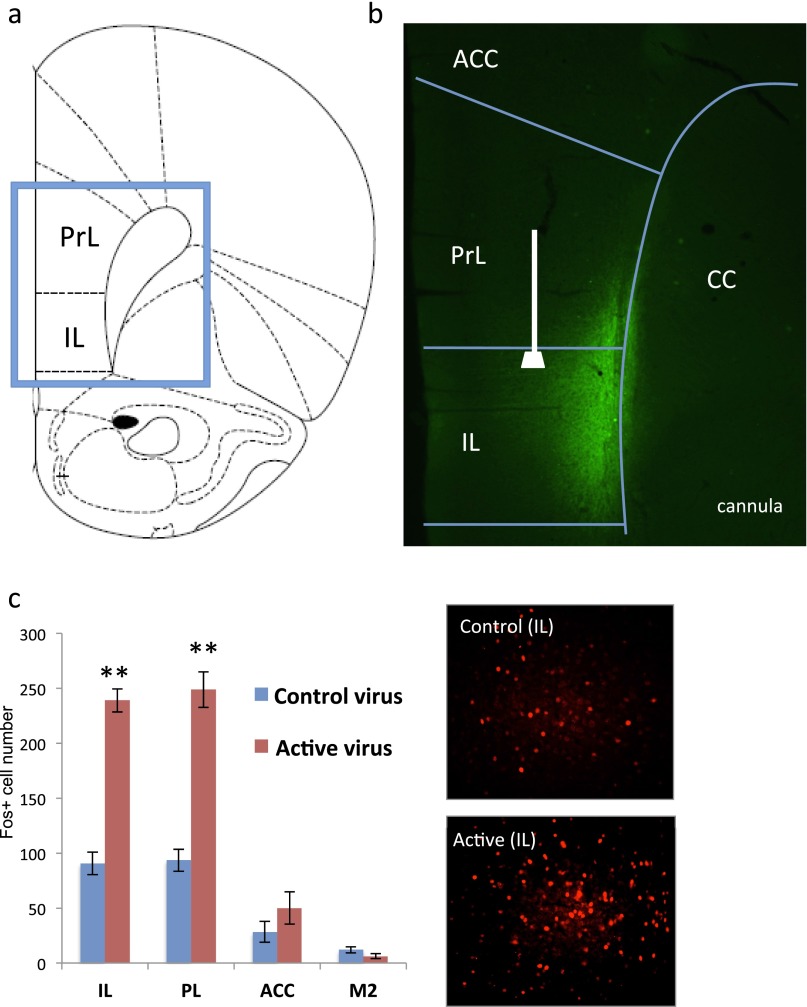
Influence of optogenetic stimulation of IL-PFC on Fos+ cell labeling in the subregions of medial PFC. (A) Map of IL and PrL in the medial PFC of rat. (B and C) Expression of active virus (rAAV2-ChR2-eYFP) in deep layers of IL and location of optic fiber. (C) Stimulation of IL in rats infused with either control virus (rAAV-GFP) or active virus (rAAV2-ChR2-eYFP) (20 min, 10 Hz, 15 ms pulse width; 1 min on and 1 min off) increases the density of Fos+ cells in the IL as well as the PrL. (Inset) High-magnification (20×) view of Fos immunolabeling in IL. **P < 0.05 compared with control virus by two-tailed t test. ACC, anterior cingulate; CC, corpus callosum; IL, infralimbic; PrL, prelimbic.
Optogenetic Stimulation of IL-PFC Produces Antidepressant Behavioral Effects.
The effects of in vivo optogenetic stimulation on Fos and antidepressant behavior were examined using laser settings chosen to mimic the effects of systemic ketamine on mPFC pyramidal neuron firing (Fig. 3A) (9, 21). Control (rAAV2-GFP) or active (rAAV2-ChR2-eYFP) viruses were infused into the IL as described above, and after recovery a blue light (pulse width, 15 ms; frequency, 10 Hz; intensity, 5 mW) was directed at IL (both control and active virus infused; see Fig. S5B for optic fiber location and viral spread). Initial studies examined Fos immunolabeling as a marker of neuronal activity and demonstrate that optogenetic stimulation increases the number of Fos+ cells in IL by ∼threefold compared with rats infused with control virus, indicating significant induction of neuronal activation (Fig. 3B and Fig. S5C). Optogenetic stimulation of IL produced a similar induction of Fos+ cells in PrL, presumably because of axonal projections from IL to this region (Fig. S5C).
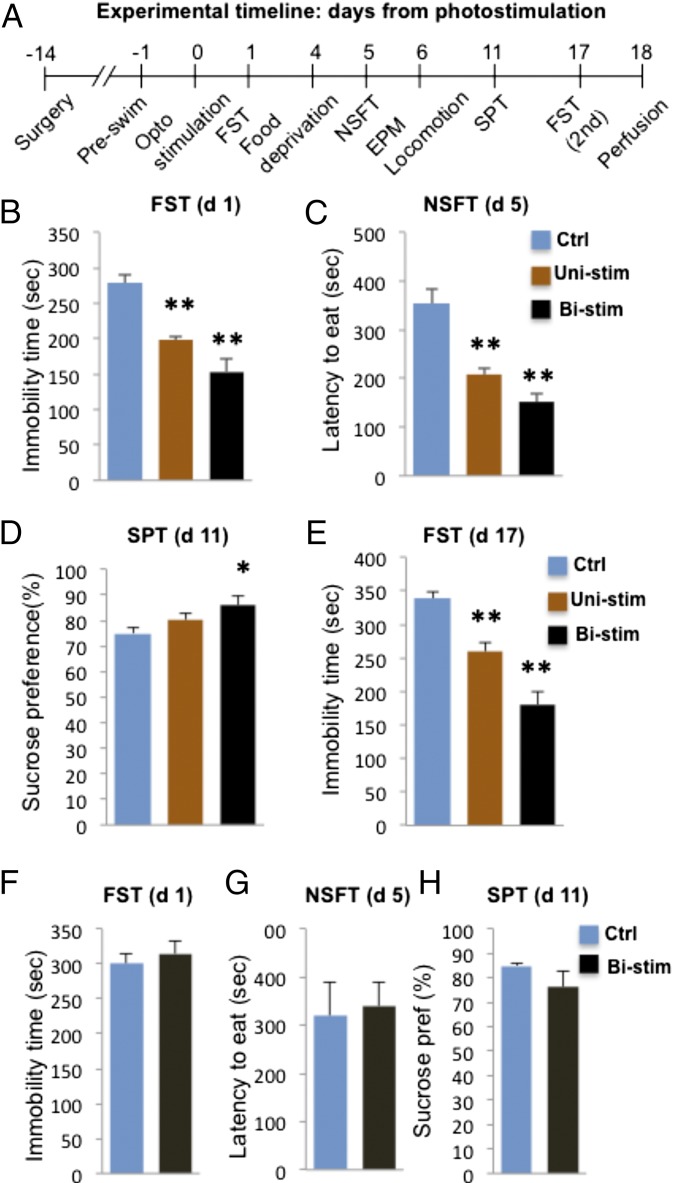
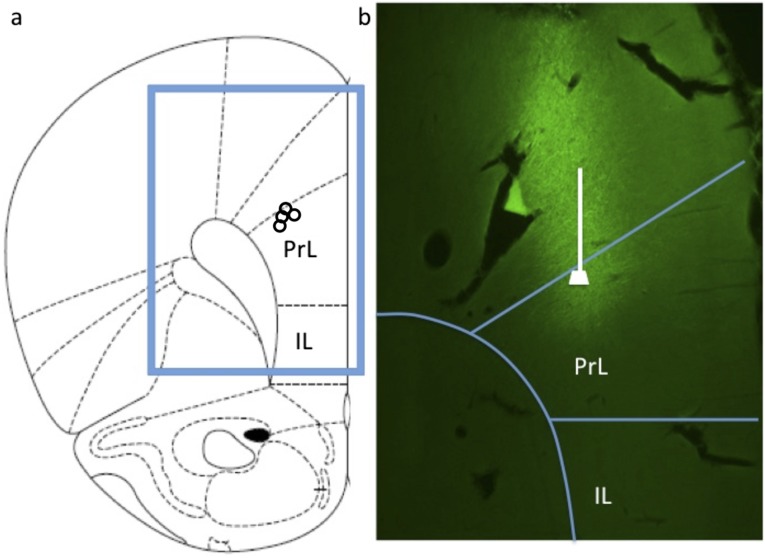
Using the same conditions, the behavioral effects of IL optical stimulation (active vs. control virus, both receiving blue light pulse; unilateral or bilateral as indicated) were determined (see Fig. 4A for sequence of tests). The results demonstrate that optogenetic stimulation of IL-PFC, either unilateral (Uni) or bilateral (Bi), produces rapid, robust, and long-lasting antidepressant effects in the FST (Fig. 4B) and anxiolytic effects in the NSFT (Fig. 4C). We also found that optical stimulation of IL-PFC (bilateral but not unilateral) resulted in a small but significant increase in the SPT (Fig. 4D), a measure of anhedonia and a core symptom of depression (25). Typically antidepressants reverse the deficits in SPT caused by chronic stress, and the response to optogenetic stimulation could reflect a reversal of surgical stress-induced deficits. In contrast, optogenetic stimulation of PrL had no significant effects on any of these behaviors (Fig. 4 F–H). As can be seen in Fig. S6, the viral infusion and optic fiber were targeted to the dorsal aspect of PrL to avoid activation of the underlying IL-PFC, and further studies will be required to determine if more complete activation of the PrL influences antidepressant responses. Optical stimulation of IL or PrL also had no effect on locomotor activity (Fig. S7).
Fig. 4.
Photostimulation of IL-PFC produces antidepressant and anxiolytic behavioral responses. (A) Timeline for behavioral testing, starting 1 d after laser stimulation. Both rAAV2-GFP and rAAV2-ChR2-eYFP animals received laser stimulation, with the rAAV-GFP serving as controls. Experiments included animals receiving either unilateral (Uni-stim) or bilateral (Bistim) optical stimulation. The results demonstrate that both uni- and bistim of rats infused with rAAV2-ChR2-eYFP produced an antidepressant effect in the FST (B) (F2,20 = 21.229, P < 0.01) and an anxiolytic effect in the NSFT (C) (F2,17 = 14.619, P < 0.01) compared with animals receiving rAAV2-GFP control virus and blue light stimulation. Optical stimulation of IL also produced a significant effect in the SPT (D), although only in animals receiving bilateral stimulation (F2,21 = 3.935, P = 0.037). The antidepressant effect of IL optical stimulation in the FST was still present 17 d after the stimulation (E); at this time point, the effect was more robust in the animals receiving bilateral stimulation (F2,20 = 35.313, P < 0.01). (F–H) In contrast to IL, bilateral stimulation of PrL had no significant effect in the FST (F) (t6 = 0.594, P = 0.574), NSFT (G) (t6 = 0.226, P = 0.829), or SPT (H) (t6 = 1.302, P = 0.241). Data are the mean ± SEM (n = 4–11 per group). *P < 0.05, **P < 0.01 compared with control animals; analysis of variance (one-way ANOVA with LSD post hoc test) or independent t test.
Fig. S6.
Location of rAAV2-ChR2-eYFP infusion into PrL. (A) Map of PrL and IL in the medial PFC of rat. (B) rAAV2-ChR2-eYFP was infused into the deep layers of the PrL-PFC, and levels of eYFP expression were determined after 3 wk to allow for virus expression. Infusions were made into the dorsal PrL to avoid infection of the underlying IL-PFC.
NSFT and SPT were conducted 5 and 11 d after optogenetic stimulation, respectively, demonstrating relatively long-lasting antidepressant behavioral responses. This was confirmed with sustained antidepressant effects in the FST conducted 17 d after either unilateral or bilateral stimulation (Fig. 4E). These results demonstrate that a single course of optogenetic stimulation of neurons in IL-PFC induces rapid antidepressant and anxiolytic effects that are long lasting.
Optogenetic Stimulation of IL-PFC in Vivo Increases in Spine Number and Function.
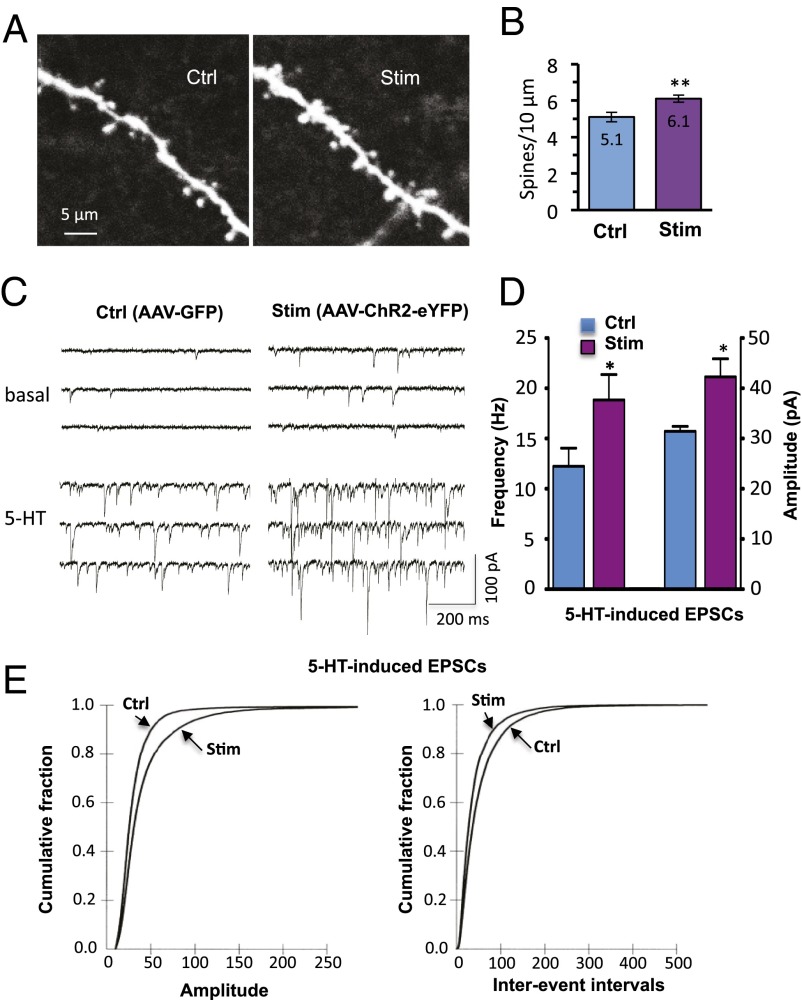
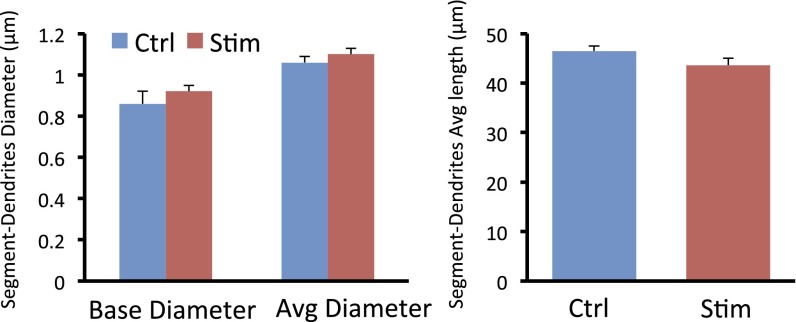
Systemic ketamine produces a rapid increase in the number and function of spine synapses in mPFC layer V pyramidal neurons (4). Here we show that optogenetic stimulation of IL also increases spine density 24 h after photo activation (Fig. 5 A and B); densities are 5.1 ± 0.27 and 6.1 ± 0.19 per 10 μm for control (rAAV2-GFP) and active virus (rAAV2-ChR2-eYFP), respectively (P < 0.05) (Fig. 5B). There were no differences in the diameter or length of dendrite segments from control and stimulated neurons (Fig. S8).
Fig. 5.
Optogenetic stimulation in vivo increases the number and function of spine synapses in IL-PFC pyramidal neurons. (A) Two-photon confocal z-stack projections of apical tuft dendritic segments of layer V pyramidal cells taken from rAAV2-GFP control virus or rAAV2-ChR2-eYFP–infused animals, both receiving in vivo light stimulation. (Scale bar, 10 μm.) (B) Spine density analysis; the results are the mean ± SEM (45 images from 11 cells from 5 rats for control; 66 images from 15 cells from 5 rats for stimulated; **P < 0.01; Student t test). (C) Examples of layer V pyramidal cell recording traces taken from control or stimulated animals; note the marked 5-HT–induced EPSCs in the cell taken from the stimulated animal. (D) Summary data showing both increased frequency (12.2 ± 1.8 and 18.8 ± 2.5 Hz, control and stimulated, respectively; P < 0.05) and amplitude (31.4 ± 1 and 42.3 ± 3.5 pA, respectively; P < 0.05) of 5-HT–induced EPSCs (*P < 0.05; Student t test; n = 15 neurons). (E) Cumulative probability distributions showing significant increases in amplitude (Kolmogorov–Smirnov two-sample test; P < 0.0000; z value = 12.9) and frequency (Kolmogorov–Smirnov two-sample test; P < 0.0000; z value = 10.9) of 5-HT–induced EPSCs (n = 15 neurons per group).
Fig. S8.
Characteristics of dendrite segments used for analysis of spine morphology. Analysis of spine diameter was conducted using Neurolucida 10.21 and Neurolucida Explorer. Shown are the base and average diameters, as well as length, of dendrite segments, none of which were not significantly different between control virus (rAAV2-GFP) or active virus (rAAV2-ChR2-eYFP), both of which received laser stimulation. The number of segments analyzed was 45 and 66 for control and stimulated, respectively.
Synaptic function of layer V pyramidal cells was assessed by analysis of 5-HT–induced EPSC responses that are highly correlated with spine density and diameter in the apical tuft (22). We found that both the frequency and amplitude of 5-HT–induced EPSCs in layer V pyramidal cells were significantly increased in response to optogenetic stimulation of IL-PFC (rAAV2-ChR2-eYFP) compared with control (rAAV-GFP) (P < 0.05; Fig. 5 C and D). Significant increases in frequency and amplitude are also shown in cumulative probability distribution curves (Fig. 5E). In rAAV2-ChR2-eYFP–infused animals, increases in EPSCs did not differ between ChR2-eYFP+ and ChR2-eYPF-negative cells, suggesting that synaptic up-regulation occurs both through direct excitation of cells expressing ChR2-eYFP and through collateral excitation of ChR2-eYFP-negative cells mediated by local network activation.
Discussion
The results demonstrate that neuronal silencing of IL-PFC blocks the actions of ketamine and that IL-PFC infusion is sufficient for the antidepressant-like effects of ketamine. These findings, combined with up-regulation of the activity marker Fos, indicate that neuronal activity is required for the behavioral actions of ketamine, consistent with evidence of increased extracellular glutamate in the PFC (8). Conversely, the neuronal silencing agent muscimol inhibits the behavioral actions of ketamine, indicating that NMDA receptor blockade at rest is insufficient to produce antidepressant responses, although there are other views (26, 27). A role for neuronal activity is further supported by our results demonstrating that in vivo optogenetic stimulation of IL results in rapid and sustained antidepressant behavioral responses that are associated with increased number and function of spine synapses of layer V pyramidal neurons, similar to the actions of ketamine (4, 14, 28).
Brain slice experiments confirmed that laser stimulation was sufficient to induce spiking in IL-PFC layer V pyramidal neurons that express ChR2-eYFP, as well as adjacent cells, presumably via axon collaterals. This is supported by studies demonstrating that optogenetic stimulation of IL-PFC increases Fos+ cell staining in PrL as well as IL. Similarly, the increase in EPSCs induced by 5-HT in brain slices taken 1 d after in vivo laser stimulation was independent of whether or not a particular recorded cell expressed ChR2. These results are consistent with the idea that pyramidal neurons are embedded in complex, recurrent microcircuits (29–31) and that optogenetic activation of a core group of cells produces broader changes in network function that could underlie the observed behavioral responses.
Optogenetic stimulation of the PFC or target regions receiving ChR2 terminals from PFC neurons is reported to produce antidepressant behavioral responses but only during the stimulation period (32–35). The current study was designed to determine if stimulation of glutamatergic neurons in mPFC could lead to rapid and sustained synaptogenic and behavioral responses similar to the effects of systemic ketamine. The results are consistent with this hypothesis, demonstrating that IL-PFC photostimulation results in rapid and sustained antidepressant and anxiolytic behavioral responses and increased number and function of spine synapses of layer V pyramidal neurons.
There are several target regions and circuits that could contribute to the actions of ketamine infusion or optogenetic stimulation of IL-PFC. Connections between IL-PFC and amygdala have been implicated in fear memory, extinction, and anxiety and could thereby contribute to the behavioral responses observed in the present study (36, 37). In addition, previous studies demonstrate that mPFC connections with the dorsal raphe or mesolimbic dopamine system, including the nucleus accumbens, could contribute to the antidepressant responses to ketamine and optogenetic stimulation (32, 35, 38, 39). One report has demonstrated that optogenetic stimulation of mPFC terminal fields can produce either antidepressant (dorsal raphe) or prodepressive (lateral habenula) responses, although behavior was examined during photostimulation and did not distinguish between IL and PrL subregions (35). Nevertheless, these results demonstrate the functional complexity of mPFC circuitry in depression and antidepressant responses. Future studies will be needed to examine the interaction of IL-PFC projection neurons with these potential target brain regions to characterize the neuronal circuitry underlying the persistent antidepressant actions of ketamine and optical stimulation. It is also possible that other behavioral actions of ketamine—notably the beneficial neurocognitive effects (40, 41)—are mediated by other cortical regions, such as the anterior cingulate, that warrant investigation.
The results also raise several issues. First, we found that muscimol alone had no effect on behavior, in contrast to a previous report showing that IL-PFC muscimol reduced immobility (42). This difference is likely due to the time point for behavioral analysis: 24 h in the current study versus immediately after muscimol in the previous report. Second, we used unstressed animals, and further studies using chronic stress or social defeat models are needed. Third, we find that optogenetic stimulation of IL-PFC neurons is effective, whereas a previous study shows that electrical stimulation of IL-PFC produces antidepressant actions even when neurons are chemically ablated, suggesting a role for activation of fibers of passage (43). Fourth, an anesthestic dose of ketamine has no effect on antidepressant behaviors and was used for surgeries (4), so studies will be needed to test if prior exposure to high doses of ketamine impact subsequent optogenetic responses.
The results of the current study contribute to a further understanding of the cellular mechanisms underlying the actions of ketamine, but the initial targets and actions by which ketamine produces a burst of glutamate that triggers rapid synaptic and behavioral responses remain unclear. Current approaches using cell-specific techniques to knockdown NMDA receptor subtypes on different populations of glutamate and GABA neurons in the PFC are being conducted to address this question. These experiments combined with studies of circuitry, will elucidate the cellular mechanisms underlying the actions of ketamine and could provide novel targets for safer antidepressant medications.
Supplementary Material
Acknowledgments
We thank Dr. Neil Fournier for assistance with microinfusion surgeries. This work is supported by National Institute of Mental Health (NIMH) Grants R37MH45481 and R01MH93897 (to R.S.D.), the State of Connecticut, and Yale University.
Footnotes
The authors declare no conflict of interest.
This article is a PNAS Direct Submission.
This article contains supporting information online at www.pnas.org/lookup/suppl/doi:10.1073/pnas.1414728112/-/DCSupplemental.
References
- 1.Berman RM, et al. Antidepressant effects of ketamine in depressed patients. Biol Psychiatry. 2000;47(4):351–354. doi: 10.1016/s0006-3223(99)00230-9. [DOI] [PubMed] [Google Scholar]
- 2.Zarate CA, Jr, et al. A randomized trial of an N-methyl-D-aspartate antagonist in treatment-resistant major depression. Arch Gen Psychiatry. 2006;63(8):856–864. doi: 10.1001/archpsyc.63.8.856. [DOI] [PubMed] [Google Scholar]
- 3.Diazgranados N, et al. A randomized add-on trial of an N-methyl-D-aspartate antagonist in treatment-resistant bipolar depression. Arch Gen Psychiatry. 2010;67(8):793–802. doi: 10.1001/archgenpsychiatry.2010.90. [DOI] [PMC free article] [PubMed] [Google Scholar]
- 4.Li N, et al. mTOR-dependent synapse formation underlies the rapid antidepressant effects of NMDA antagonists. Science. 2010;329(5994):959–964. doi: 10.1126/science.1190287. [DOI] [PMC free article] [PubMed] [Google Scholar]
- 5.Långsjö JW, et al. Effects of subanesthetic doses of ketamine on regional cerebral blood flow, oxygen consumption, and blood volume in humans. Anesthesiology. 2003;99(3):614–623. doi: 10.1097/00000542-200309000-00016. [DOI] [PubMed] [Google Scholar]
- 6.Långsjö JW, et al. Effects of subanesthetic ketamine on regional cerebral glucose metabolism in humans. Anesthesiology. 2004;100(5):1065–1071. doi: 10.1097/00000542-200405000-00006. [DOI] [PubMed] [Google Scholar]
- 7.Holcomb HH, Lahti AC, Medoff DR, Cullen T, Tamminga CA. Effects of noncompetitive NMDA receptor blockade on anterior cingulate cerebral blood flow in volunteers with schizophrenia. Neuropsychopharmacology. 2005;30(12):2275–2282. doi: 10.1038/sj.npp.1300824. [DOI] [PubMed] [Google Scholar]
- 8.Moghaddam B, Adams B, Verma A, Daly D. Activation of glutamatergic neurotransmission by ketamine: A novel step in the pathway from NMDA receptor blockade to dopaminergic and cognitive disruptions associated with the prefrontal cortex. J Neurosci. 1997;17(8):2921–2927. doi: 10.1523/JNEUROSCI.17-08-02921.1997. [DOI] [PMC free article] [PubMed] [Google Scholar]
- 9.Homayoun H, Moghaddam B. NMDA receptor hypofunction produces opposite effects on prefrontal cortex interneurons and pyramidal neurons. J Neurosci. 2007;27(43):11496–11500. doi: 10.1523/JNEUROSCI.2213-07.2007. [DOI] [PMC free article] [PubMed] [Google Scholar]
- 10.Price JL, Drevets WC. Neurocircuitry of mood disorders. Neuropsychopharmacology. 2010;35(1):192–216. doi: 10.1038/npp.2009.104. [DOI] [PMC free article] [PubMed] [Google Scholar]
- 11.Murrough JW. Ketamine as a novel antidepressant: From synapse to behavior. Clin Pharmacol Ther. 2012;91(2):303–309. doi: 10.1038/clpt.2011.244. [DOI] [PMC free article] [PubMed] [Google Scholar]
- 12.Bessa JM, et al. The mood-improving actions of antidepressants do not depend on neurogenesis but are associated with neuronal remodeling. Mol Psychiatry. 2009;14(8):764–773, 739. doi: 10.1038/mp.2008.119. [DOI] [PubMed] [Google Scholar]
- 13.Izquierdo A, Wellman CL, Holmes A. Brief uncontrollable stress causes dendritic retraction in infralimbic cortex and resistance to fear extinction in mice. J Neurosci. 2006;26(21):5733–5738. doi: 10.1523/JNEUROSCI.0474-06.2006. [DOI] [PMC free article] [PubMed] [Google Scholar]
- 14.Li N, et al. Glutamate N-methyl-D-aspartate receptor antagonists rapidly reverse behavioral and synaptic deficits caused by chronic stress exposure. Biol Psychiatry. 2011;69(8):754–761. doi: 10.1016/j.biopsych.2010.12.015. [DOI] [PMC free article] [PubMed] [Google Scholar]
- 15.Holmes A, Wellman CL. Stress-induced prefrontal reorganization and executive dysfunction in rodents. Neurosci Biobehav Rev. 2009;33(6):773–783. doi: 10.1016/j.neubiorev.2008.11.005. [DOI] [PMC free article] [PubMed] [Google Scholar]
- 16.Seamans JK, Lapish CC, Durstewitz D. Comparing the prefrontal cortex of rats and primates: Insights from electrophysiology. Neurotox Res. 2008;14(2-3):249–262. doi: 10.1007/BF03033814. [DOI] [PubMed] [Google Scholar]
- 17.Sotres-Bayon F, Quirk GJ. Prefrontal control of fear: More than just extinction. Curr Opin Neurobiol. 2010;20(2):231–235. doi: 10.1016/j.conb.2010.02.005. [DOI] [PMC free article] [PubMed] [Google Scholar]
- 18.Senn V, et al. Long-range connectivity defines behavioral specificity of amygdala neurons. Neuron. 2014;81(2):428–437. doi: 10.1016/j.neuron.2013.11.006. [DOI] [PubMed] [Google Scholar]
- 19.Laurent V, Westbrook RF. Inactivation of the infralimbic but not the prelimbic cortex impairs consolidation and retrieval of fear extinction. Learn Mem. 2009;16(9):520–529. doi: 10.1101/lm.1474609. [DOI] [PubMed] [Google Scholar]
- 20.Sierra-Mercado D, Padilla-Coreano N, Quirk GJ. Dissociable roles of prelimbic and infralimbic cortices, ventral hippocampus, and basolateral amygdala in the expression and extinction of conditioned fear. Neuropsychopharmacology. 2011;36(2):529–538. doi: 10.1038/npp.2010.184. [DOI] [PMC free article] [PubMed] [Google Scholar]
- 21.Ji G, Neugebauer V. Modulation of medial prefrontal cortical activity using in vivo recordings and optogenetics. Mol Brain. 2012;5:36. doi: 10.1186/1756-6606-5-36. [DOI] [PMC free article] [PubMed] [Google Scholar]
- 22.Liu RJ, Aghajanian GK. Stress blunts serotonin- and hypocretin-evoked EPSCs in prefrontal cortex: Role of corticosterone-mediated apical dendritic atrophy. Proc Natl Acad Sci USA. 2008;105(1):359–364. doi: 10.1073/pnas.0706679105. [DOI] [PMC free article] [PubMed] [Google Scholar]
- 23.Santarelli L, et al. Requirement of hippocampal neurogenesis for the behavioral effects of antidepressants. Science. 2003;301(5634):805–809. doi: 10.1126/science.1083328. [DOI] [PubMed] [Google Scholar]
- 24.Mickley GA, et al. Ketamine blocks a conditioned taste aversion (CTA) in neonatal rats. Physiol Behav. 1998;64(3):381–390. doi: 10.1016/s0031-9384(98)00097-3. [DOI] [PubMed] [Google Scholar]
- 25.Willner P. Chronic mild stress (CMS) revisited: Consistency and behavioural-neurobiological concordance in the effects of CMS. Neuropsychobiology. 2005;52(2):90–110. doi: 10.1159/000087097. [DOI] [PubMed] [Google Scholar]
- 26.Autry AE, et al. NMDA receptor blockade at rest triggers rapid behavioural antidepressant responses. Nature. 2011;475(7354):91–95. doi: 10.1038/nature10130. [DOI] [PMC free article] [PubMed] [Google Scholar]
- 27.Kavalali ET, Monteggia LM. How does ketamine elicit a rapid antidepressant response? Curr Opin Pharmacol. 2015;20:35–39. doi: 10.1016/j.coph.2014.11.005. [DOI] [PMC free article] [PubMed] [Google Scholar]
- 28.Liu RJ, et al. GSK-3 inhibition potentiates the synaptogenic and antidepressant-like effects of subthreshold doses of ketamine. Neuropsychopharmacology. 2013;38(11):2268–2277. doi: 10.1038/npp.2013.128. [DOI] [PMC free article] [PubMed] [Google Scholar]
- 29.Turrigiano GG, Nelson SB. Homeostatic plasticity in the developing nervous system. Nat Rev Neurosci. 2004;5(2):97–107. doi: 10.1038/nrn1327. [DOI] [PubMed] [Google Scholar]
- 30.Campanac E, Debanne D. Plasticity of neuronal excitability: Hebbian rules beyond the synapse. Arch Ital Biol. 2007;145(3-4):277–287. [PubMed] [Google Scholar]
- 31.Haider B, McCormick DA. Rapid neocortical dynamics: Cellular and network mechanisms. Neuron. 2009;62(2):171–189. doi: 10.1016/j.neuron.2009.04.008. [DOI] [PMC free article] [PubMed] [Google Scholar]
- 32.Chaudhury D, et al. Rapid regulation of depression-related behaviours by control of midbrain dopamine neurons. Nature. 2013;493(7433):532–536. doi: 10.1038/nature11713. [DOI] [PMC free article] [PubMed] [Google Scholar]
- 33.Covington HE, 3rd, et al. Antidepressant effect of optogenetic stimulation of the medial prefrontal cortex. J Neurosci. 2010;30(48):16082–16090. doi: 10.1523/JNEUROSCI.1731-10.2010. [DOI] [PMC free article] [PubMed] [Google Scholar]
- 34.Tye KM, Deisseroth K. Optogenetic investigation of neural circuits underlying brain disease in animal models. Nat Rev Neurosci. 2012;13(4):251–266. doi: 10.1038/nrn3171. [DOI] [PMC free article] [PubMed] [Google Scholar]
- 35.Warden MR, et al. A prefrontal cortex-brainstem neuronal projection that controls response to behavioural challenge. Nature. 2012;492(7429):428–432. doi: 10.1038/nature11617. [DOI] [PMC free article] [PubMed] [Google Scholar]
- 36.Myers-Schulz B, Koenigs M. Functional anatomy of ventromedial prefrontal cortex: Implications for mood and anxiety disorders. Mol Psychiatry. 2012;17(2):132–141. doi: 10.1038/mp.2011.88. [DOI] [PMC free article] [PubMed] [Google Scholar]
- 37.McLaughlin RJ, Hill MN, Gorzalka BB. A critical role for prefrontocortical endocannabinoid signaling in the regulation of stress and emotional behavior. Neurosci Biobehav Rev. 2014;42:116–131. doi: 10.1016/j.neubiorev.2014.02.006. [DOI] [PubMed] [Google Scholar]
- 38.Russo SJ, Nestler EJ. The brain reward circuitry in mood disorders. Nat Rev Neurosci. 2013;14(9):609–625. doi: 10.1038/nrn3381. [DOI] [PMC free article] [PubMed] [Google Scholar]
- 39.Tye KM, et al. Dopamine neurons modulate neural encoding and expression of depression-related behaviour. Nature. 2013;493(7433):537–541. doi: 10.1038/nature11740. [DOI] [PMC free article] [PubMed] [Google Scholar]
- 40.Salvadore G, et al. Anterior cingulate desynchronization and functional connectivity with the amygdala during a working memory task predict rapid antidepressant response to ketamine. Neuropsychopharmacology. 2010;35(7):1415–1422. doi: 10.1038/npp.2010.24. [DOI] [PMC free article] [PubMed] [Google Scholar]
- 41.Murrough JW, et al. Neurocognitive effects of ketamine in treatment-resistant major depression: Association with antidepressant response. Psychopharmacology (Berl) 2013 doi: 10.1007/s00213-013-3255-x. [DOI] [PMC free article] [PubMed] [Google Scholar]
- 42.Slattery DA, Neumann ID, Cryan JF. Transient inactivation of the infralimbic cortex induces antidepressant-like effects in the rat. J Psychopharmacol. 2011;25(10):1295–1303. doi: 10.1177/0269881110368873. [DOI] [PubMed] [Google Scholar]
- 43.Hamani C, et al. Antidepressant-like effects of medial prefrontal cortex deep brain stimulation in rats. Biol Psychiatry. 2010;67(2):117–124. doi: 10.1016/j.biopsych.2009.08.025. [DOI] [PubMed] [Google Scholar]


