Significance
Soft-tissue sarcomas are aggressive, often lethal tumors, which are understudied. Few therapies beyond standard resection and traditional chemotherapy/radiation are available. Sarcomas are diverse malignancies, including ∼65 distinct histological subtypes. The existence of common mechanisms underlying multiple subtypes has not previously been shown. We demonstrate that the Hippo pathway, an important regulator of cell proliferation, is deregulated in ≥25% of sarcomas, encompassing multiple commonly diagnosed subtypes. When control of the Hippo pathway is lost, expression of the effector protein Yes-Associated Protein (YAP) is stabilized, resulting in higher levels of proliferation. For the first time, to our knowledge, we show that YAP interacts with the forkhead box transcription factor FOXM1 to coregulate critical components of sarcomagenesis, specifically in fibrosarcoma, undifferentiated pleomorphic sarcomas, and liposarcomas.
Keywords: sarcoma, FOXM1, YAP, Hippo
Abstract
Genetic aberrations responsible for soft-tissue sarcoma formation in adults are largely unknown, with targeted therapies sorely needed for this complex and heterogeneous family of diseases. Here we report that that the Hippo pathway is deregulated in many soft-tissue sarcomas, resulting in elevated expression of the effector molecule Yes-Associated Protein (YAP). Based on data gathered from human sarcoma patients, a novel autochthonous mouse model, and mechanistic analyses, we determined that YAP-dependent expression of the transcription factor forkhead box M1 (FOXM1) is necessary for cell proliferation/tumorigenesis in a subset of soft-tissue sarcomas. Notably, FOXM1 directly interacts with the YAP transcriptional complex via TEAD1, resulting in coregulation of numerous critical pro-proliferation targets that enhance sarcoma progression. Finally, pharmacologic inhibition of FOXM1 decreases tumor size in vivo, making FOXM1 an attractive therapeutic target for the treatment of some sarcoma subtypes.
Soft-tissue sarcomas (STS) are heterogeneous mesenchymal tumors diagnosed annually in >200,000 people worldwide (1). STS comprise multiple histologically distinct tumor types, with fibrosarcoma, liposarcoma, and undifferentiated pleomorphic sarcoma (UPS) among the most commonly detected in adults. UPS is a particularly aggressive metastatic STS subtype and a diagnosis of exclusion, because its etiology is currently unknown, in striking contrast to certain pediatric sarcomas (including Ewing’s, alveolar rhabdomyosarcomas, etc.), which are associated with specific chromosomal translocations (2). A paucity of knowledge regarding the cellular and molecular mechanisms underlying human UPS makes targeted therapeutic intervention difficult (1, 3). Metastasis in UPS patients likely occurs downstream of excessive primary tumor growth, resulting in a hypoxic microenvironment that promotes tumor cell dissemination (4). To date, there are few disease-specific treatments to offer sarcoma patients, with therapeutic modalities being limited to surgery, radiotherapy and cytotoxic chemotherapy (1). Among these treatments, radical surgeries are the most effective means of treatment (5). However, in some cases, tumor-ablating surgery is not possible, and local recurrences appear. More conservative surgeries, combined with effective targeted inhibitors of cell proliferation and/or migration, would significantly improve patient prognosis and quality of life.
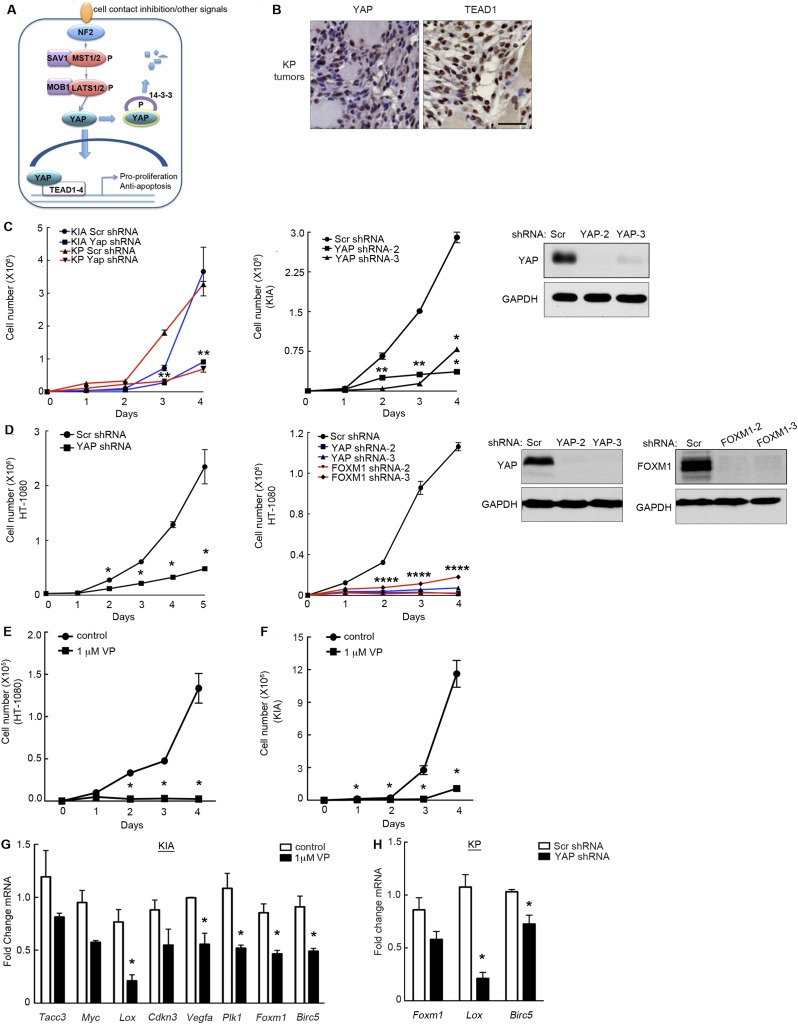
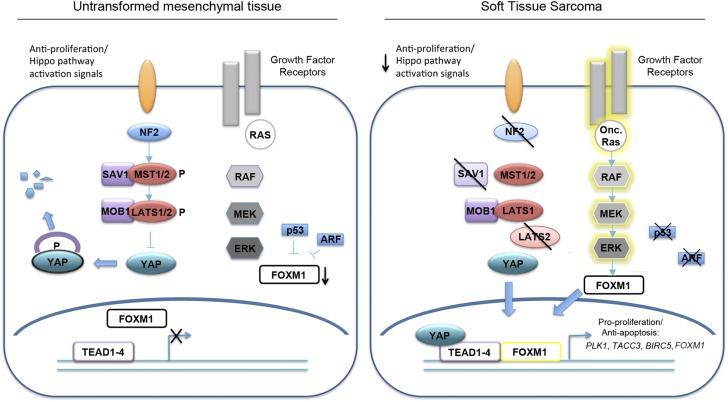
Using The Cancer Genome Atlas (TCGA) and other tissue-banking resources, we uncovered a possible role for aberrant Hippo pathway signaling in fibrosarcoma, UPS, and potentially other STS subtypes. “Hippo” signal transduction has been characterized as a master regulator of cell proliferation and tissue size (reviewed in ref. 6). Core components of this evolutionarily conserved pathway include a kinase cascade whose output is inhibition of the Yes-Associated Protein (YAP) transcriptional coactivator (Fig. S1A). In mammals, Hippo signaling responds to diffusible extracellular ligands, or contact inhibition between cells, by activating MST1/MST2 kinases (mammalian Hippo kinase homologs). Although these upstream events are still incompletely understood and an area of active investigation, intracellular proteins including NF2 link extracellular signals to YAP inhibition (7). MST1/2 are dependent upon the SAV1 adaptor for their kinase activity (6), and the MST/SAV1 complex phosphorylates and activates LATS1/2, which binds the MOB1 adaptor. Activated LATS subsequently phosphorylates YAP, leading to recognition by 14-3-3 proteins, resulting in YAP cytoplasmic sequestration or proteasomal degradation. Upon growth stimulation, the Hippo pathway is inactivated, allowing unphosphorylated YAP to translocate into the nucleus, bind Tea Domain Family transcription factors (TEAD1–4), and promote transcription of factors required for cell division and survival.
Fig. S1.
YAP inhibition decreases proliferation and Foxm1 and FOXM1 target expression. (A) A model of Hippo pathway regulation. (B) YAP and TEAD1 are expressed in the nucleus of KP tumors. Tumors were embedded in paraffin, sectioned, and stained for YAP and TEAD1. (Scale bar: 50 μm.) (C, Left) YAP knockdown via lentiviral shRNA transduction inhibits KIA and KP cell proliferation (P < 0.02 for both cell types at day 3 and P < 0.0005 for both cell types at day 4). (C, Center) Two additional shRNAs targeting murine YAP were used to verify the decrease in proliferation (P < 0.03 for both shRNAs at day 2, P < 0.0001 for both shRNAs at day 3, and P < 0.003 for both shRNAs at day 4). (C, Right) Western blot of additional YAP shRNA-treated cells (n = 2; assays performed in triplicate). *P < 0.05; double stars indicate that P values apply to both red and blue lines (Left) and both squares and triangles (Center). (D, Left) YAP inhibition in human sarcoma (HT-1080 cells) inhibits proliferation as in A (P < 0.006 at days 2–5). (D, Center) Additional YAP and FOXM1 shRNAs were used to validate knockdown and its effect on proliferation (P < 0.01 for all four shRNAs at day 2, P < 0.004 for all four shRNAs at day 3, and P < 0.001 for all four shRNAs at day 4). (D, Right) Western blots of YAP and FOXM1 shRNA-treated cells (n = 2; assays performed in triplicate). *P < 0.05; quadruple stars indicate that P values apply to both red and blue lines. (E) Treatment of HT-1080 cells with 1 μM VP for 4 d inhibited proliferation. *P < 0.05 (P = 0.003 at day 2, P = 8.7 × 10⁻⁵ at day 3, and P = 0.017 at day 4; n = 3; assays performed in triplicate). (F) KIA cells treated as in E. *P < 0.05 (P = 0.002 at day 2, P = 0.022 at day 3, and P = 0.013 at day 4; n = 3; assays performed in triplicate). (G) KIA cells treated with 1 μM VP for 48 h showed decreases in FOXM1 target mRNA expression, including Lox P = 0.013; Cdkn3 P = 0.001; Vegfa P = 0.047; Plk1 P = 0.012; Foxm1 P = 0.05; and Birc5 P = 0.004. *P < 0.05 (n = 2; assays performed in triplicate). (H) KIA cells treated with Yap shRNA show decreases in mRNA expression of Foxm1 and FOXM1 targets, including Lox, P = 0.003; and Birc5, P = 0.009. *P < 0.05 (n = 2; assays performed in triplicate).
Hippo inhibition and YAP activation can also promote tumorigenesis. In fact, NF2 mutation/deletion has been reported in Neurofibromatosis type II lesions (schwannomas, meningiomas, and ependymomas), malignant mesothelioma, and other carcinomas (8–11). Recent studies have revealed that mutations in the Hippo pathway are more common than previously thought (8, 12). Furthermore, Hippo pathway genomic deletions/amplifications and gene expression changes have been detected in a variety of malignancies including STS (13). However, little is known about the status of the Hippo pathway in adult STS, although MST1/2 appears to be epigenetically silenced through promoter hypermethylation in a limited number of sarcoma patient samples (14).
YAP is a powerful regulator of tumor cell proliferation, due to enhanced transcriptional activity at target genes. Many YAP/TEAD targets have been associated with tumor progression, including BIRC5, CCND1, and forkhead box M1 (FOXM1) (6, 10, 15, 16). In particular, YAP/TEAD directly bind the FOXM1 promoter, inducing its expression in a model of malignant mesothelioma (where upstream NF2 mutations are common) (10). FOXM1 is a winged helix–turn–helix transcription factor important for cell-cycle progression (17), whose activity is inhibited by direct interaction with the p19ARF (18), p53 (19), and retinoblastoma pathways (20). FOXM1 is highly expressed in a variety of human cancer cells due to loss of these tumor suppressor proteins and as a result of signaling from oncogenic factors like Ras (21).
To probe the relationship between the Hippo pathway and FOXM1 in a subset of commonly diagnosed sarcomas, we used a variety of approaches, including multiple mouse models of UPS and cell lines derived from these tumors. LSL KrasG12D/+;Trp53fl/fl (KP) and LSL KrasG12D/+;Ink4/Arffl/fl (KIA) mice recapitulate human UPS (4, 22), allowing the study of downstream factors that control sarcomagenesis. Although previous studies have implicated YAP and FOXM1 as critical for epithelial tumorigenesis, little evidence has suggested that the Hippo pathway and its downstream effectors are aberrantly regulated in adult STS. Here, we identify key Hippo pathway members whose levels are decreased in TCGA sarcoma patient samples and show that YAP is nuclear and highly overexpressed in UPS and liposarcoma, leading to elevated FOXM1. We also demonstrate a previously unrecognized physical association between FOXM1 and YAP/TEAD, which may account for the large number of overlapping transcriptional targets. Both genetic and pharmacologic inhibition of YAP/TEAD and FOXM1 result in sarcoma cell proliferation defects, suggesting that these targets represent promising therapeutic interventions for mesenchymal tumors. Very recent studies have shown that YAP overexpression and function plays a role in the pediatric malignancies alveolar embryonal rhabdomyosarcoma (aRMS) and embryonal rhabdomyosarcoma (eRMS) (23, 24). Together with these findings, we conclude that the Hippo pathway is potentially important in multiple sarcoma subtypes. Therefore, defining the downstream effects of YAP overexpression through FOXM1 is essential for improved treatment of patients with STS.
Results
Deregulation of the Hippo Pathway in Human Sarcomas.
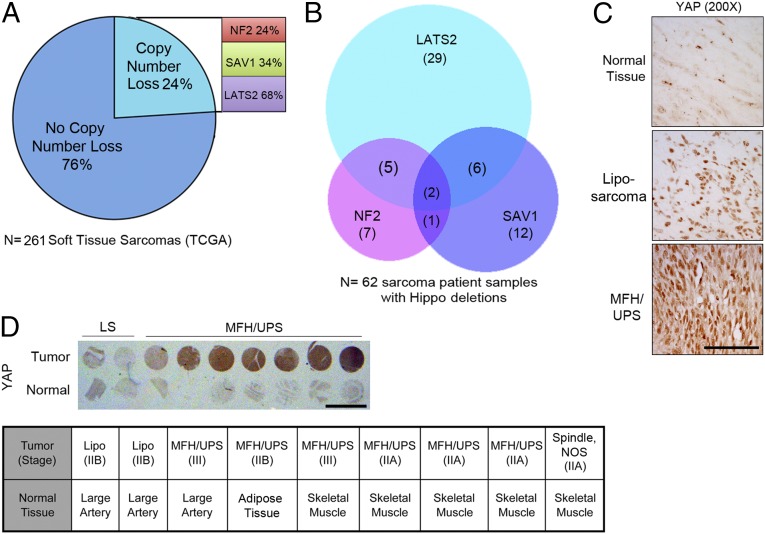
Abnormal Hippo activity can lead to increased cell proliferation and tumorigenesis (8). To determine whether Hippo pathway genetic aberrations occur in STS, we queried the TCGA sarcoma database for copy-number variations (CNVs) in the upstream effectors of Hippo signaling. Our analysis revealed that 24% of all 261 sarcoma samples deposited in the TCGA database contain copy-number loss for genes encoding one or more of these Hippo pathway components, including NF2, SAV1, and/or LATS2 (Fig. 1A). If we narrow our analysis to only those samples that have been identified by histological subtype (108 of 261 total samples), we find that 39% bear copy-number losses in NF2, SAV1, and/or LATS2. This distinction is important given that deregulated Hippo signaling may occur in some subtypes but not others. The subtypes found in the dataset include leiomyosarcoma, dedifferentiated liposarcoma, UPS, myxofibrosarcoma, and UPS with giant cells. Given that ∼40% of these sarcomas may have altered Hippo signaling, we focused our studies on these subtypes. Nearly 70% of Hippo pathway chromosomal losses occur in LATS2, whereas 20% of affected tumors contain CNV loss of multiple Hippo regulators (Fig. 1B). Such genetic changes would be anticipated to result in stabilization and nuclear translocation of the Hippo pathway downstream effector, YAP. Of note, immunohistochemical (IHC) analysis of human tissue samples showed that YAP levels are dramatically increased in the nuclei of high-grade UPS tumor cells, compared with normal skeletal, adipose, and arterial tissue [Fig. 1 C and D (high and low mag, respectively)]. YAP nuclear localization suggests that it may be actively regulating target transcription in these tumor tissues.
Fig. 1.
Hippo pathway deregulation in human sarcoma. (A) TCGA STS copy-number data showing percentage of Hippo pathway CNV loss (n = 261 STS patients). See Materials and Methods for more information. (B) Venn diagram delineating number of common and unique CNV losses in the 62 STS patient samples containing LATS2, SAV1, or NF2 losses. (C) Higher magnification showing YAP nuclear localization in biopsy cores from D. (Scale bar: 100 μm.) (D, Upper) IHC staining for YAP accumulation in normal and STS patient sample biopsy cores. (Scale bar: 0.5 cm.) (D, Lower) Histopathological characterization of the human tissue cores shown in Upper (n = 9 tumor samples and 9 control tissues).
YAP Inhibition Results in Decreased Sarcoma Cell Proliferation in Vitro and in Vivo.
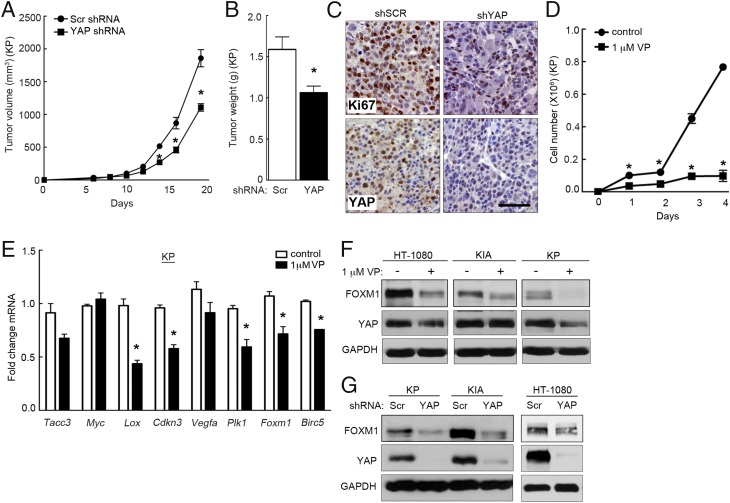
To further define the role of YAP in STS, we initiated cell-based proliferation studies in murine and human sarcoma cell lines. Murine sarcoma cells were derived from the autochthonous KP and KIA models of UPS. Tumors that develop in these mice, after Adeno-Cre virus injection into the left gastrocnemius muscle, recapitulate human UPS morphologically and histologically while harboring similar gene-expression profiles (4, 22, 25). Additionally, hindlimb tumors successfully metastasize to the lung, mirroring human UPS. It is noteworthy that YAP and TEAD1 are expressed in the nucleus of KP tumors, indicating that the Hippo pathway may be inactivated in this model (Fig. S1B). YAP reduction via lentiviral shRNA significantly reduced KP and KIA cell proliferation in vitro (Fig. S1C), with similar results obtained for human HT-1080 fibrosarcoma cells using independent shRNAs (Fig. S1D). Three independent shRNAs targeting human YAP and three shRNAs targeting murine Yap were used to demonstrate specific knockdown (Fig. 2G and Fig. S1 C and D). To evaluate the role of YAP in tumor formation, 1 × 10⁶ KP cells, transduced with control or YAP-specific shRNA, were injected into the flanks of nude mice to generate allograft tumors. To generate a sufficient number of YAP shRNA-expressing cells for s.c. injection, we minimized Yap knockdown to ∼50–70%. Yap knockdown resulted in significantly decreased tumor volume (Fig. 2A) and final tumor weight (Fig. 2B). IHC analysis of control and YAP shRNA-treated tumors showed that YAP decreased the number of Ki67+ cells by ∼40% (n = 4 samples per condition; P = 0.0005), indicating decreased proliferation (Fig. 2C) consistent with our in vitro findings (Fig. S1 C and D). The effect of YAP on sarcomagenesis is likely underestimated in these studies due to incomplete knockdown, as well as rapid tumor growth, wherein proliferation of YAP-expressing cells likely overtakes YAP knockdown cells.
Fig. 2.
YAP inhibition decreases proliferation in vitro and in vivo. (A) We s.c. injected 1 × 10⁶ KP cells bearing control or Yap shRNA into nu/nu mice (Scr shRNA, n = 9; Yap shRNA, n = 8). *P < 0.05 (P < 0.0014 at day 14, P < 0.002 at day 16, P < 0.0002 at day 18). (B) Tumor weight is decreased in YAP shRNA-treated tumors. *P < 0.05 (P = 0.009). (C) IHC of YAP and Ki-67 in control and YAP shRNA-treated tumors showed decreased cell proliferation associated with the loss of YAP expression. (Scale bar: 100 μm.) (D) KP cells treated with 1 μM VP for 4 d. *P < 0.05 (P = 0.0187 at day 1, P = 0.009 at day 2, P = 0.007 at day 3, and P = 0.003 at day 4; n = 3) assays performed in triplicate. (E) qRT-PCR analysis of KP cells with 1 μM VP for 48 h shows that VP treatment decreases mRNA levels of multiple YAP transcriptional targets (n = 3; assays performed in triplicate). *P < 0.05 (Lox, P = 0.007; Cdkn3, P = 0.001; Plk1, P = 0.009; Foxm1, P = 0.017; Birc5, P = 0.0003). (F) Immunoblot analysis of HT-1080, KIA, and KP cells treated as in E (n > 3). (G) Immunoblot analysis of FOXM1 expression in YAP-deleted HT-1080, KP, and KIA cells (n > 3).
The YAP inhibitor Verteporfin (VP) prevents its interaction with constitutively nuclear binding partners TEAD1–4, thereby inhibiting transcription of YAP/TEAD targets (26). Consistent with YAP inhibition via shRNA, treatment with 1 μM VP dramatically reduced sarcoma cell proliferation (Fig. 2D and Fig. S1 E and F). Quantitative RT-PCR (qRT-PCR) analyses of VP-treated KP cells revealed that YAP targets—including Lox, Cdkn3, Plk1, Foxm1, and Birc5—exhibited decreased expression 48 h later (Fig. 2E). Similar results were obtained by VP treatment of KIA cells, as well as shRNA-mediated Yap inhibition in KP cells (Fig. S1 G and H). From these data, we noted that many of the down-regulated mRNAs (Lox, Cdkn3, Plk1, and Birc5) are also targets of FOXM1-mediated transcription, in addition to being YAP effectors. Based on this finding, we investigated the possibility that FOXM1 is an essential component of the YAP transcriptional program, wherein YAP activation controls FOXM1 expression and, as a result, impacts FOXM1 transcriptional output (i.e., LOX, CDKN3, PLK1, and BIRC5). Initially, we confirmed that YAP regulates FOXM1 protein expression, using VP (Fig. 2F) and YAP-specific shRNA treatments (Fig. 2G), which revealed decreased FOXM1 protein levels in HT-1080, KIA, and KP cells. Consistent with previous reports (26), VP had no reproducible effect on YAP protein levels. We conclude that YAP is a regulator of FOXM1 expression in sarcoma cells, and its impact on sarcoma cell proliferation and tumorigenesis may require FOXM1.
FOXM1 Is Highly Expressed in Human Sarcomas.
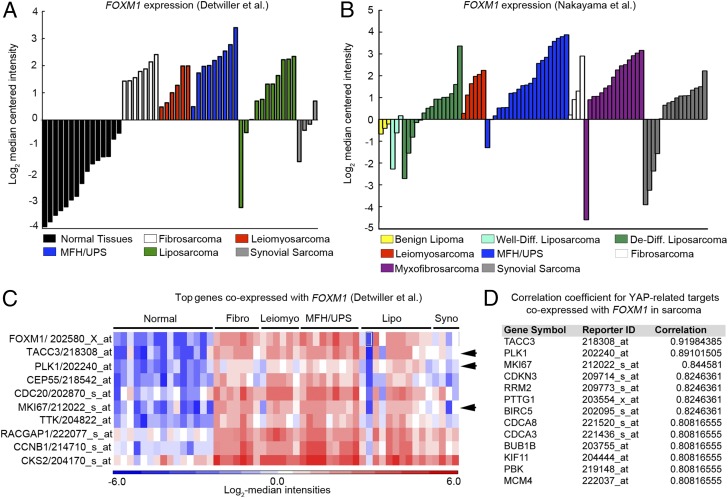
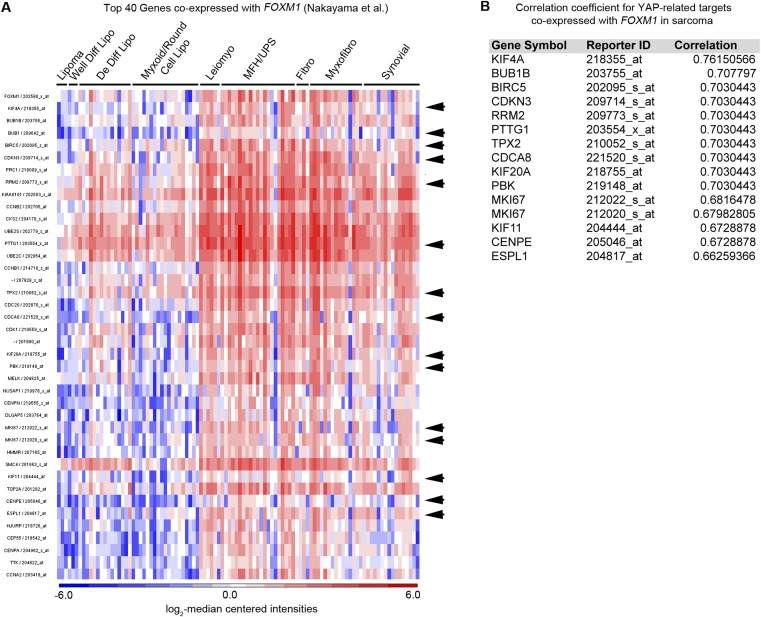
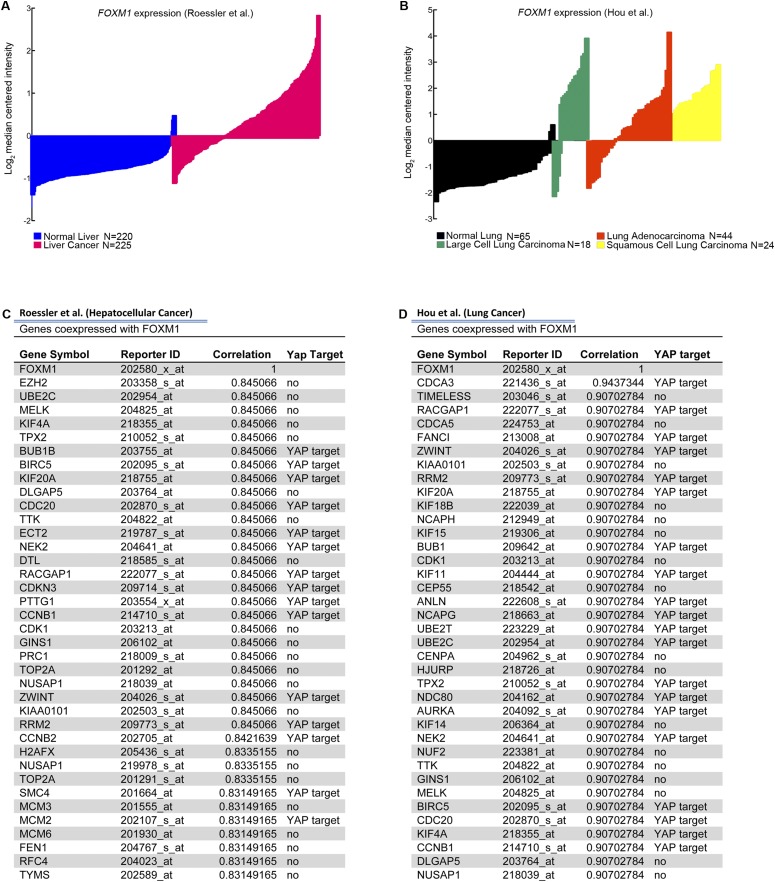
To examine the importance of FOXM1 as a downstream effector of the Hippo pathway in human sarcoma, we investigated FOXM1 expression levels in patient-derived tumor samples. Based on the observation that the Hippo pathway is deregulated in STS (Fig. 1), we predicted that YAP target gene levels, specifically FOXM1, would be elevated in tumor samples. Using publically available microarray analyses of STS from Detwiller et al. (27) and Nakayama et al. (28), we compared the levels of FOXM1 mRNA in normal and STS tissues (Fig. 3 A and B). The list of individual tumor subtypes and associated FOXM1 levels can be found in Fig. S2. FOXM1 levels are dramatically elevated in a variety of human sarcoma subtypes (including fibrosarcoma, leiomyosarcoma, UPS, and liposarcoma) relative to normal tissues. Interestingly, in synovial sarcoma, FOXM1 levels appear to be less uniform, suggesting that they use alternate mechanisms of proliferation control. The Oncomine coexpression analysis tool identified genes whose expression paralleled FOXM1 in STS, and the top 40 genes were compared with established or potential YAP targets identified in the literature (6, 16, 29) and a microarray dataset of YAP-regulated genes in human malignant mesothelioma cells (10). Of the top 40 genes coexpressed with FOXM1 in the Detwiller et al. database, 13 are also putative YAP targets (Fig. 3 C and D). Similarly, 15 of these top 40 genes identified in the Nakayama et al. database are putative YAP targets (Fig. S3). Of note, 60% of the top targets are identical between the two datasets, consistent with the hypothesis that YAP/TEAD targets are up-regulated in STS, most likely as a result of Hippo pathway deregulation. Importantly, we showed that FOXM1 is consistently up-regulated in a variety of STS subtypes, suggesting that increased FOXM1 may be a common contributor to cell proliferation in sarcoma. Because FOXM1 promotes proliferation in many epithelial tumors (17), we evaluated FOXM1 mRNA levels in liver and lung cancers compared with normal tissues (Fig. S4 A and B) and found that 37% and 50%, respectively, of the top 40 genes coexpressed with FOXM1 are YAP targets (Fig. S4 C and D), suggesting that the mechanism studied here may be relevant to epithelial cancers as well as sarcomas.
Fig. 3.
FOXM1 is highly expressed in human sarcoma. (A) FOXM1 levels obtained from Oncomine analysis of the Detwiller et al. (27) microarray showed elevated FOXM1 mRNA levels in the indicated sarcomas compared with normal tissues (listed in Fig. S2); all P < 1 × 10⁻⁷. (B) Oncomine analysis of the Nakayama et al. (28) microarray; all P < 0.014. (C) Oncomine analysis of targets coexpressed with FOXM1 in the Detwiller et al. microarray. Arrows indicate targets that are also controlled by YAP, as summarized in D. (D) Table delineating YAP targets coexpressed with FOXM1 in the Detwiller et al. microarray in sarcoma, including correlation coefficients of coexpression (from top 40 genes coexpressed with FOXM1).
Fig. S2.
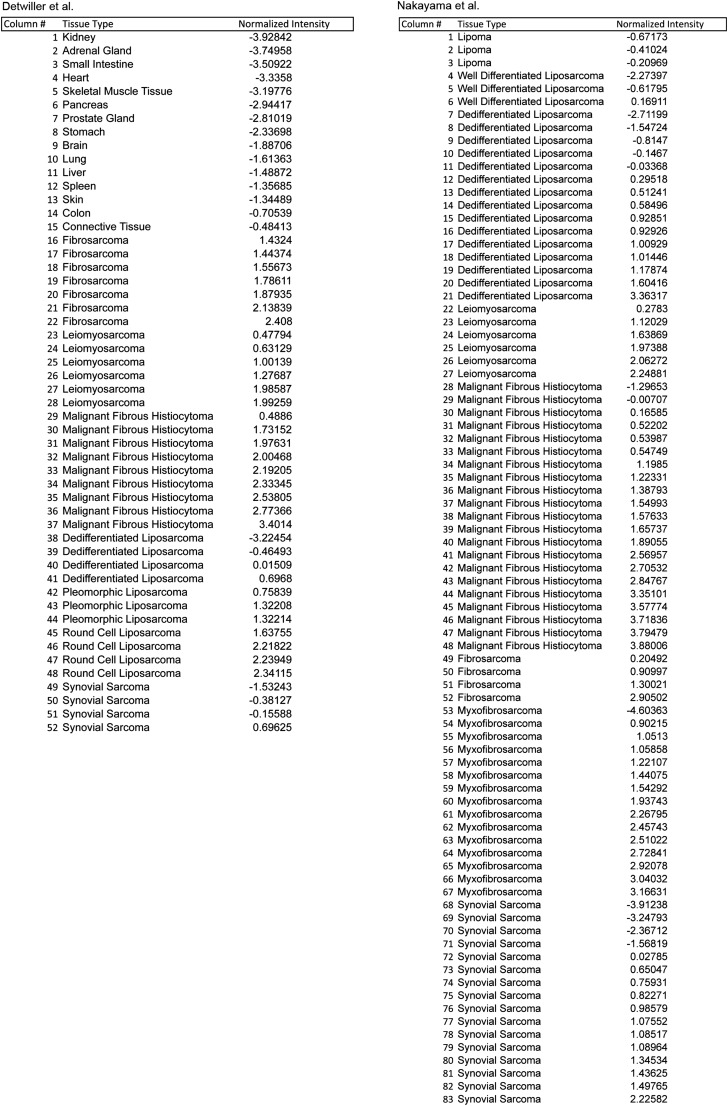
Sarcoma subtypes included in expression analysis. Lists of the sarcoma subtypes (in order) included in Oncomine-based gene expression analysis from Detwiller et al. (27) and Nakayama et al. (28).
Fig. S3.
Coexpression of YAP targets with FOXM1 in human sarcomas. (A) Oncomine analysis of targets coexpressing with FOXM1 in the Nakayama et al. (28) microarray. Arrows indicate targets that are also controlled by YAP. (B) Table delineating YAP targets coexpressed with FOXM1 in the Nakayama et al. microarray in sarcoma, including correlation coefficients of coexpression.
Fig. S4.
FOXM1 is highly expressed in human liver and lung cancer. (A) FOXM1 levels obtained from Oncomine analysis of the Roessler et al. (46) microarray showed elevated FOXM1 mRNA levels in the indicated tumors compared with normal tissues (P < 2.55 × 10−61). (B) Oncomine analysis of the Hou et al. (47) microarray (all P < 3.25 × 10⁻⁷). (C) Oncomine analysis of targets coexpressed with FOXM1 in the Roessler et al. microarray. Table delineates YAP targets coexpressed with FOXM1 in the Roessler et al. microarray, including correlation coefficients of coexpression (from top 40 genes coexpressed with FOXM1). (D) Oncomine analysis of targets coexpressed with FOXM1 in the Hou et al. microarray. Table delineates YAP targets coexpressed with FOXM1.
FOXM1 Promotes Proliferation in Sarcoma Cells.
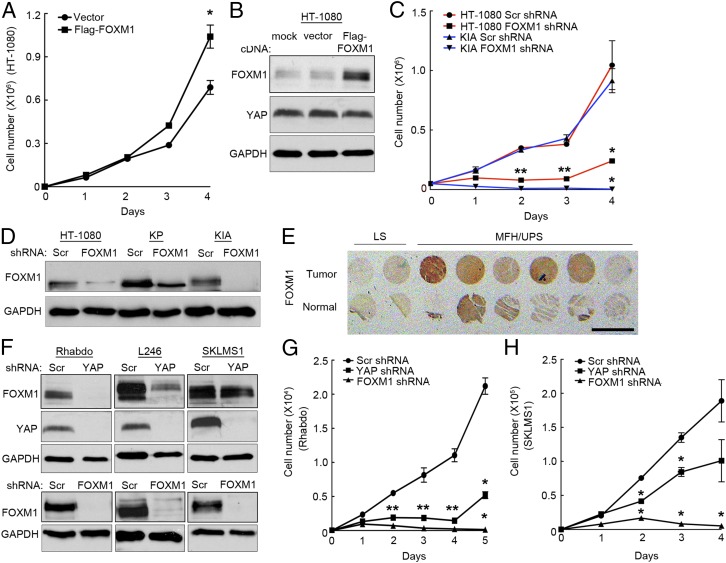
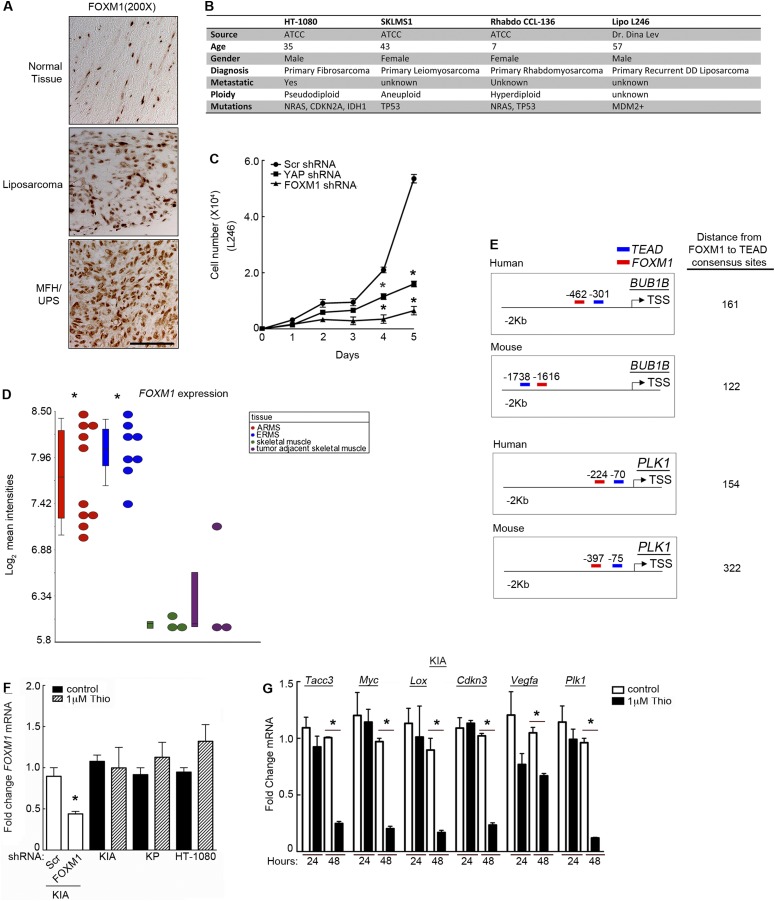
Because FOXM1 is regulated by the Hippo pathway and promotes cell proliferation in a variety of cancers, we investigated its role in sarcoma cell growth. We performed a combination of overexpression and shRNA-mediated FOXM1 knockdown experiments. Human Flag-FOXM1 was introduced into HT-1080 cells, which exhibit a slower rate of proliferation compared with KP and KIA cells and lack p53 mutations that elevate endogenous FOXM1 levels. Expression of Flag-FOXM1 increased proliferation in these cells (Fig. 4A), while having no effect on endogenous YAP accumulation (Fig. 4B). Consistent with these findings, shRNA-mediated inhibition of FOXM1 significantly inhibited both human and murine sarcoma cell growth (Fig. 4 C and D). Three independent shRNAs targeting human FOXM1 were used to demonstrate specific knockdown (Fig. 4 C and D and Fig. S1D). IHC analysis of serial sectioned human sarcoma and normal tissue samples (shown in Fig. 1 C and D) revealed that FOXM1 levels are increased in the nuclei of UPS tumor cells, compared with normal skeletal and arterial tissue [Fig. 4E (low mag) and Fig. S5A (high mag)]. However, FOXM1 protein levels appear more heterogeneous than YAP in the tumors. These findings are consistent with the notion that FOXM1 is a YAP transcriptional target and that this pathway is up-regulated during sarcomagenesis. We extended our analysis to include the following additional human sarcoma cell lines: rhabdomyosarcoma (Rhabdo), liposarcoma (L246), and leiomyosarcoma (SKLMS1) (described in Fig. S5B). These cell lines bear perturbations in either the Ras pathway, p53 pathway, or both, similar to HT-1080 cells and our murine models. Interestingly, whereas FOXM1 shRNA treatment dramatically reduced proliferation in all of these cell lines (Fig. 4 F–H and Fig. S5C), YAP knockdown inhibited FOXM1 expression in L246 and Rhabdo cells, while having no effect on FOXM1 expression in SKLMS1 cells. SKLMS1 cells appear to be unique among the cell lines we tested (Fig. 4 F–H and Fig. S5C). Importantly, YAP knockdown in SKLMS1 cells also had a reduced effect on their proliferation, suggesting that YAP’s ability to control FOXM1 expression is critical for its regulation of cell division. Additionally, these data show that FOXM1 expression is not regulated uniformly by YAP in all STS subtypes (Fig. 4F). We were particularly intrigued by our findings in the rhabdomyosarcoma cell line, because recent reports have implicated Hippo pathway perturbations here (23, 24). YAP expression has been shown to be elevated in these tumors compared with normal tissue and to promote tumor growth in this context. Therefore, we hypothesized that the role of YAP in rhabdomyosarcoma may be, in part, to stimulate FOXM1 expression. Bioinformatic analyses of alveolar and embryonal rhabdomyosarcoma tumors revealed a significant increase in FOXM1 mRNA levels compared with normal tissues (Fig. S5D). Consistent with these findings, CNV analyses demonstrated that 42% of embryonal rhabdomyosarcoma patients screened had lost at least one copy of LATS1, and 28% of alveolar rhabdomyosarcoma patients had lost at least one copy of NF2. Therefore, the Hippo pathway may be inactivated, promoting both YAP stabilization and FOXM1 expression in rhabdomyosarcomas.
Fig. 4.
FOXM1 promotes proliferation in sarcoma cells. (A) Proliferation assay of HT-1080 cells expressing empty vector or Flag-FOXM1 constructs. *P < 0.05 (P = 0.019; n = 2; assays performed in triplicate). (B) Immunoblot of FOXM1 and YAP levels 4 d after Flag-FOXM1 overexpression. (C) Proliferation analysis of HT-1080 and KIA cells expressing scrambled (Scr) or FOXM1 shRNA. *P < 0.05; double stars indicate that P values apply to both squares and triangles (HT-1080, P = 1.49 × 10⁻⁵ at day 2, P = 0.0005 at day 3, and P = 0.042 at day 4; KIA, P = 0.0003 at day 2, P = 0.005 at day 3, and P = 0.012 at day 4; n = 3; assays performed in triplicate). (D) Immunoblot of FOXM1 and YAP levels 4 d after FOXM1 knockdown (n = 3). (E) IHC staining for FOXM1accumulation in normal and STS patient sample biopsy cores. (Scale bar: 0.5 cm.) (F) Western blots of FOXM1 and YAP expression in human sarcoma cell lines (n = 2). (G) Proliferation assay of rhabdomyosarcoma cells treated with YAP and FOXM1 shRNAs. *P < 0.05; double stars indicate that P values apply to both squares and triangles (YAP shRNA, P = 0.0007 at day 2, P = 0.028 at day 3, P = 0.0096 at day 4, and P = 0.0061 at day 5; FOXM1 shRNA, P = 2.7 × 10⁻⁵ at day 2, P = 0.017 at day 3, P = 0.0076 at day 4, and P = 0.0032 at day 5; n = 2; assays performed in triplicate). (H) Proliferation assay of leiomyosarcoma cells treated with YAP and FOXM1 shRNAs. *P < 0.05 (YAP shRNA, P = 0.0002 at day 2 and P = 0.033 at day 3; FOXM1 shRNA, P = 0.0009 at day 2, P = 0.0033 at day 3, and P = 0.027 at day 4; n = 2; assays performed in triplicate).
Fig. S5.
FOXM1 levels and regulation in human sarcomas. (A) Higher magnification showing YAP nuclear localization in biopsy cores from Fig. 4E. (B) Table of human sarcoma cell line characteristics and history. (C) Proliferation in liposarcoma cells (L246) treated with YAP and FOXM1 shRNAs. *P < 0.05 (P < 0.021 for both shRNAs at day 4, and P < 0.002 for both shRNAs at day 5; n = 2; assays performed in triplicate). (D) FOXM1 expression analysis from rhabdomyosarcoma patients compared with normal skeletal muscle. *P < 0.05 (P < 7.5 × 10⁻⁶ for both tumor types). Individual patient samples are delineated with circles, and means are plotted in box and whisker format. (E) Analysis of distances between FOXM1 and TEAD consensus motifs in human and mouse BUB1B/PLK1 promoters immediately upstream of the TSS. (F) Foxm1 mRNA levels in KIA cells infected with scramble (Scr) or FOXM1 shRNA and KIA, KP, and HT-1080 cells treated with control DMSO or 1 μM Thiostrepton. FOXM1 mRNA is decreased upon shRNA infection but unchanged with Thiostrepton treatment. *P < 0.05 (P = 0.013; n = 2; assays performed in triplicate). (G) FOXM1 inhibition decreases the expression of many YAP and FOXM1 coregulated targets. KIA cells were treated with 1 μM Thiostrepton for 24 or 48 h. FOXM1 transcriptional targets decreased, including Tacc3, P = 0.0007; Myc, P = 0.023; Lox, P = 0.020; Cdkn3, P = 0.001; Vegfa, P = 0.019; and Plk1, P = 0.002 (n = 3, assays performed in triplicate). *P < 0.05.
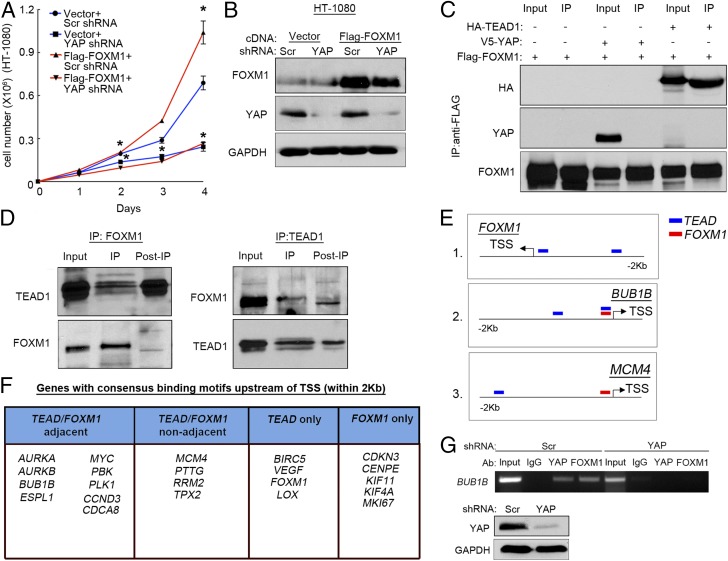
Based on the observation that FOXM1 is a YAP transcription target, we hypothesized that reintroduction of Flag-FOXM1 might partially “rescue” YAP-dependent sarcoma cell proliferation. However, exogenous FOXM1 had no effect on the growth of HT-1080 cells expressing a YAP-specific shRNA (Fig. 5 A and B). Based on these data and the surprising overlap of YAP and FOXM1 target genes, we investigated the possibility that FOXM1 interacts directly with the YAP complex to promote transcription in sarcoma cells. If a physical interaction between FOXM1 and YAP were essential for YAP/TEAD activity, then exogenous FOXM1 would be unable to rescue proliferation in the absence of YAP. We performed Flag-FOXM1 immunoprecipitation (IP) on lysates from HT-1080 cells expressing empty vector, V5-YAP, or HA-TEAD1 (Fig. 5C). Although FOXM1 failed to bind YAP, it interacted strongly with TEAD1, suggesting that a physical association between FOXM1 and the YAP/TEAD complex occurs at target gene promoters. Co-IP of endogenous TEAD1 and FOXM1 further supported a physical interaction between these two transcription factors (Fig. 5D). Western analysis of FOXM1 expression indicated the presence of multiple species of this protein, and IP pull-down using a TEAD1 antibody clearly showed preferential binding of TEAD1 to the higher-molecular-weight form. Similarly, endogenous IP using a FOXM1 antibody preferentially precipitated this larger isoform, which is clearly capable of coimmunoprecipitating TEAD1. The FOXM1/TEAD interaction also provides a likely explanation for the inability of FOXM1 to rescue YAP-deficient cell proliferation.
Fig. 5.
FOXM1 binds to YAP/TEAD complex. (A) Proliferation analysis of HT-1080 cells expressing YAP shRNA or Scr shRNA as well either a Flag-FOXM1 overexpression construct or empty vector. *P < 0.05 (Scr/vector shRNA vs. YAP shRNA/vector, P = 0.046 at day 2, P < 0.015 at day 3, and P < 0.01 at day 4; Scr/vector vs. Scr/Flag-FOXM1, P = 0.02 at days 2 and 4; n = 2; assays performed in triplicate). (B) Immunoblot showing YAP and FOXM1 levels from day 4 of proliferation assay in A. (C) Immunoblot showing HA, YAP, and Flag-FOXM1 levels upon immunoprecipitation with anti-Flag antibody-coated beads (n = 2). (D) Immunoblots of FOXM1 and TEAD1 upon endogenous coimmunoprecipitation with anti-rabbit secondary coated magnetic beads (n = 2). (E) Schematic of TEAD and FOXM1 binding sites upstream of transcription start sites (TSS) for FOXM1 (1), BUB1B (2), and CDKN3 (3). Each schematic represents an example of presence of TEAD1 only binding site (1), adjacent TEAD/FOXM1 sites (2) and nonadjacent TEAD/FOXM1 sites (3). Blue, TEAD binding site; red, FOXM1 binding site. (F) Genes with consensus binding motifs upstream of TSS (within 2 Kb). Table divides 24 FOXM1 or YAP/TEAD targets into groups based on location and identity of the binding sites (adjacent TEAD/FOXM1 binding sites, nonadjacent TEAD/FOXM1 binding sites, TEAD sites only, and FOXM1 sites only). Fisher’s exact test (two-sided; P = 0.004943). (G, Upper) ChIP of the BUB1B promoter FOXM1/TEAD1 binding site in Scr and YAP shRNA-treated HT-1080 cells. The BUB1B promoter was immunoprecipitated with IgG, FOXM1, and YAP antibodies. (G, Lower) Western blot analysis of YAP expression of shRNA treated HT-1080 cells (n = 2).
To determine whether FOXM1 interacts with the YAP/TEAD complex at human target gene promoters, we queried chromatin IP-sequencing (ChIP-seq) data available through the Encyclopedia of DNA Elements (ENCODE) project and UCSC Genome Browser (genome.ucsc.edu/ENCODE/). Sequence analyses of up to 2 Kb upstream and 500 bases downstream of the transcriptional start sites (TSS) of 22 independent putative YAP/TEAD or FOXM1 targets were performed, and promoter regions binding TEAD and FOXM1 were determined. FOXM1 and TEAD binding sites were considered “adjacent” if their centered ChIP-seq peaks occurred within 400 bases of each other. The center of a ChIP-seq peak indicates the region of strongest transcription factor binding. This definition of adjacent allows the incorporation of two distinct types of transcription factor binding: (i) FOXM1 and TEAD physically associate while bound to immediately neighboring consensus sites; and (ii) FOXM1 and TEAD physically associate at distant consensus sites brought together due to chromatin looping. A separation of 400–500 bases between transcription factor binding sites has been shown to be optimal for physical interaction of the binding proteins in looped chromatin (30). Target gene promoters containing both FOXM1 and TEAD consensus sites were assessed to determine whether the sites were adjacent, suggesting direct interaction of FOXM1 with TEAD, or “nonadjacent,” indicating potentially independent regulation by either/both factors. A schematic of this study can be found in Fig. 5E. Of 22 targets, 9 contained adjacent TEAD/FOXM1 binding sites, 4 contained TEAD and FOXM1 binding sites that were nonadjacent, 4 contained exclusively TEAD sites, and 5 contained exclusively FOXM1 sites (Fig. 5F). To determine whether adjacent FOXM1 and TEAD binding occurs more frequently in FOXM1-coexpressing YAP targets (identified in Fig. 3D and Fig. S3B) than in all other human genes known to bind FOXM1 and TEAD (2,481 genes), we performed a Fisher’s exact test (two-sided; P = 0.004943) and determined by odds ratio that these targets are 4.78 times more likely to have the adjacent peaks within 2 Kb than a randomly selected gene without this expression pattern. These results were based solely on published ChIP-seq data from ENCODE. Expanding the search to more remote distances away from TSS could yield additional adjacent TEAD/FOXM1 binding sites in the future. Furthermore, we sought to determine whether adjacent FOXM1 and TEAD binding sites were evolutionarily conserved by evaluating the promoter regions immediately upstream of BUBIB and PLK1 TSS in the murine genome. We found that the sites are present at this location in these murine targets at a distance of 150–300 bases apart (Fig. S5E), a distance similar to human loci, suggesting potential evolutionary conservation of this coregulation.
We validated these findings with independent ChIP analysis of a target with adjacent FOXM1/TEAD sites, BUB1B (Fig. 5G). FOXM1 and YAP antibodies successfully immunoprecipitated this region. Importantly, YAP knockdown abrogated both YAP and FOXM1 promoter interactions, indicating the existence of a YAP/TEAD/FOXM1 complex at a region encompassing both sites. These results, together with the IP data, strongly suggest that YAP/TEAD/FOXM1 complex binding at regulatory regions of genes governing cell cycle may impact cell proliferation.
FOXM1 Is Required for Sarcomagenesis in Vivo.
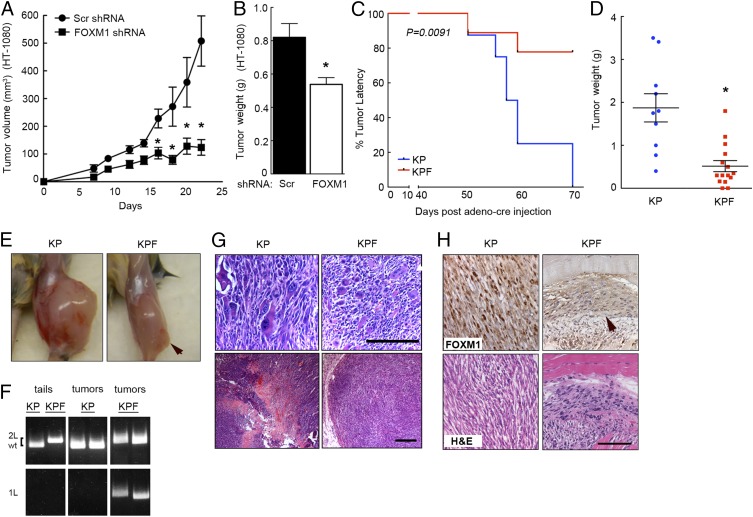
We evaluated the contribution of FOXM1 to sarcomagenesis in vivo using human HT-1080 s.c. tumors as well as a novel autochthonous murine model. Reduction of FOXM1 expression dramatically reduced the volume (Fig. 6A) and weight (Fig. 6B) of HT-1080 xenografts. To assess the requirement for FOXM1 during sarcoma initiation and progression in a physiological model that accurately recapitulates human disease, we conditionally deleted Foxm1 in our autochthonous KP murine system. We generated KrasG12D/+;Trp53fl/fl;Foxm1fl/fl (KPF) mice by crossing KP and Foxm1fl/fl animals. KPF mice developed very few tumors compared with KP (Fig. 6C), and the tumors that did form were significantly smaller (Fig. 6 D and E). We confirmed recombination at the Foxm1 locus in KPF tumors (Fig. 6F). Of note, KP tumors contained a heterogeneous population of multinucleated, irregular, and enlarged tumor cells compared with KPF tumors (Fig. 6G). Interestingly, many FOXM1 and YAP transcriptional targets are known to regulate the G2-M transition, which may be connected to these observed cellular phenotypes. We also confirmed the loss of FOXM1 protein levels in KPF tumors (Fig. 6H). The lack of FOXM1 expression in the existing KPF tumors suggests that FOXM1 may not be required for tumor initiation in this model, but is necessary for tumor growth and progression. Together, these data clearly indicate that FOXM1 promotes sarcomagenesis, making it an attractive target for therapeutic intervention in certain STS.
Fig. 6.
Foxm1 is required for sarcomagenesis in vivo. (A) FOXM1 expression was inhibited in HT-1080 cells, and 1 × 10⁶ cells were injected s.c. in a xenograft model. Reduction in FOXM1 expression significantly reduced tumor growth (n = 5 mice/10 tumors per group). *P < 0.05 (P < 0.04 at days 16, 18, and 20). (B) Tumor weight from xenografts in A was also decreased in FOXM1 knockdown cells. *P < 0.05 (P = 0.0091). (C) Autochthonous mouse model of UPS, KP was crossed with Foxm1fl/fl mice to create KPF animals. Foxm1 deletion significantly inhibited sarcomagenesis [n = 10 (KP); n = 15 (KPF); P = 0.0091]. (D) Tumor weight was dramatically decreased in KPF tumors compared with KP. *P < 0.05 (P = 0.0002). (E) Images of KP (Left) and KPF (Right) tumor-bearing mice. Arrow indicates tumor. (F) Genotyping of KP and KPF animals and tumors showing recombination at the Foxm1 locus in KPF tumors. (G) H&E images from KP and KPF tumors showing the prevalence of irregular and heterogeneous tumor cells in KP tumors, as well as the reduction in necrotic and stromal compartments due to Foxm1 deletion. (Scale bars: 100 μm.) (H) FOXM1 IHC and H&E of KP and KPF tumor sections showing that FOXM1 protein expression is lost in the small KPF tumors. Arrow indicates tumor. (Scale bar: 100 μm.)
FOXM1 Pharmacological Inhibition Decreases Cell Proliferation and Tumor Formation.
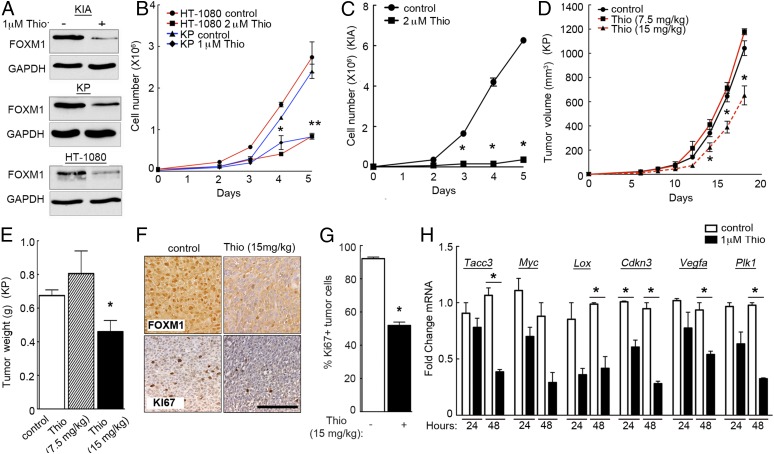
To investigate the potential of FOXM1 as a STS therapeutic target, we used a previously described inhibitor of FOXM1 expression, Thiostrepton (31). Thiostrepton is a proteasomal inhibitor that has been shown to decrease FOXM1 protein expression in multiple cancer cell types (31, 32). We found that Thiostrepton is indeed an effective inhibitor of FOXM1 protein accumulation (Fig. 7A), while having no effect on FOXM1 mRNA levels compared with shRNA-mediated inhibition (Fig. S5F). These findings are consistent with previous studies using Thiostrepton. Of note, we successfully decreased FOXM1 expression using 1 μM Thiostrepton, whereas in a breast cancer model 10 μM Thiostrepton was required to achieve similar levels of inhibition (33), suggesting that sarcoma cells may be particularly sensitive to this compound. FOXM1 inhibition significantly decreased sarcoma cell proliferation in vitro (Fig. 7 B and C), consistent with results obtained using FOXM1 shRNA (Fig. 4C). To determine whether FOXM1 could be an effective therapeutic target, we performed in vivo studies using lipid-encapsulated Thiostrepton micelles (as described in ref. 33), which allow for enhanced solubility and delivery of the drug. We treated nude mice bearing KP allograft tumors with vehicle control or 7.5 or 15 mg/kg micelle-encapsulated Thiostrepton retro-orbitally every third day for 2.5 wk. The higher of the two Thiostrepton doses significantly decreased tumor volume (Fig. 7D) and weight (Fig. 7E), while having no effect on overall animal health and activity. Lipid encapsulation of Thiostrepton increased solubility of the drug and provided a steady release of the molecule throughout the treatment period. Loss of FOXM1 reduced proliferation (Ki-67 IHC) (Fig. 7 F and G), consistent with loss of proliferation in YAP and FOXM1 shRNA-treated tumors. Thiostrepton treatment (48 h) also inhibited many of the same transcriptional targets sensitive to VP treatment, including Tacc3, Lox, Cdkn3, and Plk1 (Fig. 7H and Fig. S5G). These findings suggest that YAP inhibition via VP, and FOXM1 inhibition through Thiostrepton, have similar effects on transcriptional output in sarcoma cells. Together, these data indicate that FOXM1 inhibitors may be valuable tools for the treatment of a subset of sarcomas.
Fig. 7.
Thiostrepton-mediated FOXM1 inhibition decreases proliferation in vitro and in vivo. (A) Immunoblots of FOXM1 levels in KIA, KP, and HT-1080 cells upon 48 h of 1 μM Thiostrepton (Thio) or DMSO control (−) (n = 3). (B) Proliferation analysis of HT-1080 cells (red lines) treated with DMSO control or 2 μM Thiostrepton and KP cells (blue lines) treated with DMSO control or 1 μM Thiostrepton. *P < 0.05; double stars indicate that P values apply to both red and blue line (P = 4.5 × 10⁻⁵ at day 4 and P = 0.0007 at day 5 for HT-1080 cells; P = 0.0009 at day 5 for KP cells; n = 3; assays performed in triplicate). (C) Proliferation analysis of KIA cells treated with DMSO control or 2 μM Thiostrepton. *P < 0.05 (P = 0.00045 at day 3, P = 3.5 × 10⁻⁵ at day 4, and P = 1.7 × 10⁻⁶ at day 5; n = 3; assays performed in triplicate). (D) Tumor volume in a s.c. xenograft of KP cells treated with PBS control and 7.5 or 15 mg/kg micelle-encapsulated Thiostrepton (n = 9 mice for control tumors; n = 2 mice for 7.5 mg/kg treatment; n = 7 mice for 15 mg/kg treatment). *P < 0.05 (P = 0.024 at day 14, P = 0.013 at day 16, and P = 0.002 at day 18). (E) Tumor weights of KP xenografts from micelle-encapsulated Thiostrepton treatment in D. The 15 mg/kg Thiostrepton treatment resulted in a significant decrease in tumor weight compared with control-treated xenografts. *P < 0.05 (P = 0.0083). (F) IHC staining for FOXM1 and Ki67 in control and Thiostrepton (15 mg/kg) treated tumors from D and E at day 18. (G) Quantification of Ki-67–positive cells in control and Thiostrepton-treated (15 mg/kg) tumors (P = 2.5 × 10⁻²²). (Scale bar: 100 μm.) (H) mRNA levels of FOXM1 targets after 24 and 48 h of control DMSO or 1 μM Thiostrepton treatment. KP cells treated with 1 μM Thiostrepton showed decreases in FOXM1 target mRNA expression, including TACC3 (P = 0.010), LOX (P = 0.032), CDKN3 (P = 0.023 at 24 h and P = 0.0075 at 48 h), VEGFA (P = 0.030), and PLK1 (P = 0.00133). *P < 0.05 (n = 3; assays performed in triplicate).
Discussion
The Hippo pathway has been extensively studied in development and epithelial tumorigenesis [e.g., clear cell renal carcinoma, breast cancer, medulloblastomas, etc. (8)], although less is known about the role of Hippo and its downstream effector YAP in mesenchymal tumors. Recent studies reported that activated YAP promotes aRMS and eRMS, two rare STS subtypes that affect children and adolescents (23, 34). We confirmed that the Hippo pathway is deregulated in some human aRMS and eRMS tumors using CNV analyses. Many of the subtypes more commonly diagnosed in adults are discussed here as well, including UPS, fibrosarcoma, leiomyosarcoma, and dedifferentiated liposarcoma. These tumors bear more complex genetic profiles and are very poorly understood. We investigated the expression of key upstream Hippo pathway components (NF2, SAV1, MST1/2, and LATS1/2) in sarcoma patient samples and found that their corresponding genomic loci are at least partially lost in STS. Although it is currently unclear whether or not these genes are completely or partially deleted, we have shown that YAP expression and nuclear localization is increased in human UPS and an autochthonous mouse model of this disease. Increased YAP expression can also occur downstream of oncogenic RAS (35), further supporting the use of the KP model to investigate the role of YAP in STS. Importantly, YAP activity can also be modulated by Wnt signaling (36), which may be similarly deregulated in STS (37), indicating that YAP stimulation facilitates proliferation downstream of several independent pathways and highlighting its importance in STS. Moreover, YAP/TEAD-mediated FOXM1 expression seems critical for this process because the inability of YAP to control FOXM1 expression in SKLMS1 cells suppresses its effect on proliferation. However, overexpression of FOXM1 is not necessarily sufficient to activate transcription in sarcomas, because FOXM1 activation is controlled by oncogenic stimuli (i.e., Ras) and loss of tumor suppressors (i.e., p53, Arf) (17). Perturbation of these pathways is commonly observed in sarcomas (1, 38). Conditional Foxm1 deletion in the KP model dramatically reduces tumor burden, suggesting that FOXM1 serves as a transcriptional node connecting Hippo pathway inactivation with oncogenic stimuli/tumor suppressor loss in sarcoma (Fig. S6). Furthermore, we observed that FOXM1 functions not only downstream of YAP in some STS subtypes, but can also interact directly with YAP/TEAD to facilitate proliferation (Fig. 5 C–G). Together, these findings suggest that inhibiting the YAP/TEAD1/FOXM1 complex is an attractive avenue for therapeutic intervention in multiple mesenchymal tumors.
Fig. S6.
A model depicting potential mechanisms governing YAP-mediated control of FOXM1 and other pro-proliferation downstream targets.
Pharmacologic inhibition of transcription factor/coactivator complexes has been challenging due to a lack of “druggable” pockets in DNA–transcription factor binding. However, several proof-of-concept small molecules and peptides have been shown to inhibit FOXM1 or YAP. Because of biological inhibition by ARF, FOXM1 can be inhibited by a small synthetic ARF peptide (39). Additionally, FOXM1 expression is decreased by a class of thiopeptide antibiotics, including Thiostrepton, both in vitro and in vivo (33). Although less is known about compounds affecting YAP or TEAD, a 2012 screen for molecules disrupting the YAP/TEAD complex yielded the benzophyrin class of molecules as promising inhibitors (26). Among these, VP limits YAP/TEAD function possibly by binding YAP, modifying its structural confirmation to block YAP/TEAD association (26).
Currently there are no anticancer treatments specifically targeting YAP or FOXM1 in the clinic. VP is being used to treat macular degeneration under the trade name Visudyne, but its mechanism of action involves generation of reactive oxygen species for photodynamic therapy (40), rather than YAP inhibition. It may be worthwhile to investigate the use of VP, or related benzophyrin molecules, in YAP-driven tumors. However, it is generally accepted that impinging on a major upstream regulator can have a variety of unrelated targets and undesired outcomes, leading to cytotoxicity and patient side effects. Therefore, we focused on an essential downstream target that controls many YAP-dependent phenotypes, FOXM1. Thiostrepton successfully limited FOXM1-mediated tumorigenesis in an allograft sarcoma model, even at a relatively low dose of 15 mg/kg lipid-encapsulated drug, used due to technical limitations associated with retro-orbital injection. Therefore, FOXM1 inhibition represents a promising therapeutic target for sarcoma treatment, warranting further study and preclinical assessment of efficacy and off-target effects. Although Thiostrepton is not specific for FOXM1, our findings suggest that an unbiased screen to identify more selective inhibitors is desirable. Previous studies have shown that injection of cell-permeable ARF peptides effectively blocks FOXM1 and tumorigenesis in a model of HCC (39). Targeting these peptides for delivery to sarcoma cells may be an additional therapeutic approach.
One limitation of the current study is that primary tumorigenesis is seldom responsible for poor clinical outcome. In most sarcoma cases, metastatic disease burden is the principal cause of mortality. Although targeting the primary tumor should prevent metastatic progression in those patients diagnosed before micrometastatic dissemination, metastatic cells arising from YAP/FOXM1-driven sarcomas may also be sensitive to inhibition of this pathway. Further analysis of metastatic lesions is required to determine whether metastatic cells also rely on YAP/TEAD/FOXM1. Of note, YAP and FOXM1 clearly play a role in cell migration/invasion and metastasis in other contexts (41, 42), and, importantly, FOXM1 has been associated specifically with UPS metastasis (25). It will be interesting to determine whether YAP and FOXM1 coregulate metastatic progression beyond their control of proliferation in the primary tumor.
Although sarcomas comprise a heterogeneous and histopathologically diverse group of malignancies, our work indicates that the Hippo pathway is frequently altered in a subset of these tumors. We determined that this pathway is inactivated in nearly half of reported sarcomas in the TCGA database, spanning diverse STS tumors. In parallel, we observed that FOXM1 expression is elevated in multiple STS subtypes, including dedifferentiated liposarcoma, fibrosarcoma, leiomyosarcoma, and UPS, suggesting that some mechanisms may cross histological classifications. However, this finding cannot be universally applied to sarcoma. For example synovial sarcoma patient samples express heterogeneous levels of FOXM1. Together, our data indicate sarcoma classification based on molecular signatures, rather than solely on histopathology, should promote the development of therapeutics (i.e., FOXM1 inhibitors) that benefit the broadest possible, yet most accurate, cohort of patients.
Materials and Methods
Mouse Models.
All experiments were performed in accordance with NIH guidelines and were approved by the University of Pennsylvania Institutional Animal Care and Use Committee. Foxm1fl/fl mice were crossed with KP mice to create KPF mice. Foxm1fl/fl (43) and KP (22) mouse generation has been described. Tumors were generated by injection of a calcium phosphate precipitate of adenovirus expressing Cre recombinase (University of Iowa) into the right gastrocnemius muscle of 8- to 16-wk-old mice. Investigators conducted blind analysis of tumor weight. For s.c. transplant tumors, 1 × 10⁶ KP or HT-1080 cells were injected s.c. into the flanks of 6-wk-old nu/nu mice (Charles River Laboratories). Animals were euthanized within 30 d of injection. Volume was calculated by using the formula (ab2)π/6, where a is the longest measurement and b is the shortest.
Thiostrepton was encapsulated as described (33). Anesthetized mice were retro-orbitally injected with PBS or 7.5 or 15 mg/kg Thiostrepton-encapsulated micelles every third day for 3.5 wk.
Cell Culture, Drug Treatment, and Lentiviral Transduction.
HT-1080, SKLMS1, Rhabdo CCL-136, and HEK-293T cell lines were purchased from ATCC. Cell lines passaged in the laboratory for 6 mo or longer were authenticated by small tandem repeat analyses. (STR). HT-1080 and SKLMS1 cells were authenticated in May 2015. The Rhabdo CCL-136 cell line was derived from an embryonal rhabdomyosarcoma lacking t(2;13) and does not express PAX3–FKHR (44). This cell line was purchased from ATCC with valid STR in November 2014. KP and KIA cells were derived from KP and KIA tumors, as described in Eisinger-Mathason et al. (4), and their genotyping was verified in our laboratory. L246 cells were established from a human dedifferentiated liposarcoma by Dina Lev (Characterized Cell Line Core Facility, M. D. Anderson Cancer Center, Houston) as described (45). STR analysis was performed at the time of derivation and confirmed in April 2015. Cells were purchased, resuscitated, and then expanded in the laboratory. Multiple aliquots were frozen down within 10 d of initial resuscitation. For experimental use, aliquots were resuscitated and cultured for up to 20 passages (4–6 wk) before being discarded. Cells were cultured in DMEM with 10% (vol/vol) FBS and 1% penicillin/streptomycin. Cells were treated with 1–2 μM Thiostrepton or 1 μM VP (Sigma-Aldrich) in dimethyl sulfoxide, diluted in DMEM culture medium. VP was replenished every 24 h. For shRNA-mediated knockdown of Yap1, YAP1, Foxm1, and FOXM1 constructs in the pLKO.1 background vector were used (GE Lifesciences). Scramble shRNA was obtained from Addgene. shRNA plasmids were packaged by using the third-generation lentivector system (VSV-G, p-MDLG, and pRSV-REV) and expressed in HEK-293T cells. TRCN: Yap1:0000095864, 0000095867, 0000095868; YAP1: 0000107266, 0000107267, 0000107268; Foxm1:0000084776; and FOXM1: 0000015545, 0000015546, 0000015547. Supernatant was collected at 24 and 48 h after transfection and subsequently concentrated by using 10-kDa Amicon Ultra-15 centrifugal filter units (Millipore). Overexpression plasmids used were pPGS-3HA-TEAD1 (plasmid 33055; Addgene), pcDNA3-Flag-FOXM1 (M. J. Reginato, Drexel University, Philadelphia), and pcDNA3 was used as the empty vector control.
Statistical Analysis.
All statistical analyses were performed by using the GraphPad Prism software. Data are represented as mean ± SEM. Student’s t test was performed to establish whether a difference between two values is statistically significant, with statistical significance are defined as P < 0.05. In vitro experiments were performed two or three times. Statistical analyses were performed in consultation with the University of Pennsylvania biostatistics analysis center.
SI Materials and Methods
Immunoblots and qRT-PCR.
Protein lysate was prepared in SDS/Tris (pH 7.6) lysis buffer, separated by electrophoresis in 10% (wt/vol) SDS/PAGE gels, transferred to nitrocellulose membrane, and probed with the following antibodies: rabbit anti-YAP1 (4912; 1:1,000), rabbit anti-GAPDH (14C10; 1:2,000), rabbit anti-HA (C29F4; 1:1,000) (Cell Signaling Technology), and rabbit anti-FOXM1 (C20; 1:500) (Santa Cruz Biotechnology). Representative immunoblots from multiple independent experiments are presented. Total RNA was isolated from tissues and cells by using the RNeasy Mini Kit (Qiagen) or the TRIzol reagent protocol (Life Technologies). Reverse transcription of mRNA was performed by using the High-Capacity RNA-to-cDNA Kit (Life Technologies). qRT-PCR was performed by using a ViiA7 apparatus and Taq-Man “best coverage” primers (Life Technologies).
Immunostaining and Imaging.
Immunohistochemistry assays were performed on 5-μm sections according to standard protocols. The following antibody concentrations were used: YAP (4912; 1:100) (Cell Signaling Technology), FOXM1 (0.T.181; 1:100) (Novus Biologicals), Ki-67 (15580; 1:100), and TEAD1 [EPR3967(2); 1:100) (Abcam]. Images were taken by using a Leica 500 microscope and analyzed by using Photoshop CS3 (Adobe Systems). IHC of human sarcoma samples was performed by using core biopsy arrays (US Biomax) no. SO801a and SF961. Two independent pathologists, Xin Chen and Bo Du, evaluated these arrays. Every 10th section was reanalyzed for consistency. Paul Zhang, a certified sarcoma pathologist at the University of Pennsylvania, evaluated IHC stainings and confirmed both the diagnoses provided by US Biomax and our interpretation of the results.
Proliferation Assays.
For drug studies, cells were plated and incubated overnight in tissue culture dishes. The next day, the appropriate drug diluted in growth medium was added to the cells. Cells were trypsinized, resuspended in PBS, and counted daily for 4 d by using a hemocytometer. For shRNA studies, cells were incubated with virus for 48 h and then trypsinized and replated followed by daily counting for 4 d. Cells were analyzed for shRNA efficacy by immunoblot analysis or qRT-PCR.
IP.
HT-1080 cells were transiently transfected by using Fugene 6 (Life Technologies) with Flag-FOXM1 and either pcDNA3 vector control, V5-YAP, or HA-TEAD1 (8 μg total DNA). After 48 h of incubation, cells were washed with PBS, scraped, spun, and resuspended in (pH 7.6) lysis buffer containing 1% Triton-X and protease inhibitors. Equal amounts of input lysate were added to 75 μL of anti-Flag M2-coated magnetic beads (Sigma-Aldrich). Beads and lysate were incubated overnight with rocking at 4 °C. Beads were washed, and then boiling with loading buffer for 5 min eluted the protein. The sample was removed from the beads by magnetic separation and then run on a 10% (vol/vol) SDS/PAGE gel for immunoblot analysis. Endogenous IPs were performed by using magnetic Dynal sheep anti-rabbit M280 beads and the following antibodies; rabbit anti-FOXM1 (C20) (Santa Cruz Biotechnology) and rabbit anti-TEAD1 [EPR3967(2); 1:100] (Abcam).
Bioinformatics Analysis.
Level 3 data comprising regions/segments with altered copy number were downloaded from the TCGA Data portal (data last updated as of May 15, 2014 (https://tcga-data.nci.nih.gov/tcga/tcgaCancerDetails.jsp?diseaseType=SARC&diseaseName=Sarcoma). The data were queried by using the Partek software (Version 6.6). Briefly, sample files were lined up and concatenated. Subsequently, the thresholds for gain/loss of copy number were set at 0.55 and −0.4 for gain and loss, respectively. These cutoffs were based on published literature. Tumor samples for copy-number analysis consisted of 152 samples total, with 150 primary samples and 2 recurrences. The results obtained from blood samples and normal controls were eliminated from the analysis, because they contained no amplifications or deletions. Importantly, many groups use the cBioPortal website to assess copy-number changes. To reproduce our findings please take into consideration that cBioPortal is reporting only amplifications and homozygous deletions in their summary, whereas our query also identifies hemizygous copy-number loss. The presence of samples bearing hemizygous loss for a particular gene can also be found on cBioPortal under the “plots” tab. The Venn diagram was generated by using the BioVenn web application (www.cmbi.ru.nl/cdd/biovenn/). Oncomine data were downloaded through the Oncomine Research premium edition (Life Technologies) software (Version 4.5; https://www.oncomine.org) Sarcoma data were downloaded form microarrays associated with the Nakayama et al. (28) and Detwiller et al. (27) manuscripts. The rhabdomyosarcoma (aRMS and eRMS) dataset can found under Gene Expression Omnibus accession no. GSE28511. Oncomine analysis of hepatocellular and lung cancer were accessed from Roessler et al. (46) and Hou et al. (47).
ChIP.
ChIP assays were performed by using QuickChIP assay kits (Novus Biologicals). Briefly, 5 million HT-1080 cells were fixed in 1% formaldehyde for 10 min at 37 °C, and the reaction was stopped by glycine. Cells were washed, collected, and lysed by using SDS (pH 7.6) buffer containing protease inhibitor mixture and then sonicated into DNA fragments of 300–800 bp in size. Supernatants were diluted and precleared with salmon sperm DNA/protein A/G agarose, and a 10 μL aliquot was saved for input control. The rest of the sample was immunoprecipitated with 5 μg of the following antibodies overnight: rabbit anti-IgG, rabbit anti-YAP1 (4912; Cell Signaling Technology) and rabbit anti-FOXM1 (C20; Santa Cruz Biotechnology). Antibody–nucleoprotein complexes were recovered by incubating 60 μL of salmon sperm DNA/protein A/G agarose for 1 h at 4 °C with rotation. Beads were washed, and antibody–nucleoprotein complexes were eluted from protein A/G agarose beads in elution buffer, de-cross-linked by adding 20 μL of 5 M NaCl, and incubated at 65 °C. Subsequently, RNase A and proteinase K were added, and DNA fragments were purified by using QIAquick PCR purification kit (Qiagen). Semiquantitative PCR was performed with the following primers; BUB1B (forward) GCTCTCAAGAAATACCTGAGGCTG; and BUB1B (reverse) CTCTCTGGATCTATCTGAGCCTAT. The core consensus motif for TEAD1 was identified by using the JASPAR database (CATTC) and previously published studies (AGCATG) (48, 49). Primers were selected that would amplify a promoter region containing both sequences as well as a FOXM1 consensus binding motif. The FOXM1 consensus motif was identified from published work (ACAAACA) (50, 51).
Supplementary Material
Acknowledgments
We thank the following investigators for generously providing mouse strains: T. Jacks (Massachusetts Institute of Technology) for LSL-KrasG12D/+; A. Berns (Netherlands Cancer Institute) for Trp53fl/fl; R. DePinho (M. D. Anderson) for Ink4a/Arffl/fl; and P. Raychaudhuri (University of Illinois) for Foxm1fl/fl. We thank Fei Wan and Amy Praestgaard (Center for Clinical Epidemiology and Biostatistics, Biostatistics Analysis Center, University of Pennsylvania) for assistance with statistical analyses; and Dr. John Tobias (Molecular Profiling Facility, University of Pennsylvania) for assistance with bioinformatics. We also thank NCI;TCGA for access to the sarcoma dataset. This work was supported by National Cancer Institute (NCI) Grants F32 CA156979-01 and T32 CA009140-36 (to T.S.K.E.-M.); NCI Grant F31 CA174211-01 and a Patel Family Scholar Award (to V.M.); NCI Grant R01 CA138265 (to K.M.B., N.S., M.S.N., S.S.Y., and M.C.S.); the Howard Hughes Medical Institute (M.C.S.); and NCI Grant U54CA143868 (to K.M.P. and S.G.).
Footnotes
The authors declare no conflict of interest.
This article is a PNAS Direct Submission.
This article contains supporting information online at www.pnas.org/lookup/suppl/doi:10.1073/pnas.1420005112/-/DCSupplemental.
References
- 1.Taylor BS, et al. Advances in sarcoma genomics and new therapeutic targets. Nat Rev Cancer. 2011;11(8):541–557. doi: 10.1038/nrc3087. [DOI] [PMC free article] [PubMed] [Google Scholar]
- 2.Lauer S, Gardner JM. Soft tissue sarcomas—new approaches to diagnosis and classification. Curr Probl Cancer. 2013;37(2):45–61. doi: 10.1016/j.currproblcancer.2013.03.001. [DOI] [PubMed] [Google Scholar]
- 3.Kelleher FC, Viterbo A. Histologic and genetic advances in refining the diagnosis of “undifferentiated pleomorphic sarcoma”. Cancers (Basel) 2013;5(1):218–233. doi: 10.3390/cancers5010218. [DOI] [PMC free article] [PubMed] [Google Scholar]
- 4.Eisinger-Mathason TS, et al. Hypoxia-dependent modification of collagen networks promotes sarcoma metastasis. Cancer Discov. 2013;3(10):1190–1205. doi: 10.1158/2159-8290.CD-13-0118. [DOI] [PMC free article] [PubMed] [Google Scholar]
- 5.Linehan DC, Lewis JJ, Leung D, Brennan MF. Influence of biologic factors and anatomic site in completely resected liposarcoma. J Clin Oncol. 2000;18(8):1637–1643. doi: 10.1200/JCO.2000.18.8.1637. [DOI] [PubMed] [Google Scholar]
- 6.Pan D. The hippo signaling pathway in development and cancer. Dev Cell. 2010;19(4):491–505. doi: 10.1016/j.devcel.2010.09.011. [DOI] [PMC free article] [PubMed] [Google Scholar]
- 7.Zhang N, et al. The Merlin/NF2 tumor suppressor functions through the YAP oncoprotein to regulate tissue homeostasis in mammals. Dev Cell. 2010;19(1):27–38. doi: 10.1016/j.devcel.2010.06.015. [DOI] [PMC free article] [PubMed] [Google Scholar]
- 8.Harvey KF, Zhang X, Thomas DM. The Hippo pathway and human cancer. Nat Rev Cancer. 2013;13(4):246–257. doi: 10.1038/nrc3458. [DOI] [PubMed] [Google Scholar]
- 9.Sekido Y, et al. Neurofibromatosis type 2 (NF2) gene is somatically mutated in mesothelioma but not in lung cancer. Cancer Res. 1995;55(6):1227–1231. [PubMed] [Google Scholar]
- 10.Mizuno T, et al. YAP induces malignant mesothelioma cell proliferation by upregulating transcription of cell cycle-promoting genes. Oncogene. 2012;31(49):5117–5122. doi: 10.1038/onc.2012.5. [DOI] [PubMed] [Google Scholar]
- 11.Yoo NJ, Park SW, Lee SH. Mutational analysis of tumour suppressor gene NF2 in common solid cancers and acute leukaemias. Pathology. 2012;44(1):29–32. doi: 10.1097/PAT.0b013e32834c3599. [DOI] [PubMed] [Google Scholar]
- 12.Je EM, Choi YJ, Chung YJ, Yoo NJ, Lee SH. TEAD2, a Hippo pathway gene, is somatically mutated in gastric and colorectal cancers with high microsatellite instability. Acta Pathol Microbiol Immunol Scand. 2015;123(4):359–360. doi: 10.1111/apm.12327. [DOI] [PubMed] [Google Scholar]
- 13.Hélias-Rodzewicz Z, et al. YAP1 and VGLL3, encoding two cofactors of TEAD transcription factors, are amplified and overexpressed in a subset of soft tissue sarcomas. Genes Chromosomes Cancer. 2010;49(12):1161–1171. doi: 10.1002/gcc.20825. [DOI] [PubMed] [Google Scholar]
- 14.Seidel C, et al. Frequent hypermethylation of MST1 and MST2 in soft tissue sarcoma. Mol Carcinog. 2007;46(10):865–871. doi: 10.1002/mc.20317. [DOI] [PubMed] [Google Scholar]
- 15.Kim JE, Finlay GJ, Baguley BC. The role of the hippo pathway in melanocytes and melanoma. Front Oncol. 2013;3:123. doi: 10.3389/fonc.2013.00123. [DOI] [PMC free article] [PubMed] [Google Scholar]
- 16.Zhao B, Tumaneng K, Guan KL. The Hippo pathway in organ size control, tissue regeneration and stem cell self-renewal. Nat Cell Biol. 2011;13(8):877–883. doi: 10.1038/ncb2303. [DOI] [PMC free article] [PubMed] [Google Scholar]
- 17.Wierstra I. FOXM1 (Forkhead box M1) in tumorigenesis: Overexpression in human cancer, implication in tumorigenesis, oncogenic functions, tumor-suppressive properties, and target of anticancer therapy. Adv Cancer Res. 2013;119:191–419. doi: 10.1016/B978-0-12-407190-2.00016-2. [DOI] [PubMed] [Google Scholar]
- 18.Kalinichenko VV, et al. Foxm1b transcription factor is essential for development of hepatocellular carcinomas and is negatively regulated by the p19ARF tumor suppressor. Genes Dev. 2004;18(7):830–850. doi: 10.1101/gad.1200704. [DOI] [PMC free article] [PubMed] [Google Scholar]
- 19.Pandit B, Halasi M, Gartel AL. p53 negatively regulates expression of FoxM1. Cell Cycle. 2009;8(20):3425–3427. doi: 10.4161/cc.8.20.9628. [DOI] [PubMed] [Google Scholar]
- 20.Wierstra I, Alves J. Transcription factor FOXM1c is repressed by RB and activated by cyclin D1/Cdk4. Biol Chem. 2006;387(7):949–962. doi: 10.1515/BC.2006.119. [DOI] [PubMed] [Google Scholar]
- 21.Halasi M, Gartel AL. FOX(M1) news—it is cancer. Mol Cancer Ther. 2013;12(3):245–254. doi: 10.1158/1535-7163.MCT-12-0712. [DOI] [PMC free article] [PubMed] [Google Scholar]
- 22.Kirsch DG, et al. A spatially and temporally restricted mouse model of soft tissue sarcoma. Nat Med. 2007;13(8):992–997. doi: 10.1038/nm1602. [DOI] [PubMed] [Google Scholar]
- 23.Crose LE, et al. Alveolar rhabdomyosarcoma-associated PAX3-FOXO1 promotes tumorigenesis via Hippo pathway suppression. J Clin Invest. 2014;124(1):285–296. doi: 10.1172/JCI67087. [DOI] [PMC free article] [PubMed] [Google Scholar]
- 24.Tremblay AM, et al. The Hippo transducer YAP1 transforms activated satellite cells and is a potent effector of embryonal rhabdomyosarcoma formation. Cancer Cell. 2014;26(2):273–287. doi: 10.1016/j.ccr.2014.05.029. [DOI] [PubMed] [Google Scholar]
- 25.Mito JK, et al. Cross species genomic analysis identifies a mouse model as undifferentiated pleomorphic sarcoma/malignant fibrous histiocytoma. PLoS ONE. 2009;4(11):e8075. doi: 10.1371/journal.pone.0008075. [DOI] [PMC free article] [PubMed] [Google Scholar]
- 26.Liu-Chittenden Y, et al. Genetic and pharmacological disruption of the TEAD-YAP complex suppresses the oncogenic activity of YAP. Genes Dev. 2012;26(12):1300–1305. doi: 10.1101/gad.192856.112. [DOI] [PMC free article] [PubMed] [Google Scholar]
- 27.Detwiller KY, et al. Analysis of hypoxia-related gene expression in sarcomas and effect of hypoxia on RNA interference of vascular endothelial cell growth factor A. Cancer Res. 2005;65(13):5881–5889. doi: 10.1158/0008-5472.CAN-04-4078. [DOI] [PubMed] [Google Scholar]
- 28.Nakayama R, et al. Gene expression analysis of soft tissue sarcomas: Characterization and reclassification of malignant fibrous histiocytoma. Mod Pathol. 2007;20(7):749–759. doi: 10.1038/modpathol.3800794. [DOI] [PubMed] [Google Scholar]
- 29.Zhao B, et al. TEAD mediates YAP-dependent gene induction and growth control. Genes Dev. 2008;22(14):1962–1971. doi: 10.1101/gad.1664408. [DOI] [PMC free article] [PubMed] [Google Scholar]
- 30.Mossing MC, Record MT., Jr Upstream operators enhance repression of the lac promoter. Science. 1986;233(4766):889–892. doi: 10.1126/science.3090685. [DOI] [PubMed] [Google Scholar]
- 31.Bhat UG, Halasi M, Gartel AL. FoxM1 is a general target for proteasome inhibitors. PLoS ONE. 2009;4(8):e6593. doi: 10.1371/journal.pone.0006593. [DOI] [PMC free article] [PubMed] [Google Scholar]
- 32.Halasi M, Gartel AL. A novel mode of FoxM1 regulation: Positive auto-regulatory loop. Cell Cycle. 2009;8(12):1966–1967. doi: 10.4161/cc.8.12.8708. [DOI] [PubMed] [Google Scholar]
- 33.Wang M, Gartel AL. Micelle-encapsulated thiostrepton as an effective nanomedicine for inhibiting tumor growth and for suppressing FOXM1 in human xenografts. Mol Cancer Ther. 2011;10(12):2287–2297. doi: 10.1158/1535-7163.MCT-11-0536. [DOI] [PMC free article] [PubMed] [Google Scholar]
- 34.Parham DM, Ellison DA. Rhabdomyosarcomas in adults and children: An update. Arch Pathol Lab Med. 2006;130(10):1454–1465. doi: 10.5858/2006-130-1454-RIAACA. [DOI] [PubMed] [Google Scholar]
- 35.Zhang W, et al. Downstream of mutant KRAS, the transcription regulator YAP is essential for neoplastic progression to pancreatic ductal adenocarcinoma. Sci Signal. 2014;7(324):ra42. doi: 10.1126/scisignal.2005049. [DOI] [PMC free article] [PubMed] [Google Scholar]
- 36.Azzolin L, et al. YAP/TAZ incorporation in the β-catenin destruction complex orchestrates the Wnt response. Cell. 2014;158(1):157–170. doi: 10.1016/j.cell.2014.06.013. [DOI] [PubMed] [Google Scholar]
- 37.Vijayakumar S, et al. High-frequency canonical Wnt activation in multiple sarcoma subtypes drives proliferation through a TCF/β-catenin target gene, CDC25A. Cancer Cell. 2011;19(5):601–612. doi: 10.1016/j.ccr.2011.03.010. [DOI] [PMC free article] [PubMed] [Google Scholar]
- 38.Sasaki K, Hitora T, Nakamura O, Kono R, Yamamoto T. The role of MAPK pathway in bone and soft tissue tumors. Anticancer Res. 2011;31(2):549–553. [PubMed] [Google Scholar]
- 39.Gusarova GA, et al. A cell-penetrating ARF peptide inhibitor of FoxM1 in mouse hepatocellular carcinoma treatment. J Clin Invest. 2007;117(1):99–111. doi: 10.1172/JCI27527. [DOI] [PMC free article] [PubMed] [Google Scholar]
- 40.Michels S, Schmidt-Erfurth U. Photodynamic therapy with verteporfin: A new treatment in ophthalmology. Semin Ophthalmol. 2001;16(4):201–206. doi: 10.1076/soph.16.4.201.10298. [DOI] [PubMed] [Google Scholar]
- 41.Lamar JM, et al. The Hippo pathway target, YAP, promotes metastasis through its TEAD-interaction domain. Proc Natl Acad Sci USA. 2012;109(37):E2441–E2450. doi: 10.1073/pnas.1212021109. [DOI] [PMC free article] [PubMed] [Google Scholar]
- 42.Lok GT, et al. Aberrant activation of ERK/FOXM1 signaling cascade triggers the cell migration/invasion in ovarian cancer cells. PLoS ONE. 2011;6(8):e23790. doi: 10.1371/journal.pone.0023790. [DOI] [PMC free article] [PubMed] [Google Scholar]
- 43.Kalinichenko VV, et al. Haploinsufficiency of the mouse Forkhead Box f1 gene causes defects in gall bladder development. J Biol Chem. 2002;277(14):12369–12374. doi: 10.1074/jbc.M112162200. [DOI] [PubMed] [Google Scholar]
- 44.Massuda ES, et al. Regulated expression of the diphtheria toxin A chain by a tumor-specific chimeric transcription factor results in selective toxicity for alveolar rhabdomyosarcoma cells. Proc Natl Acad Sci USA. 1997;94(26):14701–14706. doi: 10.1073/pnas.94.26.14701. [DOI] [PMC free article] [PubMed] [Google Scholar]
- 45.Peng T, et al. An experimental model for the study of well-differentiated and dedifferentiated liposarcoma; deregulation of targetable tyrosine kinase receptors. Lab Invest. 2011;91(3):392–403. doi: 10.1038/labinvest.2010.185. [DOI] [PMC free article] [PubMed] [Google Scholar]
- 46.Roessler S, et al. A unique metastasis gene signature enables prediction of tumor relapse in early-stage hepatocellular carcinoma patients. Cancer Res. 2010;70(24):10202–10212. doi: 10.1158/0008-5472.CAN-10-2607. [DOI] [PMC free article] [PubMed] [Google Scholar]
- 47.Hou J, et al. Gene expression-based classification of non-small cell lung carcinomas and survival prediction. PLoS ONE. 2010;5(4):e10312. doi: 10.1371/journal.pone.0010312. [DOI] [PMC free article] [PubMed] [Google Scholar]
- 48.Mahoney WM, Jr, Hong JH, Yaffe MB, Farrance IK. The transcriptional co-activator TAZ interacts differentially with transcriptional enhancer factor-1 (TEF-1) family members. Biochem J. 2005;388(Pt 1):217–225. doi: 10.1042/BJ20041434. [DOI] [PMC free article] [PubMed] [Google Scholar]
- 49.Jiang SW, Desai D, Khan S, Eberhardt NL. Cooperative binding of TEF-1 to repeated GGAATG-related consensus elements with restricted spatial separation and orientation. DNA Cell Biol. 2000;19(8):507–514. doi: 10.1089/10445490050128430. [DOI] [PubMed] [Google Scholar]
- 50.Chen X, et al. The forkhead transcription factor FOXM1 controls cell cycle-dependent gene expression through an atypical chromatin binding mechanism. Mol Cell Biol. 2013;33(2):227–236. doi: 10.1128/MCB.00881-12. [DOI] [PMC free article] [PubMed] [Google Scholar]
- 51.Sengupta A, Kalinichenko VV, Yutzey KE. FoxO1 and FoxM1 transcription factors have antagonistic functions in neonatal cardiomyocyte cell-cycle withdrawal and IGF1 gene regulation. Circ Res. 2013;112(2):267–277. doi: 10.1161/CIRCRESAHA.112.277442. [DOI] [PMC free article] [PubMed] [Google Scholar]


