

Abstract
Combination antiretroviral therapy transformed human immunodefiency virus (HIV)‐infection from a terminal illness to a manageable condition, but these patients remain at a significantly elevated risk of developing cognitive impairments and the mechanisms are not understood. Some previous neuroimaging studies have found hyperactivation in frontoparietal networks of HIV‐infected patients, whereas others reported aberrations restricted to sensory cortices. In this study, we utilize high‐resolution structural and neurophysiological imaging to determine whether alterations in brain structure, function, or both contribute to HIV‐related cognitive impairments. HIV‐infected adults and individually matched controls completed 3‐Tesla structural magnetic resonance imaging (sMRI) and a mechanoreception task during magnetoencephalography (MEG). MEG data were examined using advanced beamforming methods, and sMRI data were analyzed using the latest voxel‐based morphometry methods with DARTEL. We found significantly reduced theta responses in the postcentral gyrus and increased alpha activity in the prefrontal cortices of HIV‐infected patients compared with controls. Patients also had reduced gray matter volume in the postcentral gyrus, parahippocampal gyrus, and other regions. Importantly, reduced gray matter volume in the left postcentral gyrus was spatially coincident with abnormal MEG responses in HIV‐infected patients. Finally, left prefrontal and postcentral gyrus activity was correlated with neuropsychological performance and, when used in conjunction, these two MEG findings had a sensitivity and specificity of over 87.5% for HIV‐associated cognitive impairment. This study is the first to demonstrate abnormally increased activity in association cortices with simultaneously decreased activity in sensory areas. These MEG findings had excellent sensitivity and specificity for HIV‐associated cognitive impairment, and may hold promise as a potential disease marker. Hum Brain Mapp 36:897–910, 2015. © 2014 Wiley Periodicals, Inc.
Keywords: HIV‐associated neurocognitive disorder, cognitive disorders, biomarker, AIDS, magnetoencephalography, oscillation
INTRODUCTION
Combination antiretroviral therapy (cART) has shifted the nature of human immunodefiency virus (HIV)‐infection from a terminal illness to a chronic manageable condition with a life expectancy that has gradually approached that of seronegative persons [Antiretroviral Therapy Cohort Collaboration, 2008; Nakagawa et al., 2013]. However, HIV‐infected patients remain at a significantly increased risk of developing HIV‐associated neurocognitive disorders (HAND), with 35–70% of all patients (treated and untreated) exhibiting at least subtle impairments on tests of neuropsychological function [Antinori et al., 2007; Cysique and Brew, 2009; Gannon et al., 2011; Heaton et al., 2010, 2011; Robertson et al., 2007; Sacktor et al., 2002; Simioni et al., 2010; Tozzi et al., 2007]. Patients with HAND are more likely to be unemployed, have greater problems with medication adherence, and have lower quality of life [Albert et al., 1995; Heaton et al., 1994, 2004; Kaplan et al., 1995; Marcotte et al., 2004; van Gorp et al., 1999]. Thus, the economic and societal burdens of HIV/AIDS are accentuated by cases of HAND.
Recent structural magnetic resonance imaging (sMRI) studies of patients with mild to moderate HAND have shown volumetric reductions in neocortical regions of the frontal, parietal, and temporal lobes, as well as subcortical structures and the cerebellum [Cardenas et al., 2009; Cohen et al., 2010; Jernigan et al., 2011; Letendre et al., 2010; Thompson et al., 2005]. sMRI studies have also found abnormally reduced white matter volume, increased ventricular volume, and evidence that progressive gray matter volume losses in HIV‐infected patients continue for at least 2 years following cART initiation [Cardenas et al., 2009; Cohen et al., 2010]. However, although these studies have suggested a degenerative course, the overall impact of these processes on neuronal function is less clear. Several functional MRI (fMRI) studies have investigated neural activation during strenuous working memory and attention tasks in uninfected controls and HIV‐infected patients with and without HAND. These studies have shown that HIV‐infected patients exhibit greater activation and/or larger load‐dependent increases in activation relative to uninfected controls within the prefrontal and parietal regions that serve task performance [Chang et al., 2001, 2004, 2008; Ernst et al., 2002, 2009]. In other words, the amplitude of neural responses in these brain areas monotonically increased as task difficulty increased in HIV‐infected patients (impaired and unimpaired) while controls exhibited decreased activation with increasing task difficulty, likely due to practice effects [Chang et al., 2001, 2004, 2008; Ernst et al., 2009]. These findings may indicate that HIV‐infected patients have decreased proficiency in such tasks, which requires them to use compensatory processing for successful performance. However, it must be noted that these activation differences (HIV‐infected > controls) have been almost entirely restricted to the association cortices (e.g., prefrontal, parietal, etc.), and other work has shown that the opposite pattern (HIV‐infected < controls) may exist in primary sensory regions. Essentially, Ances et al. have shown decreased activation in occipital cortices during a visual stimulation task using fMRI, and reduced resting cerebral‐blood‐flow to the same visual regions using arterial spin labeling (ASL‐MRI) in HIV‐infected patients relative to uninfected controls [Ances et al., 2011, 2009, 2010]. These studies focused on occipital cortices and did not directly evaluate activity in association areas, which complicates any direct comparison to the fMRI investigations that examined working memory and attention [Chang et al., 2001, 2004, 2008; Ernst et al., 2002, 2009]. In summary, some neuroimaging studies of HIV‐infection have shown abnormal hyperactivation in the association cortices and others have found aberrant hypoactivation in modality‐specific regions, but no studies have demonstrated both patterns of activation in the same group of HIV‐infected patients. Likewise, some sMRI investigations have found gray matter reductions to be much more severe in the primary sensory regions of HIV‐infected patients [Thompson et al., 2005], whereas others have found structural abnormalities to be more widespread in association cortices [Cardenas et al., 2009].
In this study, we utilized a multimodal neuroimaging approach to examine regional gray matter volume and cortical neurophysiological activity in a group of HIV‐infected patients and a matched group of older uninfected controls. Specifically, high‐density magnetoencephalography (MEG) was used to quantify neural oscillatory activity during a mechanoreceptor stimulation task. MEG is a noninvasive and direct measure of neurophysiological activity with excellent temporal resolution and good spatial precision. The method quantifies the minute magnetic fields that naturally emanate from electrical activity in populations of active neurons. MEG data were transformed into the time‐frequency domain, and significant oscillatory responses were imaged using advanced beamformer methodology. In addition, we conducted voxel‐based morphometry (VBM) using the latest methods (e.g., DARTEL) on high‐resolution 3T sMRI data, which generated regional gray matter volume measures that could be examined statistically to identify brain areas with significant between‐group volumetric disparities. Our primary goals in this study were to determine whether hypoactivation in modality specific regions and hyperactivation in association cortices, relative to uninfected controls, could be observed in a single group of HIV‐infected patients who were undergoing the same experiment during MEG. Moreover, we wanted to evaluate the spatial overlap between structural abnormalities and deficits in neuronal function in a group of HIV‐infected patients who were chronically infected and receiving effective cART. Finally, we aimed to determine the sensitivity and specificity of our primary MEG indices for HAND. Based on the available neuroimaging literature, we hypothesized that HIV‐infected patients would exhibit hypoactivation in somatosensory cortices, hyperactivation in prefrontal association cortices, and have reduced gray matter volume in multiple brain regions.
MATERIALS AND METHODS
Participant Selection
We evaluated 17 HIV‐infected adults (4 females) and 17 uninfected healthy controls (4 females). Participants in the control group were individually matched to HIV‐infected participants in regards to age, sex, ethnicity, and handedness. At enrollment, all HIV‐infected participants were receiving cART and all but one had undetectable viremia (<20 copies/mL). Exclusionary criteria included any preexisting major psychiatric or neurological disorder, active brain infection (except HIV‐1), presence of brain neoplasm or space‐occupying lesion, history of head trauma, current substance abuse, and the MEG Laboratory's standard exclusion criteria (e.g., orthodontic braces, extensive dental work, ferromagnetic implants, pacemakers, etc.). Written informed consent was obtained following the guidelines of the University of Nebraska Medical Center's Institutional Review Board, who reviewed and approved the study protocol.
Neuropsychological Assessments
All HIV‐infected participants completed a battery of neuropsychological tests to evaluate overall cognitive functioning; published normative data were used for comparison purposes [Heaton et al., 2004]. This battery was sensitive, tested multiple domains, yet was relatively brief, and adhered to the recommendations of the Frascati consensus [Antinori et al., 2007]. The battery assessed multiple functional domains, including gross motor (timed gait), fine motor (grooved pegboard), language (WRAT 4 reading), verbal learning and memory (Hopkins Verbal Learning Test – Revised; HVLT‐R), speed of processing (Trailmaking‐A, digit symbol), attention and working memory (Paced Auditory Serial Addition Task), and executive functioning (verbal fluency, Stroop, and Trailmaking‐B). All raw scores were transformed to demographically‐adjusted z‐scores for the assessment of HAND and the neurobehavioral correlation analyses (see Table 1). These correlations were conducted on a subset of the neuropsychological metrics and the MEG data (see below), with the selection of this subset being done a priori based on the distribution of scores across participants and the cognitive domain probed by individual measures.
Table 1.
Clinical and demographic characteristics
| Group | Sex | Age | CD4 count | CD4 nadir | WRAT 4 reading | Timed gait | HVLT‐R total recall | HVLT‐R delayed recall | HVLT‐R retention | Trailmaking A/B | Pegboard D/ND | Verbal fluency | Digit symbol | Stroop color | Stroop word | Stroop interfer. | PASAT‐A |
|---|---|---|---|---|---|---|---|---|---|---|---|---|---|---|---|---|---|
| P | M | 60 | 969 | 22 | 0.6 | −1.7 | −3 | −3 | −3 | 1/2.5 | −0.2/0.7 | 1.3 | 0.3 | −0.6 | 0.0 | 0.4 | −3.7 |
| P | M | 61 | 347 | 225 | 0.9 | 0.3 | −0.9 | −1.5 | −1.6 | −1/0.7 | −0.8/−0.5 | −0.8 | −0.7 | 0.7 | −0.7 | 1.6 | 0.4 |
| P | M | 54 | 806 | 193 | 2.1 | −0.9 | 1.4 | 1.1 | 0.5 | 0.6/1.1 | 0.5/0.5 | −1.3 | 1.3 | 0.1 | 0.5 | 0.7 | 0.0 |
| P | M | 53 | 560 | 148 | −0.1 | −0.6 | −2 | −1.8 | 0.6 | −2.1/−0.7 | 0.1/0.1 | −1 | −0.3 | −1.4 | −1.7 | −1.9 | −2.5 |
| P | M | 54 | 1111 | 269 | 2.1 | 0.5 | 0.4 | 0.5 | −0.2 | −0.6/0.9 | 0.2/1 | −0.4 | 0.7 | 0.3 | −0.1 | 1.2 | 2.2 |
| P | F | 53 | 356 | 27 | −0.1 | −2.6 | −1.7 | −1.2 | 0.6 | −0.4/0.6 | −2.1/−1.9 | 0.7 | 0.7 | −0.8 | −1.4 | 0.7 | −0.8 |
| P | M | 63 | 749 | 194 | 2.3 | −2.9 | −0.8 | −1.8 | −1.8 | −1.5/−0.9 | −0.9/−1.4 | −0.3 | −1.7 | −0.4 | −0.4 | 0.5 | 1.8 |
| P | F | 69 | 1114 | 428 | −0.5 | 0.0 | 1 | 1 | 0.2 | 0.8/1.3 | 1.4/0 | 0.9 | −1.0 | −0.7 | −0.8 | −0.3 | −0.2 |
| P | M | 55 | 857 | 33 | −0.7 | −0.6 | −3 | −2.7 | −1.8 | 0.5/0 | 0.6/0 | −1 | −1.3 | −1.2 | −2.2 | −1.7 | −7.8 |
| P | M | 50 | 807 | 185 | 0.3 | −2.6 | −1.2 | −2.9 | −3 | 0/−0.6 | 0.4/0.3 | −0.2 | 1.0 | 0.1 | −0.5 | 0.4 | 1.2 |
| P | M | 70 | 280 | 46 | 1.5 | 0.3 | −0.8 | −2.1 | −2.7 | −0.2/1.6 | 0.2/−0.3 | 1.5 | 0.7 | 0.5 | 0.7 | −0.2 | −1.2 |
| P | F | 53 | 784 | 283 | 0.7 | −0.5 | −3 | −1.8 | 0.6 | 1.3/1 | 0.5/0.3 | 1.3 | 1.0 | −1.1 | −0.9 | −0.3 | − |
| P | M | 50 | 451 | 0 | 2.3 | −0.8 | −0.2 | 0 | 0.6 | 0.7/2.7 | 0.2/1 | 1 | 0.7 | 0.0 | 0.5 | 0.1 | −2.7 |
| P | F | 50 | 1391 | 149 | −0.5 | −5.2 | 0 | −1.2 | −2.2 | 0.3/−0.6 | −0.6/−0.8 | 0.3 | 0.0 | −0.8 | −0.4 | −3.0 | −3.2 |
| P | M | 59 | 844 | 361 | 0.6 | −0.5 | 0.5 | 1.1 | 0.5 | 0/−0.3 | −1.2/−0.4 | −1.1 | 0.0 | −1.3 | 0.0 | −1.2 | −3.2 |
| P | M | 59 | 562 | 214 | 2.6 | −2.4 | −1.6 | −1.5 | −0.3 | 0.3/0.4 | −0.9/−1.3 | −0.2 | 0.7 | −0.3 | 0.3 | −0.7 | −0.1 |
| P | M | 53 | 723 | 279 | 2.3 | −1.7 | 0.1 | −0.6 | −1.5 | −0.4/−1.5 | 0/0.3 | −0.6 | 0.0 | −0.8 | 0.3 | −1.0 | − |
| C | F | 63 | |||||||||||||||
| C | M | 58 | |||||||||||||||
| C | M | 55 | |||||||||||||||
| C | M | 67 | |||||||||||||||
| C | F | 56 | |||||||||||||||
| C | F | 57 | |||||||||||||||
| C | M | 58 | |||||||||||||||
| C | M | 53 | |||||||||||||||
| C | M | 56 | |||||||||||||||
| C | M | 56 | |||||||||||||||
| C | M | 50 | |||||||||||||||
| C | F | 53 | |||||||||||||||
| C | M | 51 | |||||||||||||||
| C | M | 68 | |||||||||||||||
| C | M | 60 | |||||||||||||||
| C | M | 52 | |||||||||||||||
| C | M | 69 |
Units: Age: years‐old; CD4 Count and CD4 Nadir: cells/mm3; All Neuropsychological Tests: Demographically‐Adjusted Z‐Scores. Abbreviations: P: HIV‐Infected Patient; C: Healthy Control; WRAT 4: Wide Range Achievement Test Version 4; HVLT‐R: Hopkins Verbal Learning Test–Revised; Pegboard D/ND: Pegboard Dominant Hand/Nondominant Hand; Stroop Interfer.: Stroop Color‐Word Interference; PASAT‐A: Paced Auditory Serial Addition Test – Series A.
Experimental Paradigm
Throughout the experiment, participants were seated in a custom chair within the magnetically‐shielded room (MSR) with their head positioned in the helmet‐shaped MEG sensor array. Participants were instructed to remain still with both arms resting on a tray attached to the chair body while a unilateral tactile stimulation was applied to the pad of the second digit of the right hand using a small airbladder (see Fig. 1). For each participant, more than 140 trials were collected using an interstimulus interval that varied randomly between 3.0 and 5.5 s.
Figure 1.
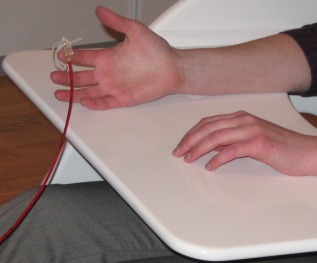
Tactile stimulation device. Participants were seated in a custom MEG chair with both arms resting on a tray attached to the chair body. Mechanoreceptors within the pad of the second digit of the right hand were stimulated using a small airbladder that was encased in plastic housing and clipped onto the index finger. A plastic red hose connected the airbladder to a pneumatic delivery system that was located outside the MSR. [Color figure can be viewed in the online issue, which is available at http://wileyonlinelibrary.com.]
Structural Magnetic Resonance Imaging
High‐resolution neuroanatomic images were acquired using a Philips Achieva 3T X‐series scanner. The T1‐weighted sagittal images were obtained with an eight channel head coil using a 3D fast field echo sequence with the following parameters: TR = 8.1 ms; TE = 3.7 ms; field of view: 24 cm; matrix: 256 × 256; slice thickness: 1 mm with no gap; in‐plane resolution: 0.9375 × 0.9375 mm; sense factor: 1.5. The structural volumes were used for MEG coregistration and analyses of local gray matter volume using VBM.
Voxel‐Based Morphometry
Structural MRI data were analyzed using the Statistical Parametric Mapping software (SPM8; Wellcome Trust Centre for Neuroimaging, http://www.fil.ion.ucl.ac.uk) and the VBM8 toolbox (http://dbm.neuro.uni-jena.de/vbm.html). Within the same generative model, images were corrected for magnetic field inhomogeneities and noise, and tissue was classified into gray matter, white matter, and cerebrospinal fluid. Tissue segmentation was enhanced by accounting for partial volume effects [Tohka et al., 2004] and by applying adaptive maximum a posteriori estimations [Rajapakse et al., 1997]. The segmentation procedure also benefitted from two denoising methods; the spatially adaptive nonlocal means denoising filter [Manjón et al., 2010], which removes noise while preserving edges, and the classical Markov random field approach, which incorporates spatial prior information of adjacent voxels into the segmentation estimation [Rajapakse et al., 1997]. The resulting gray matter image was then spatially normalized using the DARTEL algorithm (Diffeomorphic Anatomical Registration Through Exponentiated Lie algebra; part of the VBM8 toolbox), which involves linear transformation (12 parameter affine) and high dimensional warping [Ashburner, 2007].
The warped gray matter images were divided by the nonlinear components (but not the linear components) derived from the normalization matrix. This step functions to preserve the actual gray matter values locally, while accounting for individual differences in overall brain size via proportional scaling. In other words, this method of modulating the gray matter images allows one to derive the absolute volume of local tissue (i.e., gray matter), corrected for individual differences in brain size. These modulated gray matter volume images were smoothed with a Gaussian kernel of 8 mm full‐width at half maximum, and examined statistically using a mass univariate approach based on the general linear model. Essentially, a two sample t‐test was conducted on each voxel in the brain to examine local gray matter volume differences. To avoid possible edge effects between different tissue types, all voxels with gray matter values <0.1 were excluded (absolute threshold masking). Statistical results were thresholded at P < 0.001 and adjusted for multiple comparisons using a spatial extent threshold (cluster restriction), which was calculated directly from the data according to the theory of Gaussian random fields. Clusters showing significant between‐group differences were described using the automated anatomical labeling template in Montreal Neurological Institute (MNI) space [Tzourio‐Mazoyer et al., 2002].
MEG Data Acquisition and sMRI Coregistration
All recordings were conducted in a one‐layer MSR with active shielding engaged. With an acquisition bandwidth of 0.1–330 Hz, neuromagnetic responses were sampled continuously at 1 kHz using an Elekta Neuromag system with 306 magnetic sensors, including 204 planar gradiometers and 102 magnetometers (Elekta, Helsinki, Finland). Using MaxFilter (v2.1.15; Elekta), MEG data from each participant were individually corrected for head motion and subjected to noise reduction using the signal space separation method with a temporal extension [tSSS; Taulu et al., 2005; Taulu and Simola, 2006].
Prior to MEG measurement, four coils were attached to the participant's head and the locations of these coils, together with the three fiducial points and scalp surface, were determined with a 3‐D digitizer (Fastrak 3SF0002, Polhemus Navigator Sciences, Colchester, VT). Once the participant was positioned for MEG recording, an electric current with a unique frequency label (e.g., 322 Hz) was fed to each of the coils. This induced a measurable magnetic field and allowed each coil to be localized in reference to the sensors throughout the recording session. As coil locations were also known in head coordinates, all MEG measurements could be transformed into a common coordinate system. With this coordinate system (including the scalp surface points), each participant's MEG data was coregistered with their native space T1‐weighted sMRI data for source space analyses. sMRI data were aligned parallel to the anterior and posterior commissures and were later transformed into standard space using BESA MRI (Version 2.0; BESA GmbH, Gräfelfing, Germany).
MEG Preprocessing, Time‐Frequency Transformation, and Statistics
Cardio‐artifacts were removed from the data using signal‐space projection and the projection operator was accounted for during source reconstruction [Uusitalo and Ilmoniemi, 1997]. Artifact rejection was based on a fixed threshold method, supplemented with visual inspection. Epochs were of 1.3 s duration (−0.6 to 0.7 s), with 0.0 s defined as stimulation onset and the baseline being the −0.5 to 0.0 s window. For each participant, at least 115 artifact‐free epochs remained for further analysis.
Artifact‐free epochs were transformed into the time‐frequency domain using complex demodulation [resolution: 2.0 Hz, 25 ms; Hoechstetter et al., 2004; Papp and Ktonas, 1977], and the resulting spectral power estimations per sensor were averaged over trials to generate time‐frequency plots of mean spectral density. These data were normalized by dividing the power value of each predetermined time‐frequency bin by the respective bin's baseline power, which was calculated as the mean power during the −0.5 to 0.0 s time period. This normalization allowed task‐related power changes to be readily visualized in sensor space.
The specific time‐frequency windows used for imaging were determined by statistical analysis of the spectrograms corresponding to each of the 204 gradiometer‐type sensors. The spectrograms of each group were examined separately because we have previously shown that HIV‐infected and uninfected participants can exhibit strong neural responses in opposing directions [i.e., increases versus decreases; Wilson et al., 2013a]. Such responses would not be detectable in an across‐group statistical analysis. Each data point in the spectrogram was initially evaluated using a mass univariate approach based on the general linear model. To reduce the risk of false positive results while maintaining reasonable sensitivity, a two stage procedure was followed to control for Type 1 error. In the first stage, one‐sample t‐tests were conducted on each data point and the output spectrogram of t‐values was thresholded at P < 0.05 to define time‐frequency bins containing potentially significant oscillatory deviations across participants in each group. In stage two, time‐frequency bins that survived the threshold were clustered with temporally and/or spectrally neighboring bins that were also above the (P < 0.05) threshold, and a cluster value was derived by summing all of the t‐values of all data points in the cluster. Nonparametric permutation testing was then used to derive a distribution of cluster‐values and the significance level of the observed clusters (from stage one) was tested directly using this distribution [Ernst, 2004; Maris and Oostenveld, 2007]. For each comparison, at least 10,000 permutations were computed to build a distribution of cluster values. Based on these analyses, the time‐frequency windows that contained significant oscillatory events in each group were derived and subjected to the beamforming analysis. The two time‐frequency bins of interest (see Results) were each significant in a cluster of neighboring gradiometers. We defined the precise time‐frequency parameters using the single sensor with the highest t‐value, but the results would have been identical had we used any of the gradiometers surrounding the peak sensor.
MEG Source Imaging and Statistics
Using the time‐frequency windows determined by the analysis described above, cortical networks were imaged through an extension of the linearly constrained minimum variance vector beamformer [Gross et al., 2001; Liljeström et al., 2005; van Veen et al., 1997], which uses spatial filters in the frequency domain to calculate source power for the entire brain volume. The single images are derived from the cross spectral densities of all combinations of MEG sensors averaged over the time‐frequency range of interest, and the solution of the forward problem for each location on a grid specified by input voxel space. Following convention, the source power in these images was normalized per participant using a separately averaged prestimulus noise period of equal duration and bandwidth [van Veen et al., 1997]. In principle, the beamformer operator generates a spatial filter for each grid point, which passes signals without attenuation from the given neural region while minimizing interference from activity in all other brain areas. The properties of these filters are determined from the MEG covariance matrix and the forward solution for each grid point in the image space, which are used to allocate sensitivity weights to each sensor in the array for each voxel in the brain [for a review, see Hillebrand et al., 2005]. MEG preprocessing and imaging used the Brain Electrical Source Analysis software (BESA version 6.0; BESA GmbH, Gräfelfing, Germany).
Normalized source power was computed for the selected frequency bands over the entire brain volume per participant at 4.0 × 4.0 × 4.0 mm resolution. Prior to statistical analysis, each participant's functional images, which were coregistered to native space neuroanatomical images for beamforming, were transformed into standardized space using the transform previously applied to the structural MRI volume and spatially resampled. The resulting 3D maps of brain activity were statistically evaluated using a mass univariate approach based on the general linear model. Briefly, the effect of group was examined using a random effects analysis for the time‐frequency bins of interest, whereas one‐sample t‐tests were conducted to probe activation patterns in each group. All output statistical maps were displayed as a function of alpha level.
RESULTS
Participant Demographics, Laboratory Test, and Neuropsychological Results
Mean age was 56.82 years‐old (range: 50–70) in the HIV‐infected group and 57.77 years‐old (range: 50–69) in the control group. This difference did not approach significance (P = 0.65; Table 1). The mean duration of HIV diagnosis was 17.12 years (range: 9–24), and the average length of antiretroviral treatment was 13.35 years (range: 4–21). The mean CD4+ T‐cell count was 748 cells/mm3 (range: 280–1391) at the time of study and the mean CD4+ nadir was 180 cells/mm3 (range: 0–428). One participant had a viral load of 281 copies/mL and all other participants had undetectable viremia. Of the 17 HIV‐infected participants, nine scored in the impaired range on at least two domains of the neurocognitive battery [Antinori et al., 2007].
VBM Analyses of Gray Matter Volume
Statistical results were thresholded at P < 0.001 and adjusted for multiple comparisons using a spatial extent threshold (i.e., k = 71), which was calculated directly from the data based on the theory of Gaussian random fields within the SPM8 framework. As shown in Figure 2, comparison of regional gray matter volumes revealed a significant group effect in multiple brain regions. Specifically, HIV‐infected participants had significantly reduced gray matter volume compared to controls in the left postcentral gyrus, left parahippocampal and lingual gyri, left middle temporal area (near the occipitotemporal notch), right lingual gyrus, right cerebellum, and inferior aspects of the right postcentral gyrus (Table 2). In contrast, the reverse comparison (HIV‐infected > uninfected) yielded no significant voxels indicating that HIV‐infected participants did not have more regional gray matter in any brain region compared to controls.
Figure 2.
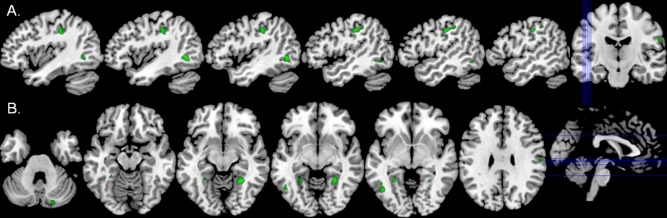
Gray matter volume reductions in HIV‐infected participants. (A) HIV‐infected patients had significantly reduced gray matter volume relative to uninfected controls in the left postcentral gyrus (green areas; P < 0.001, corrected). This area of reduced gray matter spatially overlapped with the maximal postcentral gyrus MEG response in HIV‐infected patients (Fig. 3, middle panel). (B) Significantly reduced gray matter volume was also found in the right cerebellum, left parahippocampal gyrus, bilateral lingual gyri, left middle temporal area near the occipitotemporal notch, and an area of the right postcentral gyrus. Lines in the orthogonal image (far right) indicate the placement of shown sagittal (top) and axial (bottom) slices in the volume. All images are shown in neurological convention (left = left) and at the same threshold (P < 0.001, corrected). [Color figure can be viewed in the online issue, which is available at http://wileyonlinelibrary.com.]
Table 2.
Voxel‐based morphometry (VBM): peak coordinates
| Effect | Anatomical label | MNI coordinates (x,y,z) | t‐value | ||
|---|---|---|---|---|---|
| Group effect: | Left postcentral gyrus | −48 | −20 | 40 | 4.31 |
| HIV‐infected < controls | Left middle temporala | −44 | −60 | 1 | 4.94 |
| Left lingual gyrus | −27 | −49 | −5 | 4.18 | |
| Left parahippocampal | −29 | −43 | −7 | 4.02 | |
| Right lingual gyrus | 26 | −49 | −9 | 4.82 | |
| Right cerebellum crus 1 | 21 | −84 | −26 | 5.22 | |
| Right postcentral gyrus | 62 | −13 | 27 | 3.84 | |
| Group effect: | No significant clusters | ||||
| HIV‐infected > controls | |||||
All peaks were significant at P < 0.001, cluster‐corrected
Near the occipitotemporal notch.
MEG Sensor‐Based Time‐Frequency Analyses
Sensor level spectrograms were statistically examined using nonparametric permutation testing to derive the precise time‐frequency bins for follow up beamforming analyses. The results showed significant (P < 0.05; corrected) theta oscillatory responses in a subset of gradiometers near the left sensorimotor cortex in each group, which stretched from 4–8 Hz during the 0.01 to 0.26 s time window (0.0 s = stimulation onset). In addition, uninfected participants exhibited significant oscillatory activity in the alpha/low‐beta band (8–14 Hz) during the same 0.01 to 0.26 s time window (P < 0.05; corrected), which was concentrated in MEG sensors near the left prefrontal region. These time‐frequency bands, and a window of equal bandwidth and duration from the baseline period, were independently imaged using beamforming to derive the spatial location of significant oscillatory responses associated with tactile stimulation.
MEG Beamforming Analyses
Theta activity (4–8 Hz)
Stimulation on the pad of the second digit of the right hand produced a sharp increase in 4–8 Hz neural activity in the left postcentral gyrus of each group. These neural responses were stronger and more consistent in uninfected controls compared to HIV‐infected participants, which resulted in a stronger task effect in control participants (Fig. 3). In each group, the peak voxel was posterior and slightly lateral to the motor hand knob feature of the left precentral gyrus [Yousry et al., 1997], which is consistent with activity in neural populations serving mechanoreception of the right hand, and near the area of reduced gray matter volume in HIV‐infected participants. The group effect showed significantly weaker 4–8 Hz activity in the left postcentral gyrus of HIV‐infected participants; see Figure 3 for a P‐map of group differences (peak MNI coordinates: −51, −21, 50).
Figure 3.
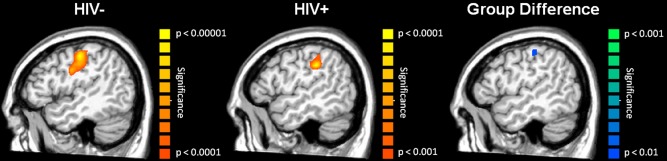
Significant theta (4–8 Hz) neuronal activity following tactile stimulation to the right hand. Uninfected controls (left) and HIV‐infected participants (middle) exhibited robust activity in the left postcentral gyrus in response to mechanoreceptor stimulation, with neural activity being stronger and more consistent in uninfected controls (notice different scale for P‐values). The group effect (right image; Controls > HIV‐infected participants) was restricted to a small area of the left somatosensory cortex, and no brain areas had stronger 4–8 Hz activity in HIV‐infected participants. [Color figure can be viewed in the online issue, which is available at http://wileyonlinelibrary.com.]
Alpha activity (8–14 Hz)
Uninfected participants had strongly decreased alpha activity within the left prefrontal cortex during the 0.10 to 0.26 s time window (Fig. 4; P < 0.001; corrected), whereas HIV‐infected participants exhibited increased alpha in this same brain region. Thus, neural responses were in the opposite direction across groups and this gave rise to a significant group effect of greater alpha activity in HIV‐infected participants (Fig. 4; P < 0.001, corrected; peak MNI coordinates: −49, 34, 13).
Figure 4.
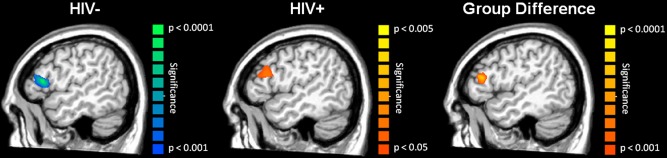
Prefrontal Alpha (8–14 Hz) Abnormalities in HIV‐infected Participants. Uninfected controls showed a strong decrease in local alpha activity in the left prefrontal cortex (left) during the 0.01 – 0.26 s time window, whereas HIV‐infected participants exhibited a small increase in alpha activity in this same brain region (middle) and time window. Thus, these neural responses were in the opposite direction across groups, which gave rise to a strong group effect of higher alpha activity in the HIV‐infected participants (right panel). Notice the different scales for P‐values across images. These data and Figure 3 highlight the distinct nature of HIV‐associated abnormalities in the primary sensory and association cortices. [Color figure can be viewed in the online issue, which is available at http://wileyonlinelibrary.com.]
Sensitivity and Specificity of MEG Responses
To calculate the sensitivity and/or specificity of a test, a binary outcome is required (i.e., positive or negative) which is problematic for continuous experimental measures like MEG. Essentially, one must first establish a cutoff score or threshold, and then use this to categorize individual participants as positive or negative on the particular test. For this study, we extracted the peak voxel amplitude value of each participant in the brain areas where significant group differences were observed in the 4–8 Hz (left postcentral gyrus) and 8–14 Hz (left prefrontal cortex) oscillatory responses. We then derived the mean value for each neural response using these peak voxels across all 34 participants and separately across the 17 HIV‐infected participants, and used these values to calculate the sensitivity and specificity for HIV‐infection and HIV‐associated cognitive impairment, respectively.
Initially, we examined the sensitivity and specificity of MEG measures to HIV‐infection. Our goal in performing this calculation was simply to evaluate whether there were subthreshold neurological changes associated with HIV‐infection that could be detected with MEG, but not with neuropsychological testing. For the left postcentral gyrus theta response, the sensitivity and specificity for HIV‐infection were both 76.5%. For left prefrontal alpha activity, the sensitivity and specificity for HIV‐infection were both 82.4%. Next, we evaluated the utility of using the two MEG responses in conjunction by defining a “hit” as abnormal activity on both measures (i.e., left postcentral gyrus and prefrontal cortex). Using this combined approach, the sensitivity to HIV‐infection was 88.2% (i.e., 2 false negatives) and the specificity was 100% (i.e., no false positives).
We also calculated the sensitivity and specificity of our MEG findings for cognitive impairment (i.e., HAND) using data from HIV‐infected participants only. For the 4–8 Hz left postcentral gyrus response, the sensitivity for cognitive impairment was 77.8% and the specificity was 62.5%. For the left prefrontal response, the sensitivity was 66.7% and the specificity was 62.5%. Finally, using the two MEG responses in conjunction and defining a “hit” as abnormal activity on both, we found that the sensitivity for HAND was 88.9% (i.e., 1 false‐negative) and the specificity was 87.5% (i.e., 1 false‐positive).
Neuropsychological Metrics, Age, CD4, and MEG Correlations
We conducted a series of Pearson‐correlation analyses to examine possible relationships between MEG measures of neural activity, VBM measures of local gray matter volume, age, duration of HIV‐infection (i.e., time since diagnosis), CD4+ T‐cell count at the time of study and nadir, duration of antiretroviral treatment, and neuropsychological metrics in HIV‐infected participants. To this end, we used the peak voxel value in each brain region where significant group differences were found for MEG and VBM metrics, and the demographically‐adjusted participant scores on neuropsychological assessments of memory function (delayed‐recall and retention indices of the HVLT‐R), fine motor control (dominant hand score of Grooved Pegboard task), speed of processing (digit symbol), and executive functioning (color‐word interference time on the Stroop task). The selection of this subset of tests was done a priori based on the distribution of scores across participants and the cognitive domain probed by each assessment. All statistical tests were two‐tailed and, since these analyses were restricted to brain regions where significant group differences were observed, we did not correct P‐values for multiple comparisons (e.g., using the Bonferroni method).
Performance on the digit symbol task was correlated with the peak amplitude of theta responses in the left postcentral gyrus, r(17) = 0.61 (P < 0.01) in HIV‐infected participants (see Fig. 5). Likewise, the peak amplitude of alpha activity in the left prefrontal cortices was significantly correlated with performance on the delayed recall measure of the HVLT‐R, r(17) = −0.598 (P < 0.01), the retention index of the HVLT‐R, r(17) = −0.605 (P < 0.01), and the dominant hand score of the Grooved Pegboard test, r(17) = −0.684 (P < 0.001; Fig. 5). MEG indices did not correlate with performance on any other neuropsychological assessment, and VBM metrics did not correlate with scores on any neuropsychological scale. CD4+ T‐cell counts at the time of the MEG recording were not correlated with the amplitude of neural activity in the left postcentral gyrus or prefrontal cortex, nor the volume of local gray matter, but CD4+ nadir was significantly correlated with the amplitude of alpha activity in the left prefrontal cortex, r(17) = −0.63 (P < 0.01). In addition, the duration of HIV diagnosis, r(17) = −0.52 (P < 0.05) and the duration of antiretroviral treatment, r(17) = −0.57 (P < 0.05) were both correlated with the amplitude of theta activity in the left postcentral gyrus; although it should be noted that the durations of infection and treatment were themselves strongly correlated, r(17) = 0.70 (P < 0.01). Lastly, age was significantly correlated with the amplitude of activity in the left postcentral gyrus of uninfected controls, r(17) = −0.69 (P < 0.001), but not HIV‐infected participants (P = 0.34; Fig. 5).
Figure 5.
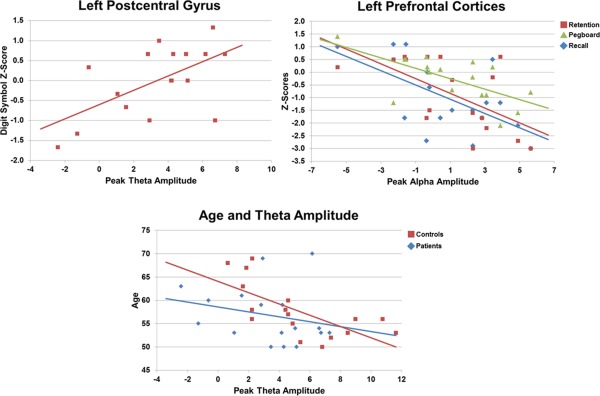
Correlation of MEG metrics with neuropsychological assessments and age. In all panels, scores on neuropsychological assessments are shown in demographically‐adjusted z‐scores. The amplitude of 4–8 Hz neural activity in the left postcentral gyrus was significantly (P < 0.01) correlated with performance on the Digit Symbol task in HIV‐infected participants (top‐left panel). There was also a significant (P < 0.01) negative correlation between prefrontal alpha activity and performance on the Grooved Pegboard task, and the retention and delayed‐recall indices of HVLT‐R in HIV‐infected participants (top‐right panel). In all cases, these correlations indicate that superior neuropsychological performance was associated with brain responses that were similar to those seen in controls. Finally, there was a significant negative correlation between age and response amplitude in the left postcentral gyrus of controls (P < 0.001; bottom panel), but not HIV‐infected participants (P = 0.34). The color legend for each panel appears on the top right. [Color figure can be viewed in the online issue, which is available at http://wileyonlinelibrary.com.]
DISCUSSION
We examined regional gray matter volume and cortical neurophysiological activity during a mechanoreceptor stimulation task in HIV‐infected older adults and a matched group of uninfected controls using multimodal neuroimaging. Our primary results indicated that HIV‐infected patients had significantly reduced neuronal responses in the modality‐specific left postcentral gyrus, and stronger oscillatory activity (8–14 Hz) in left prefrontal association regions compared to uninfected controls. These results were consistent with our primary hypothesis and were the first demonstration of functional abnormalities in both sensory and association cortices of a single HIV‐infected group, which is a critical contribution to the literature. HIV‐infected participants also had significantly reduced gray matter volume in several brain regions, including the left postcentral gyrus, left parahippocampal gyrus, bilateral lingual gyri, and other areas. Interestingly, the area of reduced gray matter in the left postcentral gyrus was spatially coincident with the maximal 4–8 Hz MEG response in the HIV‐infected group. Moreover, the amplitude of neural oscillatory activity in the left postcentral gyrus was positively correlated with scores on the digit symbol task in HIV‐infected patients, which indicates that superior digit symbol performance was associated with sensory responses that were more like controls. Meanwhile, oscillatory alpha activity in the left prefrontal region was negatively correlated with performance on memory measures of the HVLT‐R and scores on the grooved pegboard test in HIV‐infected participants, which again links better neuropsychological performance to neural activity like that seen in controls. Finally, we evaluated the sensitivity and specificity of our primary MEG metrics to HAND. These analyses showed that when used in conjunction, the amplitude of our two MEG metrics had excellent sensitivity (88.9%) and specificity (87.5%) for HAND. Below, we discuss the implications of these findings for understanding the pathophysiology of HAND and more generally for neuroimaging studies in HIV disease.
In response to mechanoreceptor stimulation, HIV‐infected patients exhibited significantly weaker theta (4–8 Hz) responses in the left postcentral gyrus and stronger alpha (8–14 Hz) activity in the left prefrontal cortices. To our knowledge, this is the first report of abnormal neuronal activity in the primary somatosensory cortices of HIV‐infected patients, although others have found reduced activity in primary visual and extrastriate cortices during visual stimulation [Ances et al., 2011, 2009, 2010]. Thus, diminished primary sensory responses are a consistent finding in the neuroAIDS literature and appear to stretch across multiple sensory systems. In this study, the peak postcentral gyrus response in HIV‐infected participants overlapped with an area of significantly reduced gray matter volume. This structural finding is consistent with a previous study that used cortical thickness analysis in HIV‐infected patients [Thompson et al., 2005], but how such structural abnormalities contribute to local differences in neuronal function remains unknown. Essentially, there is evidence that reduced gray matter volume is associated with greater fMRI activation during reading in dyslexic adults relative to normal readers [Casanova et al., 2007], as well as the reverse findings (i.e., positive correlation) of increased gray matter and fMRI hyperactivation in the somatosensory cortices of synaesthetes [Holle et al., 2013], and reduced gray matter and brain perfusion in the same brain areas of heroin addicts [Denier et al., 2013]. Our findings support a positive correlation between gray matter volume and local neural activity, but future studies will need to better characterize this relationship. Beyond sensory representations in the somatosensory cortex, we found increased alpha activity in the left prefrontal region in HIV‐infected patients compared with controls. This finding corroborates our previous study of motor planning networks [Wilson et al., 2013b], and is consistent with the fMRI studies showing abnormal hyperactivation during working memory and attention tasks in the prefrontal cortices of HIV‐infected patients [Chang et al., 2001, 2004, 2008; Ernst et al., 2002, 2009]. In regard to the role of this brain response in sensory processing, we propose that it reflects a decline of anticipation following the onset of mechanoreceptor stimulation. Basically, our interstimulus interval ranged from 3 to 5.5 s and this wide range likely caused participants to attend to the stimulation and actively expect the next onset. In controls, this resulted in a sharp decline of activity in the left prefrontal cortex following stimulus onset, which is consistent with our findings in this group. In contrast, HIV‐infected patients exhibited a moderate increase in prefrontal alpha shortly after stimulus onset (i.e., 0.01 to 0.26 s), which may reflect attention deficits and/or abnormal anticipatory responses. It is also plausible that reduced activity in the postcentral gyrus results in a poor stimulus registration, and that this prefrontal abnormality is a secondary effect due to prolonged local processing in somatosensory cortex and/or later transmission latency. In other words, lower sensory systems may transmit insufficient data about incoming stimuli to higher attention and working memory systems, which inherently degrades ongoing processing in these brain networks. Interestingly, we observed a strong negative correlation between alpha amplitude in the prefrontal cortices and performance on memory measures of the HVLT‐R and the grooved pegboard test (dominant hand). This correlation indicated that those with the weakest prefrontal alpha response had the best memory and grooved pegboard performance, which makes sense given the sharp decline in prefrontal alpha that was observed in controls.
HIV‐infected patients also had abnormal gray matter volumes in several brain regions relative to uninfected controls. As mentioned above, patients had reduced gray matter in the left postcentral gyrus, which spatially overlapped with their sensory MEG response, and areas of the right postcentral gyrus and cerebellum. Severe cerebellar atrophy in HIV‐infected rats [Abe et al., 1996] and humans [Klunder et al., 2008] has been previously shown and may contribute to the well known impairments in psychomotor skill. Our finding of reduced cerebellar volume in crus I of HIV‐infected patients is consistent with previous work [Klunder et al., 2008]. HIV‐infected patients also had significantly reduced gray matter volume in the left parahippocampal gyrus and bilateral lingual gyri. Like other medial temporal areas, these brain regions are known to be critical for memory formation and basic input–output memory functions [Bastin et al., 2013; Leshikar et al., 2012; Sulpizio et al., 2013]. Thus, these abnormalities may reflect the impaired performance that is commonly noted on memory scales of the HVLT‐R, which is a test known to be sensitive to HAND [Carey et al., 2004; Woods et al., 2005]. Similar structural abnormalities have been reported in HIV‐infected patients [Cardenas et al., 2009], although another study found no gray matter differences in this region [Thompson et al., 2005]. This discrepancy may reflect sample‐specific differences as patients in the Thompson study were significantly younger, had been diagnosed more recently, and only half were receiving cART at the time of study [Thompson et al., 2005]. Importantly, they found that parahippocampal gray matter was significantly correlated with cognitive impairment; those with the thinnest cortex in this region had the greatest impairments (Thompson et al.). Finally, HIV‐infected patients had reduced gray matter volume in a patch of cortex near the occipital temporal notch, which has been associated with language function in healthy adults [Wilson et al., 2005a, 2005b, 2007].
Although MEG investigations of HIV‐infection remain rare, the method has already shown substantial promise in biomarker development for HAND and this study provides further evidence and a major step toward this long term goal. In particular, each of our MEG metrics showed good sensitivity and specificity for HAND when used in isolation. Furthermore, when the two MEG metrics (i.e., peak amplitude of left postcentral gyrus and prefrontal cortices) were used in conjunction, the sensitivity and specificity for HAND climbed to 89% and 88%, respectively. These values are excellent and indicate that MEG metrics can serve as powerful classifiers in the context of HAND and HIV‐associated neural alterations. We propose that this specific conjunction analysis may capture the critical pattern of functional abnormalities that others have reported [i.e., hyperactivation in association cortices and hypoactivation in sensory areas; Chang et al., 2001, 2004, 2008; Ernst et al., 2002, 2009], and that this may underlie the superior classification accuracy. However, caution is warranted as our sample size, while reasonably large for a MEG study, is relatively small for analyses of sensitivity and specificity, which are more common in clinical trials where the sample size can reach into the hundreds or thousands. Importantly, there is also recent evidence that MEG measures have excellent test‐retest reliability after approximately 24 weeks in both HIV‐infected patients and controls [Becker et al., 2012a], which of course is a critical property for any biomarker of disease. Finally, MEG measures of functional connectivity during the resting state have also shown promise in distinguishing HIV‐infected and uninfected participants [Becker et al., 2012b], and combining connectivity measures with those used here could further improve MEG‐based classification. Collectively, these and other MEG studies [Becker et al., 2013] complement our findings and provide substantial support for the potential utility of MEG as a future test for HAND. Nonetheless, additional independent studies are clearly needed to buttress these initial findings and until then our results remain tentative.
In summary, we quantified cortical neurophysiological activity during mechanoreceptor stimulation using MEG, and regional gray matter volume using VBM in HIV‐infected patients and uninfected controls. Our primary findings were that HIV‐infected patients had reduced neuronal activity and gray matter volume in the left postcentral gyrus, and increased oscillatory alpha activity in the left prefrontal cortices relative to uninfected controls. These data support previous fMRI studies of HIV‐infection that showed hypoactivation in primary visual areas or hyperactivation in association areas, and are the first to demonstrate aberrations in both sensory and association cortices in the same study. Our MEG metrics were also tightly correlated with performance on neuropsychological assessments in HIV‐infected patients. Lastly, it is important to identify possible limitations in generalizing our findings to other HIV neuroimaging studies. All of our patients were receiving cART during the study, and at this time, the effects of antiretroviral therapy on the MEG signal are unknown. Another possible factor that may limit the generalizability of this study is that all of our patients had relatively high CD4+ counts, which may influence behavioral and imaging measurements. We also studied only older adults and our findings cannot be directly generalized to younger patients who may have been infected for a shorter period of time. Finally, our somatosensory task did not activate all brain regions where we identified deficits in gray matter volume, and consequently we cannot comment on neuronal function in these other brain areas. Future studies should use different cognitive tasks and investigate larger sample sizes with wider age ranges.
ACKNOWLEDGMENTS
The Center for Magnetoencephalography at the University of Nebraska Medical Center was founded through an endowment from an anonymous donor. The funders had no role in study design, data collection and analysis, decision to publish, or preparation of the manuscript.
REFERENCES
- Abe H, Mehraein P, Weis S (1996): Degeneration of the cerebellar dentate nucleus and the inferior olivary nuclei in the HIV‐1‐infected brains: A morphometric analysis. Acta Neuropathol 92:150–155. [DOI] [PubMed] [Google Scholar]
- Albert SM, Marder K, Dooneief G, Bell K, Sano M, Todak G, Stern Y (1995): Neuropsychologic impairment in early HIV infection. A risk factor for work disability. Arch Neurol 52:525–530. [DOI] [PubMed] [Google Scholar]
- Ances B, Vaida F, Ellis R, Buxton RB (2011): Test‐retest stability of calibrated BOLD‐fMRI in HIV‐ and HIV+ subjects. Neuroimage 54:2156–2162. [DOI] [PMC free article] [PubMed] [Google Scholar]
- Ances BM, Sisti D, Vaida F, Liang CL, Leontiev O, Perthen JE, Buxton RB, Benson D, Smith DM, Little SJ, Richman DD, Moore DJ, Ellis RJ; HNRC Group (2009): Resting cerebral blood flow: A potential biomarker of the effects of HIV in the brain. Neurology 73:702–708. [DOI] [PMC free article] [PubMed] [Google Scholar]
- Ances BM, Vaida F, Yeh MJ, Liang CL, Buxton RB, Letendre S, McCutchan JA, Ellis RJ (2010): HIV infection and aging independently affectbrain function as measured by functional magnetic resonance imaging. J Infect Dis 201:336–340. [DOI] [PMC free article] [PubMed] [Google Scholar]
- Antinori A, Arendt G, Becker JT, Brew BJ, Byrd DA, Cherner M, Clifford DB, Cinque P, Epstein LG, Goodkin K, Gisslen M, Grant I, Heaton RK, Joseph J, Marder K, Marra CM, McArthur JC, Nunn M, Price RW, Pulliam L, Robertson KR, Sacktor N, Valcour V, Wojna VE (2007): Updated research nosology for HIV‐associated neurocognitive disorders. Neurology 69:1789–1799. [DOI] [PMC free article] [PubMed] [Google Scholar]
- Antiretroviral Therapy Cohort Collaboration (2008): Life expectancy of individuals on combination antiretroviral therapy in high‐income countries: A collaborative analysis of 14 cohort studies. Lancet 372:293–299. [DOI] [PMC free article] [PubMed] [Google Scholar]
- Ashburner J (2007): A fast diffeomorphic image registration algorithm. Neuroimage 38:95–113. [DOI] [PubMed] [Google Scholar]
- Bastin J, Committeri G, Kahane P, Galati G, Minotti L, Lachaux JP, Berthoz A (2013): Timing of posterior parahippocampal gyrus activity reveals multiple scene processing stages. Hum Brain Mapp 34:1357–1370. [DOI] [PMC free article] [PubMed] [Google Scholar]
- Becker JT, Fabrizio M, Sudre G, Haridis A, Ambrose T, Aizenstein HJ, Eddy W, Lopez OL, Wolk DA, Parkkonen L, Bagic A (2012a): Potential utility of resting‐state magnetoencephalography as a biomarker of CNS abnormality in HIV disease. J Neurosci Methods 206:176–182. [DOI] [PMC free article] [PubMed] [Google Scholar]
- Becker JT, Bajo R, Fabrizio M, Sudre G, Cuesta P, Aizenstein HJ, Lopez OL, Wolk D, Parkkonen L, Maestu F, Bagic A (2012b): Functional connectivity measured with magnetoencephalography identifies persons with HIV disease. Brain Imaging Behav 6:366–373. [DOI] [PMC free article] [PubMed] [Google Scholar]
- Becker KM, Heinrichs‐Graham E, Fox HS, Robertson KR, Sandkovsky U, O'Neill J, Swindells S, Wilson TW (2013): Decreased MEG beta oscillations in HIV‐infected older adults during the resting state. J Neurovirol 19:586–594. [DOI] [PMC free article] [PubMed] [Google Scholar]
- Cardenas VA, Meyerhoff DJ, Studholme C, Kornak J, Rothlind J, Lampiris H, Neuhaus J, Grant RM, Chao LL, Truran D, Weiner MW (2009): Evidence for ongoing brain injury in human immunodeficiency virus‐positive patients treated with antiretroviral therapy. J Neurovirol 15:324–333. [DOI] [PMC free article] [PubMed] [Google Scholar]
- Carey CL, Woods SP, Rippeth JD, Gonzalez R, Moore DJ, Marcotte TD, Grant I, Heaton RK; HNRC Group (2004): Initial validation of a screening battery for the detection of HIV‐associated cognitive impairment. Clin Neuropsychol 18:234–248. [DOI] [PubMed] [Google Scholar]
- Casanova R, Srikanth R, Baer A, Laurienti PJ, Burdette JH, Hayasaka S, Flowers L, Wood F, Maldjian JA (2007): Biological parametric mapping: A statistical toolbox for multimodality brain image analysis. Neuroimage 34:137–143. [DOI] [PMC free article] [PubMed] [Google Scholar]
- Chang L, Speck O, Miller EN, Braun J, Jovicich J, Koch C, Koch C, Itti L, Ernst T (2001): Neural correlates of attention and working memory deficits in HIV patients. Neurology 57:1001–1007. [DOI] [PubMed] [Google Scholar]
- Chang L, Tomasi D, Yakupov R, Lozar C, Arnold S, Caparelli E, Ernst T (2004): Adaptation of the attention network in human immunodeficiency virus brain injury. Ann Neurol 56:259–272. [DOI] [PubMed] [Google Scholar]
- Chang L, Yakupov R, Nakama H, Stokes B, Ernst T (2008): Antiretroviral treatment is associated with increased attentional load‐dependent brain activation in HIV patients. J Neuroimmune Pharmacol 3:95–104. [DOI] [PMC free article] [PubMed] [Google Scholar]
- Cohen RA, Harezlak J, Schifitto G, Hana G, Clark U, Gongvatana A, Paul R, Taylor M, Thompson P, Alger J, Brown M, Zhong J, Campbell T, Singer E, Daar E, McMahon D, Tso Y, Yiannoutsos CT, Navia B (2010): Effects of nadir CD4 count and duration of human immunodeficiency virus infection on brain volumes in the highly active antiretroviral therapy era. J Neurovirol 16:25–32. [DOI] [PMC free article] [PubMed] [Google Scholar]
- Cysique LA, Brew BJ (2009): Neuropsychological functioning and antiretroviral treatment in HIV/AIDS: A review. [Review]. Neuropsychol Rev 19:169–185. [DOI] [PubMed] [Google Scholar]
- Denier N, Schmidt A, Gerber H, Schmid O, Riecher‐Rössler A, Wiesbeck GA, Huber CG, Lang UE, Radue EW, Walter M, Borgwardt S (2013): Association of frontal gray matter volume and cerebral perfusion in heroin addiction: A multimodal neuroimaging study. Front Psychiatry 4:135. [DOI] [PMC free article] [PubMed] [Google Scholar]
- Ernst MD (2004): Permutation methods: A basis for exact inference. Stat Sci 19:676–685. [Google Scholar]
- Ernst T, Chang L, Jovicich J, Ames N, Arnold S (2002): Abnormal brain activation on functional MRI in cognitively asymptomatic HIV patients. Neurology 59:1343–1349. [DOI] [PubMed] [Google Scholar]
- Ernst T, Yakupov R, Nakama H, Crocket G, Cole M, Watters M, Ricardo‐Dukelow ML, Chang L (2009): Declined neural efficiency in cognitively stable human immunodeficiency virus patients. Ann Neurol 65:316–325. [DOI] [PMC free article] [PubMed] [Google Scholar]
- Gannon P, Khan MZ, Kolson DL (2011): Current understanding of HIV‐associated neurocognitive disorders pathogenesis. [Review]. Curr Opin Neurol 24:275–283. [DOI] [PMC free article] [PubMed] [Google Scholar]
- Gross J, Kujala J, Hamalainen M, Timmermann L, Schnitzler A, Salmelin R (2001): Dynamic imaging of coherent sources: Studying neural interactions in the human brain. Proc Natl Acad Sci USA 98:694–699. [DOI] [PMC free article] [PubMed] [Google Scholar]
- Heaton RK, Velin RA, McCutchan JA, Gulevich SJ, Atkinson JH, Wallace MR, Godfrey HP, Kirson DA, Grant I (1994): Neuropsychological impairment in human immunodeficiency virus‐infection: Implications for employment. HNRC Group. HIV Neurobehavioral Research Center. Psychosom Med 56:8–17. [DOI] [PubMed] [Google Scholar]
- Heaton RK, Marcotte TD, Mindt MR, Sadek J, Moore DJ, Bentley H, McCutchan JA, Reicks C, Grant I; HNRC Group (2004): The impact of HIV‐associated neuropsychological impairment on everyday functioning. J Int Neuropsychol Soc 10:317–331. [DOI] [PubMed] [Google Scholar]
- Heaton RK, Miller SW, Taylor MJ, Grant I. (2004): Revised comprehensive norms for an expanded Halstead‐Reitan battery: Demographically adjusted neuropsychological norms for African American and Caucasian adults. Psychological Assessment Resources, New York.
- Heaton RK, Clifford DB, Franklin DR Jr, Woods SP, Ake C, Vaida F, Ellis RJ, Letendre SL, Marcotte TD, Atkinson JH, Rivera‐Mindt M, Vigil OR, Taylor MJ, Collier AC, Marra CM, Gelman BB, McArthur JC, Morgello S, Simpson DM, McCutchan JA, Abramson I, Gamst A, Fennema‐Notestine C, Jernigan TL, Wong J, Grant I; CHARTER Group (2010): HIV‐associated neurocognitive disorders persist in the era of potent antiretroviral therapy: CHARTER Study. Neurology 75:2087–2096. [DOI] [PMC free article] [PubMed] [Google Scholar]
- Heaton RK, Franklin DR, Ellis RJ, McCutchan JA, Letendre SL, Leblanc S, Corkran SH, Duarte NA, Clifford DB, Woods SP, Collier AC, Marra CM, Morgello S, Mindt MR, Taylor MJ, Marcotte TD, Atkinson JH, Wolfson T, Gelman BB, McArthur JC, Simpson DM, Abramson I, Gamst A, Fennema‐Notestine C, Jernigan TL, Wong J, Grant I; CHARTER Group ; HNRC Group (2011): HIV‐associated neurocognitive disorders before and during the era of combination antiretroviral therapy: Differences in rates, nature, and predictors. J Neurovirol 17:3–16. [DOI] [PMC free article] [PubMed] [Google Scholar]
- Hillebrand A, Singh KD, Holliday IE, Furlong PL, Barnes GR (2005): A new approach to neuroimaging with magnetoencephalography. Hum Brain Mapp 25:199–211. [DOI] [PMC free article] [PubMed] [Google Scholar]
- Hoechstetter K, Bornfleth H, Weckesser D, Ille N, Berg P, Scherg M (2004): BESA source coherence: A new method to study cortical oscillatory coupling. Brain Topogr 16:233–238. [DOI] [PubMed] [Google Scholar]
- Holle H, Banissy MJ, Ward J (2013): Functional and structural brain differences associated with mirror‐touch synaesthesia. Neuroimage 83:1041–1050. [DOI] [PubMed] [Google Scholar]
- Jernigan TL, Archibald SL, Fennema‐Notestine C, Taylor MJ, Theilmann RJ, Julaton MD, Notestine RJ, Wolfson T, Letendre SL, Ellis RJ, Heaton RK, Gamst AC, Franklin DR Jr, Clifford DB, Collier AC, Gelman BB, Marra C, McArthur JC, McCutchan JA, Morgello S, Simpson DM, Grant I; CHARTER Group (2011): Clinical factors related to brain structure in HIV: The CHARTER study. J Neurovirol 17:248–257. [DOI] [PMC free article] [PubMed] [Google Scholar]
- Kaplan RM, Anderson JP, Patterson TL, McCutchan JA, Weinrich JD, Heaton RK, Atkinson JH, Thal L, Chandler J, Grant I (1995): Validity of the Quality of Well‐Being Scale for persons with human immunodeficiency virus infection. HNRC Group. HIV Neurobehavioral Research Center. Psychosom Med 57:138–147. [DOI] [PubMed] [Google Scholar]
- Klunder AD, Chiang MC, Dutton RA, Lee SE, Toga AW, Lopez OL, Aizenstein HJ, Becker JT, Thompson PM (2008): Mapping cerebellar degeneration in HIV/AIDS. Neuroreport 19:1655–1659. [DOI] [PMC free article] [PubMed] [Google Scholar]
- Leshikar ED, Duarte A, Hertzog C (2012): Task‐selective memory effects for successfully implemented encoding strategies. PLoS One 7:e38160. [DOI] [PMC free article] [PubMed] [Google Scholar]
- Letendre SL, Ellis RJ, Ances BM, McCutchan JA (2010): Neurologic complications of HIV disease and their treatment. Top HIV Med 18:45–55. [PMC free article] [PubMed] [Google Scholar]
- Liljeström M, Kujala J, Jensen O, Salmelin R (2005): Neuromagnetic localization of rhythmic activity in the human brain: A comparison of three methods. Neuroimage 25:734–745. [DOI] [PubMed] [Google Scholar]
- Manjón JV, Coupé P, Martí‐Bonmatí L, Collins DL, Robles M (2010): Adaptive non‐local means denoising of MR images with spatially varying noise levels. J Magn Reson Imaging 31:192–203. [DOI] [PubMed] [Google Scholar]
- Marcotte TD, Wolfson T, Rosenthal TJ, Heaton RK, Gonzalez R, Ellis RJ, Grant I; HIV Neurobehavioral Research Center Group (2004): A multimodal assessment of driving performance in HIV infection. Neurology 63:1417–1422. [DOI] [PubMed] [Google Scholar]
- Maris E, Oostenveld R (2007): Nonparametric statistical testing of EEG‐ and MEG‐data. J Neurosci Methods 164:177–190. [DOI] [PubMed] [Google Scholar]
- Nakagawa F, May M, Phillips A (2013): Life expectancy living with HIV: Recent estimates and future implications. Curr Opin Infect Dis 26:17–25. [DOI] [PubMed] [Google Scholar]
- Papp N, Ktonas P (1977): Critical evaluation of complex demodulation techniques for the quantification of bioelectrical activity. Biomed Sci Instrum 13:135–143. [PubMed] [Google Scholar]
- Rajapakse JC, Giedd JN, Rapoport JL (1997): Statistical approach to segmentation of single‐channel cerebral MR images. IEEE Trans Med Imaging 16:176–186. [DOI] [PubMed] [Google Scholar]
- Robertson KR, Smurzynski M, Parsons TD, Wu K, Bosch RJ, Wu J, McArthur JC, Collier AC, Evans SR, Ellis RJ (2007): The prevalence and incidence of neurocognitive impairment in the HAART era. AIDS 21:1915–1921. [DOI] [PubMed] [Google Scholar]
- Sacktor N, McDermott MP, Marder K, Schifitto G, Selnes OA, McArthur JC, Stern Y, Albert S, Palumbo D, Kieburtz K, De Marcaida JA, Cohen B, Epstein L (2002): HIV‐associated cognitive impairment before and after the advent of combination therapy. J Neurovirol 8:136–142. [DOI] [PubMed] [Google Scholar]
- Simioni S, Cavassini M, Annoni JM, Rimbault Abraham A, Bourquin I, Schiffer V, Calmy A, Chave JP, Giacobini E, Hirschel B, Du Pasquier RA (2010): Cognitive dysfunction in HIV patients despite long‐standing suppression of viremia. AIDS 24:1243–1250. [DOI] [PubMed] [Google Scholar]
- Sulpizio V, Committeri G, Lambrey S, Berthoz A, Galati G (2013): Selective role of lingual/parahippocampal gyrus and retrosplenial complex in spatial memory across viewpoint changes relative to the environmental reference frame. Behav Brain Res 242:62–75. [DOI] [PubMed] [Google Scholar]
- Taulu S, Simola J (2006): Spatiotemporal signal space separation method for rejecting nearby interference in MEG measurements. Phys Med Biol 51:1759–1768. [DOI] [PubMed] [Google Scholar]
- Taulu S, Simola J, Kajola M (2005): Applications of the signal space separation method (SSS). IEEE Trans Signal Process 53:3359–3372. [Google Scholar]
- Thompson PM, Dutton RA, Hayashi KM, Toga AW, Lopez OL, Aizenstein HJ, Becker JT (2005): Thinning of the cerebral cortex visualized in HIV/AIDS reflects CD4+ T lymphocyte decline. Proc Natl Acad Sci USA 102:15647–15652. [DOI] [PMC free article] [PubMed] [Google Scholar]
- Tohka J, Zijdenbos A, Evans A (2004): Fast and robust parameter estimation for statistical partial volume models in brain MRI. Neuroimage 23:84–97. [DOI] [PubMed] [Google Scholar]
- Tozzi V, Balestra P, Bellagamba R, Corpolongo A, Salvatori MF, Visco‐Comandini U, Vlassi C, Giulianelli M, Galgani S, Antinori A, Narciso P (2007): Persistence of neuropsychologic deficits despite long‐term highly active antiretroviral therapy in patients with HIV‐related neurocognitive impairment: Prevalence and risk factors. J Acquir Immune Defic Syndr 45:174–182. [DOI] [PubMed] [Google Scholar]
- Tzourio‐Mazoyer N, Landeau B, Papathanassiou D, Crivello F, Etard O, Delcroix N, Mazoyer B, Joliot M (2002): Automated anatomical labeling of activations in SPM using a macroscopic anatomical parcellation of the MNI MRI single‐subject brain. Neuroimage 15:273–289. [DOI] [PubMed] [Google Scholar]
- Uusitalo M, Ilmoniemi R (1997): Signal‐space projection method for separating MEG or EEG into components. Med Biol Eng Comput 35:135–140. [DOI] [PubMed] [Google Scholar]
- van Gorp WG, Baerwald JP, Ferrando SJ, McElhiney MC, Rabkin JG (1999): The relationship between employment and neuropsychological impairment in HIV infection. J Int Neuropsychol Soc 5:534–539. [DOI] [PubMed] [Google Scholar]
- van Veen BD, van Drogelen W., Yuchtman M, Suzuki A (1997): Localization of brain electrical activity via linearly constrained minimum variance spatial filtering. IEEE Trans Biomed Eng 44:70–84. [DOI] [PubMed] [Google Scholar]
- Wilson TW, Leuthold AC, Lewis SM, Georgopoulos AP, Pardo PJ (2005a): Cognitive dimensions of orthographic stimuli affect occipitotemporal dynamics. Exp Brain Res 167:141–147. [DOI] [PMC free article] [PubMed] [Google Scholar]
- Wilson TW, Leuthold AC, Lewis SM, Georgopoulos AP, Pardo PJ (2005b): The time and space of lexicality: A neuromagnetic view. Exp Brain Res 162:1–13. [DOI] [PMC free article] [PubMed] [Google Scholar]
- Wilson TW, Leuthold AC, Moran JE, Pardo PJ, Lewis SM, Georgopoulos AP (2007): Reading in a deep orthography: Neuromagnetic evidence for dual‐mechanisms. Exp Brain Res 180: 247–262. [DOI] [PMC free article] [PubMed] [Google Scholar]
- Wilson TW, Fox HS, Robertson KR, Sandkovsky U, O'Neill J, Heinrichs‐Graham E, Knott NL, Swindells S (2013a): Abnormal MEG oscillatory activity during visual processing in the prefrontal cortices and frontal eye‐fields of the aging HIV brain. PLoS One 8:e66241. [DOI] [PMC free article] [PubMed] [Google Scholar]
- Wilson TW, Heinrichs‐Graham E, Robertson KR, Sandkovsky U, O'Neill J, Knott NL, Fox HS, Swindells S (2013b): Functional brain abnormalities during finger‐tapping in HIV‐infected older adults: A magnetoencephalography study. J Neuroimmune Pharmacol 8:965–974. [DOI] [PMC free article] [PubMed] [Google Scholar]
- Woods SP, Scott JC, Dawson MS, Morgan EE, Carey CL, Heaton RK, Grant I; HIV Neurobehavioral Research Center (HNRC) Group (2005): Construct validity of Hopkins Verbal Learning Test‐Revised component process measures in an HIV‐1 sample. Arch Clin Neuropsychol 20:1061–1071. [DOI] [PubMed] [Google Scholar]
- Yousry TA, Schmid UD, Alkadhi H, Schmidt D, Peraud A, Buettner A, Winkler P (1997): Localization of the motor hand area to a knob on the precentral gyrus: A new landmark. Brain 120:141–157. [DOI] [PubMed] [Google Scholar]