

Abstract
Key transcription factors control the gene expression program in mature pancreatic β-cells, but their integration into regulatory networks is little understood. Here, we show that Insm1, Neurod1 and Foxa2 directly interact and together bind regulatory sequences in the genome of mature pancreatic β-cells. We used Insm1 ablation in mature β-cells in mice and found pronounced deficits in insulin secretion and gene expression. Insm1-dependent genes identified previously in developing β-cells markedly differ from the ones identified in the adult. In particular, adult mutant β-cells resemble immature β-cells of newborn mice in gene expression and functional properties. We defined Insm1, Neurod1 and Foxa2 binding sites associated with genes deregulated in Insm1 mutant β-cells. Remarkably, combinatorial binding of Insm1, Neurod1 and Foxa2 but not binding of Insm1 alone explained a significant fraction of gene expression changes. Human genomic sequences corresponding to the murine sites occupied by Insm1/Neurod1/Foxa2 were enriched in single nucleotide polymorphisms associated with glycolytic traits. Thus, our data explain part of the mechanisms by which β-cells maintain maturity: Combinatorial Insm1/Neurod1/Foxa2 binding identifies regulatory sequences that maintain the mature gene expression program in β-cells, and disruption of this network results in functional failure.
Keywords: development, differentiation, Insm1, maturation, metabolisms, pancreatic beta cells
Introduction
During terminal differentiation of cells, gene expression programs are established that are then faithfully maintained throughout the lifetime of mature cells (Holmberg & Perlmann, 2012). The ontogeny of pancreatic β-cells, the insulin-secreting cells of the body, has been studied extensively, and a hierarchically controlled transcription factor network that determines β-cell specification and differentiation has been defined. Frequently, these transcription factors provide transient regulatory input, but a subset of them remains expressed during the lifetime of mature non-dividing β-cells (Holmberg & Perlmann, 2012; Szabat et al, 2012). In particular, Neurod1, Foxa1, Foxa2, Nkx6.1 and Pdx1 were first identified to control β-cell development but are now known to also maintain mature β-cell function (Naya et al, 1997; Ahlgren et al, 1998; Holland et al, 2002; Gao et al, 2007, 2010; Gu et al, 2010; Szabat et al, 2012; Taylor et al, 2013). This shows that the persistent and mature gene expression program in β-cells is actively controlled, but only recently the integration of these factors into regulatory networks is beginning to receive attention (Pasquali et al, 2014).
Maturity is known to be important for β-cell function, and loss of maturity was associated with failure of glucose-stimulated insulin secretion in diabetes (Weir & Bonner-Weir, 2004; Ziv et al, 2013; Wang et al, 2014). Insulin release is finely tuned and relies on mechanisms that allow β-cells to sense and metabolize glucose, as well as on signaling cascades that couple metabolic signals to insulin exocytosis (Lang, 1999; MacDonald et al, 2005). In addition to glucose as primary regulator, metabolites such as free amino acids or fatty acids also stimulate insulin secretion. Furthermore, hormones such as glucagon-like peptide-1 (Glp1) and gastrointestinal inhibitory polypeptide (GIP) modulate and serve as potentiators of glucose-induced insulin secretion (MacDonald et al, 2005; Baggio & Drucker, 2007). Thus, in a normal physiological setting in the adult, insulin secretion is controlled by glucose and additional signals that provide modulatory input. β-cells of adult and newborn mice differ in their response to these complex cues, indicating that the ability to appropriately secrete insulin is acquired during postnatal maturation. To restore β-cells or β-cell functions in diabetic patients, in vitro protocols were developed that allow the generation of β-cells from embryonic stem cells by a step-wise differentiation that recapitulates development in vivo (D’Amour et al, 2006; Nostro & Keller, 2012). Until recently, such methods yielded immature β-cells that poorly secrete insulin in response to glucose, but a new protocol was recently reported to overcome this limitation (Pagliuca et al, 2014). Despite the physiological importance of β-cell maturity, the maturation process remains little understood on a molecular level.
Insm1 encodes a zinc finger factor that controls differentiation of β-cells and other endocrine cell types in the pancreas, intestine, pituitary and adrenal medulla (Gierl et al, 2006; Wildner et al, 2008; Welcker et al, 2013; Osipovich et al, 2014). In endocrine cells of the pancreas, Insm1 expression is initiated early during development in an Ngn3-dependent manner (Gierl et al, 2006; Mellitzer et al, 2006). Insm1 but not Ngn3 expression is maintained in mature endocrine cells, providing an example of the distinct regulatory cascades operative in development and maturity. We show here that Insm1 binds to chromatin in β-cells and that most Insm1 sites are co-occupied by two key β-cell transcription factors, Neurod1 and Foxa2. Using conditional gene ablation in mice, we show that Insm1 controls mature β-cell function and is required for correct glucose-stimulated insulin secretion. Mutant β-cells shift their functional properties and gene expression program to resemble immature β-cells. Binding sites co-occupied by Insm1/Neurod1/Foxa2 are mainly located in intergenic and intronic sequences. Remarkably, the presence of such combinatorial binding sites correlates very significantly with gene expression changes in Insm1 mutant β-cells. Conversely, sites occupied by Insm1 only are enriched in promoters and correlate poorly with gene expression changes. Together, our data provide evidence that combinatorial binding of Insm1, Neurod1 and Foxa2 identifies cis-regulatory sequences that maintain the mature gene expression program of β-cells.
Results
Insm1 ablation in mature β-cells abrogates glucose-stimulated insulin secretion
In the mature murine pancreas of control mice, nuclear Insm1 protein was detected by immunohistology in insulin+ β-cells (Fig1A and B). Other endocrine cell types like α-cells that express glucagon (Gcg), δ-cells that express somatostatin (Sst) and Pp-cells that express pancreatic polypeptide (Pp) locate to the periphery of murine islets and also express Insm1 (Fig1C–E). In contrast to the expression observed in developing endocrine cells, Insm1 protein levels in adult endocrine cells appeared heterogeneous and β-cells that express high and low Insm1 levels were observed. To assess the role of Insm1 in mature β-cell gene regulation and function, we introduced a somatic Insm1 mutation in mice using a ‘floxed’ allele (Insm1flox/lacZ; Supplementary Fig S1A and Materials and Methods) and a tamoxifen-inducible Cre driven by the insulin promoter (RIPCreER; Dor et al, 2004). To test for specificity of recombination using RIPCreER, the mT/mG indicator line was used that expresses membrane-bound tomato and GFP before and after Cre-dependent recombination, respectively (Muzumdar et al, 2007). After tamoxifen treatment of mT/mG;RIPCreER animals, the vast majority of insulin+ cells co-expressed GFP, indicating that recombination is efficient in β-cells (Fig1F and G). Non-recombined tomato+ cells in islets were also observed (Fig1H). These co-expressed PECAM, glucagon, pancreatic polypeptide and somatostatin (Fig1I–L), indicating that recombination does not occur in endothelial, α-, δ- and Pp-cells. We used tamoxifen-treated mice with an Insm1flox/lacZ;RIPCreER genotype as conditional mutants, which are subsequently called coInsm1 mutants. In coInsm1 mutants, a pronounced reduction of Insm1 protein was observed by immunohistology in insulin+/Pdx1high β-cells (Fig1M–P) and by Western blot analysis of isolated islets (Fig2A).
Figure 1.
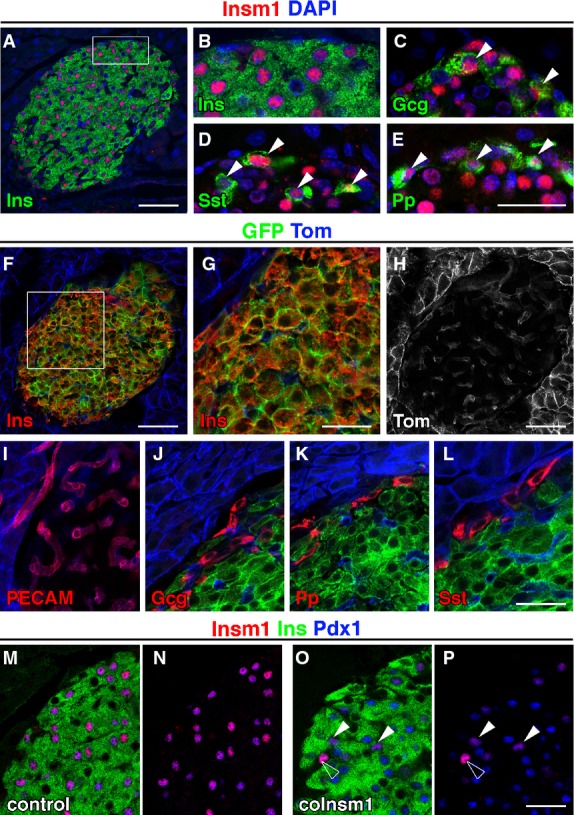
- A–E Analysis of Insm1 protein (red) in pancreata of adult control mice by immunohistology, using DAPI (blue) as counterstain. Insm1 is present in (A, B) β-cells that express insulin (Ins, green), (C) α-cells that express glucagon (Gcg, green), (D) δ-cells that express somatostatin (Sst, green) and (E) Pp-cells that express pancreatic polypeptide (Pp, green). Arrowheads indicate cells co-expressing Insm1 and Gcg (C), Insm1 and Sst (D), Insm1 and Pp (E).
- F–L Analysis of RIPCreER-induced recombination using mT/mG reporter mice that express membrane-bound tomato and GFP before and after Cre-mediated recombination, respectively. The insulin+ β-cells co-express GFP and have thus undergone recombination. Cells that express tomato co-express PECAM, glucagon, pancreatic polypeptide or somatostatin and are thus not recombined.
- M, N Co-localization of Insm1 and Pdx1 in nuclei of insulin+ β-cells in control mice.
- O, P Insm1 protein is lost in most β-cells of coInsm1 mice. Arrowheads indicate remaining un-recombined β-cells that continue to express Insm1; the open arrowhead points towards an Insm1+ endocrine cell that does not co-express insulin.
Figure 2.
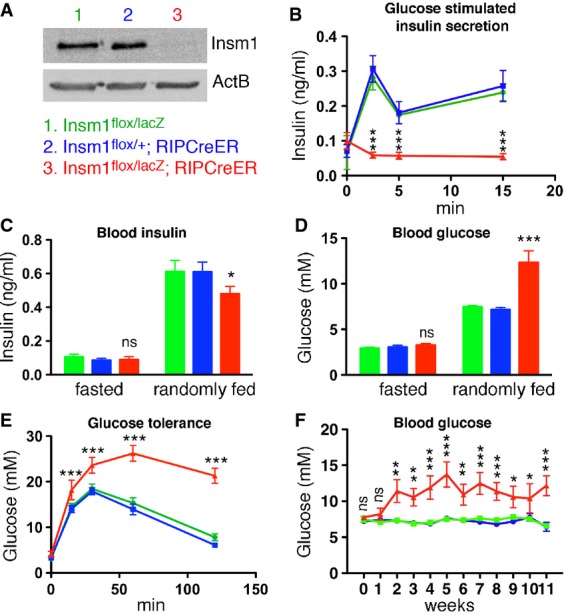
- Western blot analysis of Insm1 in isolated islets of control and coInsm1 mutant mice (pool of 200 islets from 2 to 3 mice).
- Glucose-stimulated insulin secretion in control and coInsm1 mice. The mice were injected with glucose at t = 0, and insulin secretion was monitored over time (n = 12–14).
- Blood insulin levels in fasted and randomly fed control (green bars: Insm1flox/lacZ; blue bars: Insm1flox/+;RIPCreER) and coInsm1 mice (red bars: Insm1flox/lacZ;RIPCreER) (n = 14–16).
- Blood glucose levels in fasted and randomly fed control and coInsm1 mice; mutations were introduced at an age of 4–5 weeks, and mice were analyzed at 8–12 weeks. Glucose levels in mutant mice were 12.3 ± 1.3 mM (range of 4.0–24.7 mM), in contrast to 7.5 ± 0.2 mM and 7.2 ± 0.2 mM (range of 6.0–10.2 mM) in control mice (n = 12–14).
- Glucose tolerance test in control and coInsm1 mice (n = 12–14).
- Blood glucose levels in randomly fed control and coInsm1 mice at various time points (0–11 weeks) after introduction of the mutations (n = 12–14).
Data information: Data are presented as means ± SEM, statistical significance was assessed by ANOVA and 2-tailed unpaired Student’s t-test. *P < 0.05; **P < 0.01; ***P < 0.001.
Source data are available online for this figure.
We next assessed plasma insulin levels in control and mutant mice. When insulin secretion was monitored after glucose injection in coInsm1 mutants, we observed a completely disrupted insulin secretion; that is, insulin levels were not elevated 2, 5 or 15 min after the injection (Fig2B). Insulin secretion was also impaired during a 2-h period after glucose challenge (Supplementary Fig S1B). In fasted coInsm1 and control animals, insulin levels were similar (Fig2C). We also monitored insulin levels in randomly fed animals that receive a mixture of nutrients, that is, under conditions in which insulin secretion is regulated by complex physiological parameters encompassing glucose, other nutrients and hormones. This showed that insulin levels were increased in randomly fed compared to fasted coInsm1 mice (Fig2C). However, insulin levels did not reach those observed in randomly fed control mice (Fig2C). Blood glucose levels of randomly fed coInsm1 animals were markedly elevated, and coInsm1 mice showed pronounced elevation of blood glucose in glucose tolerance tests (Fig2D and E). Elevated glucose levels were consistently observed in coInsm1 mice 2–11 weeks after tamoxifen treatment (Fig2F). Similar changes in glucose levels were observed in randomly fed and glucose challenged mice regardless whether the mutation was introduced at an age of 1 or 2 months (compare Fig2D and E; Supplementary Fig S1C and D). In all experiments described above, we compared coInsm1 mutants to control animals of two genotypes, Insm1flox/+;RIPCreER and Insm1flox/lacZ. Since the two control groups were indistinguishable, we combined them in subsequent experiments.
Insm1 is required for normal islet morphology and insulin content
We next tested whether decreased insulin release was caused by β-cell loss or reduced insulin production. Pancreatic β-cell numbers were comparable in control and mutant mice (Fig3A), but β-cell mass was mildly reduced in the mutants (Fig3B). Insulin content and insulin-1 (Ins1) but not insulin-2 (Ins2) mRNAs were mildly reduced in coInsm1 mutant pancreata (Fig3C and D). Mice that lack the insulin-1 gene remain glucose tolerant (Leroux et al, 2001), indicating that the mild downregulation of insulin-1 mRNA cannot account for the pronounced deficit in insulin secretion observed in coInsm1 mutant mice.
Figure 3.
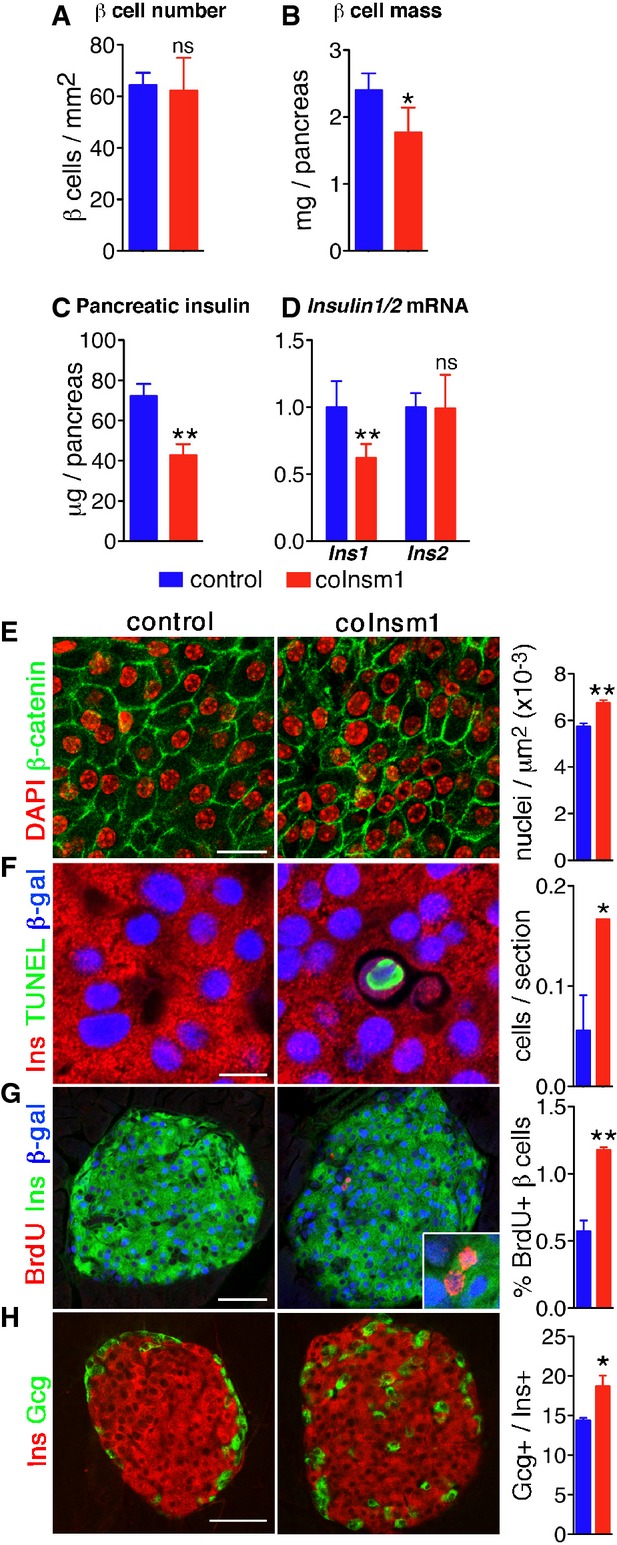
- A, B Comparison of β-cell number (A) and β-cell mass (B) in control and coInsm1 mice (n = 3 mice, 6–8 slides/animal). The number given in (A) refers to cell numbers/pancreas area.
- C, D Total pancreatic level of insulin (n = 6–12) (C) and Ins1 and Ins2 mRNA in control and coInsm1 mice (n = 5) (D).
- E Epithelial morphology and quantification of the packing density of islet cells in control and coInsm1 mice. The number given refers to cell numbers/islet area.
- F Analysis of cell death in β-cells of control and coInsm1 mice by TUNEL staining.
- G Comparison of proliferation in islets of control and coInsm1 mice using BrdU incorporation.
- H Distribution and quantification of glucagon+ cells in pancreata of control and coInsm1 mice.
Histological analyses showed that the average cell size was reduced resulting in denser nuclear packing, but overall epithelial cell morphology was intact as assessed by β-catenin distribution (Fig3E). The smaller cell size can thus account for the reduction in the β-cell mass. TUNEL staining showed that apoptosis rates were elevated in islets of coInsm1 mutants, but they nevertheless remained low (< 1 apoptotic cell/section; Fig3F). This was accompanied by a mild increase in proliferation (Fig3G). We also found that glucagon-expressing α-cells were increased in number and dispersed throughout the islet instead of being located in the periphery (Fig3H). The numbers and locations of somatostatin- and pancreatic peptide-expressing cells and expression of other hormones were unchanged (Supplementary Fig S2). In conclusion, ablation of Insm1 in adult β-cells resulted in perturbed islet morphology, reduced β-cell mass due to smaller cell volume and decreased pancreatic insulin content.
Insm1 mutant β-cells assume immature functional characteristics
We next tested systematically for changes in gene expression in coInsm1 mutant islets by microarray analysis (GSE54044), which revealed deregulated genes in mutant islets (P-value < 0.05; 1,232 genes with FC > 1.2 and < 0.8; 352 with FC > 1.4 and < 0.6). Similar numbers of genes were up- and down-regulated. To define affected cellular processes, we performed Gene Ontology (GO) term analysis of differentially expressed genes. Consistent with glucose intolerance, deregulated genes were associated with biological processes critical for β-cell function, such as regulation of insulin secretion, response to hormone and glucose stimulus, and glucose metabolism (Fig4A; Supplementary Table S1). Comparison with Insm1-dependent genes identified previously in the developing pancreas (Gierl et al, 2006) revealed little overlap (61 overlapping genes, Pearson’s coefficient 0.21, Supplementary Table S2). Thus, Insm1 controls distinct sets of genes in developing and mature β-cells.
Figure 4.
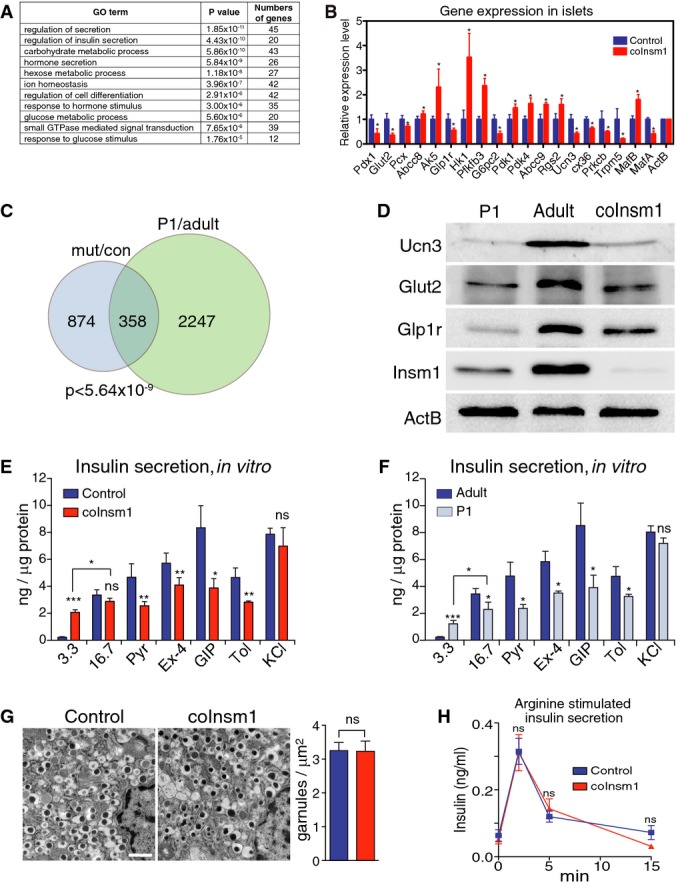
- GO term analysis of differentially expressed genes identified by microarray analysis in isolated islets from control and coInsm1 mutant mice. Shown are GO terms, the P-value for their enrichment and the number of differentially expressed genes associated with a particular GO term.
- Verification of differential expression of genes previously implicated in the control of insulin secretion; RNA from isolated islets of control and coInsm1 mutant mice was compared by qRT–PCR (n = 5).
- Comparison of the deregulated genes identified in coInsm1 mutant versus control islets and sorted β-cells from P1 and adult mice. 1,232 genes were differentially expressed in coInsm1 mutant islets, and among these, 358 were previously identified as differentially expressed in immature versus mature β-cells.
- Analysis of Ucn3, Glut2 and Glp1r protein by Western blotting; a representative of three experiments is shown.
- Insulin secretion from isolated islets of control and coInsm1 mutant mice in response to glucose (3.3 and 16.7 mM), and in response to 16.7 mM glucose and additional secretagogues, that is, 100 mM pyruvate (Pyr), 20 nM exendin-4 (Ex-4), 100 nM gastric inhibitory polypeptide (GIP), 200 μM of the ATP-sensitive K+ channel inhibitor tolbutamide (Tol) and in response to membrane depolarization (30 mM KCl) (n = 3–4).
- Insulin secretion from isolated islets of P1 and adult mice in response to glucose, secretagogues and membrane depolarization (n = 3–4).
- Secretory vesicle appearance and density in control and coInsm1 mutant β-cells (n = 3).
- Arginine-induced insulin secretion was intact in coInsm1 mutant mice (n = 6–15).
Data information: Data are presented as means ± SD; statistical significance was assessed by ANOVA and 2-tailed unpaired Student’s t-test. *P < 0.05; **P < 0.01; ***P < 0.001. Scale bar: 1 μm.
Source data are available online for this figure.
Insulin exocytosis from pancreatic β-cells is stimulated by glucose metabolism by a mechanism involving ATP-sensitive K+ channels (MacDonald et al, 2005). In addition, hormones such as glucagon-like peptide-1 (Glp1) and gastrointestinal inhibitory polypeptide (GIP) and metabolic fuels potentiate insulin secretion (Baggio & Drucker, 2007). Many deregulated genes identified participate in glucose-dependent insulin secretion, such as Glut2 (Slc2a2), Pcx, Pfkfb3, Hk1, Pdk1/4 and G6pc2 that control glucose uptake and metabolism, a subunit of the ATP-sensitive potassium channel (Abcc8), intracellular signaling molecules (Prckb, Ak5, Trpm5, Cx36), glucagon-like peptide-1 receptor (Glp1r) and a negative regulator of GIP receptor signaling (Rgs2) (see Supplementary Table S1 for a list of deregulated genes implicated in insulin secretion; Babenko et al, 2006; Becker et al, 1994; Carvalho et al, 2010; Colsoul et al, 2010; Guillam et al, 1997; Stanojevic et al, 2008; Sugden & Holness, 2013; Tseng & Zhang, 1998; Wang et al, 2007; Xu et al, 2008). The expression of deregulated genes implicated in insulin secretion was confirmed by qRT–PCR (Fig4B). Ucn3 provides a marker for β-cell maturity, and the ratio of MafB and MafA expression is important during β-cell maturation (Artner et al, 2010; Blum et al, 2012; van der Meulen et al, 2012; Hang et al, 2014). We also observed that Ucn3, MafB and MafA were deregulated in coInsm1 mutant islets. This provided first evidence that coInsm1 mutant islets have lost a mature gene expression program.
We therefore systematically compared genes deregulated in coInsm1 islets to previously reported genes differentially expressed in mature and immature (P1) murine β-cells (Blum et al, 2012; GSE35906). This revealed a large overlap; that is, 29% of the genes that were differentially expressed in control and coInsm1 mutant islets were also differentially expressed in mature and immature β-cells; a hypergeometric probability test demonstrated that this overlap was highly significant (P < 5.6 × 10⁻⁹; Fig4C). We also compared the differentially expressed genes of coInsm1 mutants with a diabetes model (Kluth et al, 2014) and found a more limited overlap (115 genes deregulated in both models, P = 1). Islets of coInsm1 mutants resemble thus more closely immature than diabetic islets. Ucn3, Glut2 and Glp1r were among the common set of deregulated genes in immature and coInsm1 mutant islets, and Western blotting demonstrated reduced levels of the corresponding proteins (Fig4D). Ngn3 and other markers of β-cell progenitors were not induced (Supplementary Fig S3). This indicates that coInsm1 mutant β-cells revert to an immature but not progenitor state.
Immature β-cells, for instance those from newborn mice, are known to respond aberrantly to glucose (Rorsman et al, 1989; Blum et al, 2012). We therefore characterized and directly compared glucose-induced insulin secretion from islets isolated from coInsm1 mutants and immature mice (Fig4E and F). coInsm1 mutant but not control islets released insulin at 3.3 mM glucose, but glucose-stimulated insulin release was similar at 16.7 mM. In control islets, insulin secretion was further enhanced by pyruvate, exendin-4 and GIP in the presence of 16.7 mM glucose, but coInsm1 mutant islets responded poorly to these secretagogues (Fig4E). Similar changes in insulin secretion were observed in immature islets obtained from postnatal day 1 (P1) mice, that is, increased insulin release at low glucose (3.3 mM) and poor response to pyruvate, exendin-4 and GIP (Fig4F). coInsm1 mutant islets and immature islets also displayed a similar decrease in sensitivity to tolbutamide, a blocker of ATP-sensitive potassium channels (Fig4E and F). Stimulation with KCl released similar amounts of insulin from control, coInsm1 mutant and from immature islets (Fig4E and F). This indicated that the overall secretory machinery remained functional in coInsm1 and immature islets. This was also supported by electron micrograph analysis of insulin-containing secretory granules in β-cells that did not reveal changes in vesicular morphology or density in mutant mice (Fig4G). Furthermore, examination of arginine-induced insulin secretion in vivo did not reveal significant differences between control and coInsm1 animals (Fig4H). Thus, mutant β-cells remain fully capable of insulin secretion after challenge with arginine in vivo or by global membrane depolarization by exogenous KCl in vitro. In summary, the primary deficit in coInsm1 mutant β-cells is restricted to glucose-induced insulin secretion and its modulation by secretagogues, excluding a general deficit in the basic secretory machinery. This is also supported by the fact that genes controlling glucose sensing and metabolism, secretagogue response and intracellular signaling are deregulated.
Insm1 binds to chromatin cooperatively with Neurod1 and Foxa2
To understand the molecular mechanism of Insm1 function in β-cells, ChIP-seq experiments were performed. As a chromatin source, we used early passages of an immortalized pancreatic β-cell line (referred to as SJ β-cells) that we established (Radvanyi et al, 1993). Insulin secretion from SJ β-cells was stimulated eightfold to tenfold in response to glucose, which is comparable to the response observed in dissociated cells from adult islets, but lower than the one in intact islets, and these cells respond to exendin-4 and GIP (Supplementary Fig S4A; compare with Blum et al, 2012; Halban et al, 1982). Two independent ChIP-seq experiments (GSE54046) identified 17,453 high confidence Insm1 binding sites in chromatin of SJ β-cells that overlapped between experiments (see Supplementary Fig S4B–D for replicate comparisons, antibody specificity and binding site distribution). Example traces are shown in Fig5A and Supplementary Fig S4E (upper traces). Examination of these binding sites by de novo motif analyses revealed an enrichment of two sequences within ±25 bp of the summits of binding sites (Fig5Bi and ii; E-value = 8 × 10−92 and 8 × 10−41 for the two motifs shown in i and ii, respectively). The first corresponds to an E-box (present in 22% of all Insm1 binding sites) and the second to the consensus sequence of forkhead factors (present in 21% of all Insm1 binding sites; Newburger & Bulyk, 2009). The previously described consensus Insm1 binding sequence (Breslin et al, 2002) was not identified by de novo motif analysis, but a related sequence (Fig5B iii) was observed in 19% of all Insm1 binding sites (E-value = 5.5 × 10−55; see also below).
Figure 5.
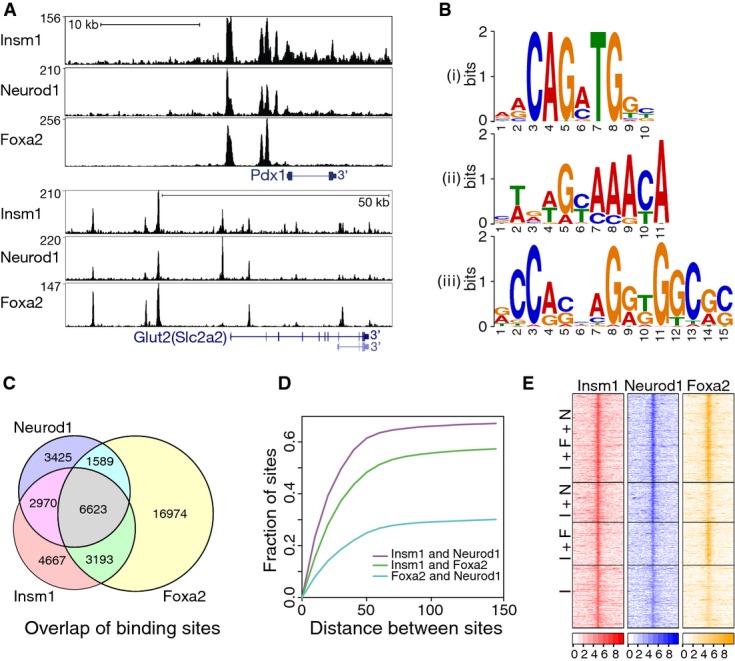
- Insm1, Neurod1 and Foxa2 ChIP-seq binding tracks identified in chromatin from SJ β-cells for Pdx1 and Glut2 (Slc2a2).
- De novo motif analysis of Insm1 peaks identified consensus binding sequences of basic helix-loop-helix and forkhead factors (i and ii); in addition, an Insm1 motif (iii) identified in ‘Insm1 only’ sites that resembles the known Insm1 binding sequence is shown.
- Overlap between Insm1, Neurod1 and Foxa2 binding sites.
- Distance between the summits of Insm1 and Neurod1 (violet), Insm1 and Foxa2 (green) as well as Foxa2 and Neurod1 (light blue) peaks; displayed are the fraction of peaks versus the distance between binding sites in base pairs.
- Heat map showing read tracks for Insm1, Neurod1 and Foxa2 at sites co-occupied by Insm1/Neurod1/Foxa2 (I+F+N; top), Insm1/Neurod1 and Insm1/Foxa2 (I+N and I+F; middle), or at sites bound by Insm1 only (I; bottom). The color code indicates read density ±2 kb around binding sites as log2 of the number of reads.
The key β-cell transcription factors Neurod1 and Foxa2 bind E-box and forkhead motifs, respectively. We tested whether Neurod1 and Foxa2 co-occupy Insm1 sites in β-cell chromatin using ChIP-seq analysis. A total of 14,607 Neurod1 and 28,379 Foxa2 binding sites were identified in the genome of SJ β-cells; 38% of the Neurod1 and 46% of the Foxa2 sites contained the known E-box and forkhead consensus motif, respectively, within ±25 bp of the summit of the peaks. Binding sites of Insm1 in the genome displayed large degrees of overlap with Neurod1 and Foxa2: 73% of all Insm1 sites were co-occupied by Neurod1 and/or Foxa2, and 38% were co-occupied by all three factors (Fig5C). Summits of single factor binding peaks were typically close and less than 50 bp apart (Fig5D). Traces for all three factors are shown for the key β-cell transcription factor Pdx1 and the glucose transporter Glut2 (Slc2a2) (Fig5A), as well as for Ucn3, Ins1, hexokinase1 (Hk1) and MafA (Supplementary Fig S4E; see also Supplementary Table S3). Many Insm1 sites not classified as Neurod1 or Foxa2 binding sites nevertheless displayed substantial Neurod1 or Foxa2 coverage that had not sufficed to pass the stringent cutoff (Fig5E, Materials and Methods). We also performed de novo motif analyses on co-occupied and ‘Insm1 only’ sites. In ‘Insm1 only’ sites, two motifs were identified, one resembling the described Insm1 consensus sequence (Fig5B iiii) (Breslin et al, 2002) and the second corresponding to a new motif (Supplementary Fig S5); neither of these were identified in sites co-occupied by all three factors.
Next, we compared the number of reads obtained in Insm1, Neurod1 or Foxa2 ChIP-seq experiments and observed that read numbers were highest at sites co-occupied by all three factors (Fig6A). Comparison of the distribution of co-occupied and ‘Insm1 only’ sites in the genome demonstrated that co-occupied sites were depleted of promoter and enriched in intergenic and intronic sequences (Fig6B). The co-recruitment of Insm1, Neurod1 and Foxa2 was also experimentally tested by ChIP-PCR in both SJ β-cells and murine islets. Indeed, all tested sites were enriched (Fig6C and D). Thus, Insm1, Neurod1 and Foxa2 frequently bind in close proximity in chromatin of pancreatic β-cells, and high affinity binding sites are enriched in sites co-occupied by all three factors.
Figure 6.

- A Peak heights at sites occupied by individual factors, factor combinations and Insm1/Neurod1/Foxa2; median value (black line), quartiles (boxes) and errors (dashed lines) are shown (R package). Peak heights are largest at Insm1/Neurod1/Foxa2 sites (P < 2.2 × 10⁻¹⁶).
- B Pie charts showing the distribution of Insm1 only sites (top) and Insm1/Neurod1/Foxa2 sites (bottom).
- C, D ChIP-PCR analyses of Insm1, Neurod1 and Foxa2 binding in chromatin from SJ β-cells and isolated islets. Shown is the enrichment of precipitated chromatin; representative examples of three experiments are shown.
We next tested whether Insm1 and Neurod1 and/or Foxa2 bind simultaneously or competitively by sequential chromatin immunoprecipitation (ChIP-reChIP) (Truax & Greer, 2012). After precipitation of chromatin from SJ β-cells and murine islets by anti-Insm1 antibodies, we observed substantial re-precipitation with anti-Neurod1 or anti-Foxa2 antibodies (Fig7A–D). Thus, Insm1/Neurod1 and Insm1/Foxa2 can bind simultaneously. We also tested whether Insm1 directly interacts with Neurod1 or Foxa2 using immunoprecipitation and Western blotting. Anti-Insm1 antibodies co-precipitated endogenous Neurod1, and to a lesser extend Foxa2 in SJ β-cells (Fig7E). Co-precipitation was also observed in the presence of ethidium bromide (Fig7E), indicating that Insm1/Neurod1 and Insm1/Foxa2 interactions are independent of DNA binding (Lai & Herr, 1992). Conversely, the endogenous Insm1 was immunoprecipitated by anti-Neurod1 and anti-Foxa2 antibodies in the presence and absence of ethidium bromide, but not by control or anti-MafA antibodies (Fig7E). Thus, Insm1 physically interacts strongly with Neurod1, and to a lesser extent with Foxa2, indicating that Insm1 can be recruited also indirectly to chromatin.
Figure 7.
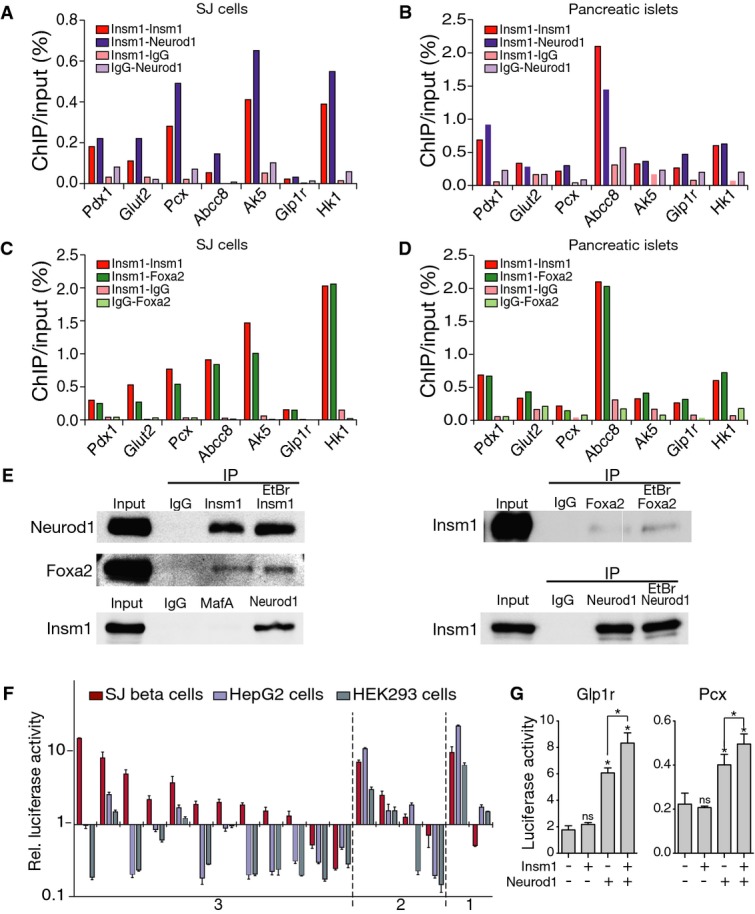
- reChIP-PCR analysis of selected binding sites in chromatin from SJ β-cells using antibodies against Insm1, Neurod1 and control IgG. Displayed is the percentage of the re-precipitated chromatin divided by chromatin input.
- reChIP-PCR analysis of chromatin from isolated islets using antibodies against Insm1, Neurod1 and control IgG. Displayed is the percentage of the re-precipitated chromatin divided by chromatin input.
- reChIP-PCR analysis of chromatin from SJ β-cell using antibodies against Insm1, Foxa2 and control IgG.
- reChIP-PCR analysis of chromatin from isolated islets using antibodies against Insm1, Foxa2 and control IgG.
- Co-immunoprecipitation of Insm1 and Neurod1, Insm1 and Foxa2 (but not Insm1 and MafA) in the presence or absence of ethidium bromide (EtBr). IP: antibody used for immunoprecipitation. The antibody used for Western blotting is also indicated. Representative results from one of three experiments are shown
- Luciferase reporter assay for cis-regulatory activity of DNA fragments associated with deregulated genes and Insm1 binding sites; luciferase reporter assays were performed in SJ β-cells, HepG2 and HEK293 cells. y-axis: luciferase activity relative to that of a plasmid with minimal promoter (pGL4-minP). x-axis: DNA regions co-occupied by Insm1/Neurod1/Foxa2 (category 3), Insm1/Neurod1 or Insm1/Foxa2 sites (category 2), or ‘Insm1 only’ (category 1) (n = 4).
- Synergistic transcriptional activation of fragments from the Glp1r and Pcx genes by Neurod1 and Insm1 in HepG2 cells (n = 4); *P < 0.05.
Data information: (A–D) Representative results from experiments done in triplicate (A, C) and duplicate (B, D) are shown. Data in (F, G) are presented as means ± SEM.
Source data are available online for this figure.
We chose sequences to assess them for enhancer activity in β-cells (SJ cells), hepatocytes (HepG2 cells) and a kidney cell line (HEK293) by luciferase assays. Sequences chosen were associated with deregulated genes and either co-occupied by Insm1/Neurod1/Foxa2 (indicated by 3 in Fig7F), by other combinations of Insm1 sites (indicated by 2) or by Insm1 only (indicated by 1). The majority of Insm1/Neurod1/Foxa2 co-occupied sites were more active in β-cells than in HepG2 or HEK293 cells (Fig7F). Thus, sites that integrate binding of all three factors display cis-regulatory activity and β-cell lineage selectivity. Indeed, Insm1/Neurod1/Foxa2 sites were strongly enriched in the previously characterized putative enhancers of β-cells (Supplementary Table S4; Tennant et al, 2013). Six fragments that displayed lineage-specific regulatory activity were further analyzed by luciferase assays in HepG2 cells that express endogenous Foxa2, but not Insm1 or Neurod1. Insm1 or Neurod1 cDNA was transfected together with luciferase constructs. Expression of Neurod1 cDNA but not of Insm1 cDNA alone stimulated transcriptional activity of enhancer fragments from the Glp1r and Pcx genes. Remarkably, Neurod1 and Insm1 co-transfection stimulated expression synergistically (Fig7G), which was observed with enhancer fragments from Glp1r and Pcx genes but not other tested fragments. We conclude from these data that Neurod1 and Insm1 can act synergistically to increase transcriptional activity.
Combinatorial Insm1/Neurod1/Foxa2 binding sites correlate with Insm1-dependent gene regulation
Transcription factors typically bind to many thousand sites in the genome. It has remained a challenge to identify among these sites the ones functionally important for regulating gene expression. We related Insm1 binding and changes in gene expression in coInsm1 mutant islets. In comparison to all expressed genes, combinatorial Insm1/Neurod1/Foxa2 binding sites were significantly enriched in deregulated genes (P-value = 2.2 × 10⁻¹⁹ and 8.0 × 10⁻²² for sequences 10 kb or 50 kb around the genes, respectively, for FC > 1.2). For instance, 16% of all expressed genes and 32% of deregulated genes (FC > 1.4) contained an Insm1/Neurod1/Foxa2 binding site within 10 kb (P-value = 4.3 × 10⁻¹³). Sites occupied by ‘Insm1 only’ did not correlate with changed gene expression (Fig8A). Additional computational analysis of other categories of single and combinatorial binding sites confirmed that sites co-occupied by Insm1/Neurod1/Foxa2 correlate best with changes in Insm1-dependent gene expression (Supplementary Table S5). Similar numbers of genes associated with Insm1/Neurod1/Foxa2 binding sites were up- and down-regulated (Supplementary Table S6), indicating that these sites regulate transcription in a context-dependent manner to activate or repress genes. Many deregulated genes associated with combinatorial Insm1/Neurod1/Foxa2 binding sites participate in insulin secretion, among them all deregulated genes whose expression was verified by qPCR in Fig3B (see Supplementary Table S3 for a list of deregulated genes implicated in insulin secretion associated with Insm1/Neurod1/Foxa2 sites). Finally, we defined the presence of Insm1/Neurod1/Foxa2 binding sites in genes deregulated in both, immature islets and coInsm1, and observed again a significant enrichment (P-value = 1.0 × 10⁻¹⁰ and 4.2 × 10⁻¹⁵ for sequences 10 kb and 50 kb around deregulated genes, respectively). We conclude that the presence of sites characterized by triple Insm1/Neurod1/Foxa2 binding is a predictor of Insm1-dependent gene expression.
Figure 8.
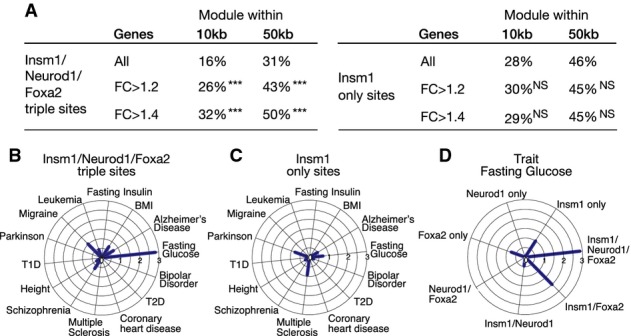
- A Proportions of all expressed and deregulated genes containing sites bound by Insm1/Neurod1/Foxa2 within ±10 kb and ±50 kb of the transcription start site (left). Proportions of all expressed and deregulated genes with sites occupied by Insm1 only ±10 kb and ±50 kb of the transcription start site (right). P-values for the enrichment of genes are indicated. NS: P-value > 0.01; ***P-value ≤ 10−10.
- B, C SNPs with genome-wide association for 14 traits in European individuals overlapping with Insm1/Neurod1/Foxa2 and Insm1 only sites; note that SNPs associated with fasting glucose levels are significantly enriched in Insm1/Neurod1/Foxa2 but not in sites bound by Insm1 only.
- D SNPs with genome-wide association for glycolytic traits in European individuals that overlap with different combinations of Insm1, Neurod1 and Foxa2 binding sites; P-values are displayed as −log10 values. Thus, SNPs associated with Insm1/Neurod1/Foxa2 binding sites are highly enriched for glycolytic traits.
Trait-associated variations in the genome (e.g., single nucleotide polymorphisms, SNPs) are often enriched in regulatory sequences (Hnisz et al, 2013; Pasquali et al, 2014). We defined human sequences that correspond to the experimentally identified Insm1 binding sites in mice and correlated them with known trait-associated variations. First, we examined SNPs obtained from the National Human Genome Research Institute (NHGRI) GWAS catalogue and included 14 traits, including traits associated with β-cell dysfunction such as diabetes, changed insulin and glucose levels. The most pronounced enrichment was observed for sites co-occupied by Insm1/Neurod1/Foxa2, and this was observed in SNPs associated with ‘glucose levels’, but sites occupied by ‘Insm1 only’ were not enriched (Fig8B and C). Enrichment of other site categories or trait categories did not reach this level of significance (Fig8D; Supplementary Table S7 for 98 combinations of binding site categories and their enrichment in SNPs associated with various traits). Several SNPs associated with type 2 diabetes were also located in Insm1/Neurod1/Foxa2 sites, but these were not significantly enriched. To further examine sequence variations, we also included SNPs identified in the largest available genome-wide association analyses for glycolytic traits (Morris et al, 2012; Scott et al, 2012) and again observed a significant enrichment of Insm1/Neurod1/Foxa2 sites (SNPs overlapping with Insm1/Neurod1/Foxa2 sites are listed in Supplementary Table S8). Thus, combinatorial Insm1/Neurod1/Foxa2 binding sites are enriched for sequences implicated in β-cell dysfunction in humans.
Discussion
Functional immaturity was associated with failure of pancreatic β-cells in disease (Weir & Bonner-Weir, 2004; Dor & Glaser, 2013; Wang et al, 2014). However, mechanisms that allow the acquisition and maintenance of the mature β-cell state are incompletely understood. We show here that Insm1 is required in adult β-cells to maintain the mature gene expression program. Conditional Insm1 ablation in mature β-cells leads to pronounced deficits in insulin secretion and to glucose intolerance, and mutant islets from adult mice resemble in these functional properties β-cells isolated from newborn animals. We used cultured cells as a model to analyze molecular mechanisms of Insm1 function and found that Insm1 binds to defined domains in chromatin that are mostly co-occupied by Neurod1 and Foxa2. Indeed, the presence of sites co-occupied by the three transcription factors correlates significantly with gene expression changes observed in Insm1 mutant islets. Together, our data identify Insm1 as a component of an important transcriptional network that controls the gene expression program of mature pancreatic β-cells.
Functional interactions between Insm1, Neurod1 and Foxa2
Our analyses show that in β-cells Insm1 is frequently bound to chromatin together with Neurod1 and Foxa2, two well characterized transcription factors that control mature β-cell function (Naya et al, 1997; Lantz et al, 2004; Gao et al, 2007, 2010; Gu et al, 2010; Mastracci et al, 2013). Cultured and primary β-cells differ in important parameters like proliferative activity. SJ β-cells resemble but are not identical to islets in their ability to secrete insulin in response to glucose. Furthermore, the cultured cells also respond to exendin-4 and GIP. Because of the ample material provided by cultured cells, we used SJ β-cells as model for ChIP-seq experiments and identified Insm1, Neurod1 and Foxa2 binding sites. A set of the binding sites associated with genes known to control glucose-dependent insulin secretion was re-tested in ChIP-PCR experiments, and all tested sites were occupied also in isolated islets. cis-regulatory modules that assemble many transcription factors are known to control gene expression (Davidson, 2001; Bonn & Furlong, 2008; Ciofani et al, 2012). Interestingly, Insm1/Neurod1/Foxa2 binding sites identified in the Pdx1, MafA and Hadh genes were previously shown to possess enhancer activity (Gerrish et al, 2000; Lantz et al, 2004; Raum et al, 2006). Similarly, a large proportion of the identified sequences tested experimentally displayed cis-regulatory activity and β-cell lineage selectivity.
We show here that Insm1, Neurod1 and Foxa2 do not only co-occupy chromatin in β-cells, but Insm1 also directly interacts and co-precipitates with Neurod1 and Foxa2 in the absence of DNA binding. Insm1/Neurod1/Foxa2 binding sites represent high affinity sites, as judged from the number of reads in ChIP-seq experiments. Moreover, in cultured hepatocytes that express Foxa2 endogenously, ectopic expression of Insm1 and Neurod1 can synergistically stimulate transcriptional activity in luciferase assays when fragments containing Insm1/Neurod1/Foxa2 binding sites were tested. Remarkably, sites co-occupied by Insm1/Neurod1/Foxa2 predict a large proportion of the Insm1-dependent gene expression in mature β-cells, and the majority of these are located in intergenic and intronic sequences. In contrast, sites that bind Insm1 only correlate poorly with changed gene expression and are frequently enriched in promoters. Our data explain part of the mechanism by which β-cells maintain maturity and are in accordance with previous findings in other cell and tissue types that indicate that combinatorial transcription factor binding can be used to identify functionally important cis-regulatory sequences (Davidson, 2001; Bonn & Furlong, 2008; Ciofani et al, 2012).
We further show that the combinatorial binding of Insm1/Neurod1/Foxa2 seems to some degree be conserved and functionally important in humans. Such sequences, when mapped to the human genome, were enriched in human sequence variants associated with glycolytic traits. Sites co-occupied by Insm1/Neurod1/Foxa2 represent thus a functionally important sub-class of Insm1 binding sites in the genome. However, the presence of Insm1/Neurod1/Foxa2 sites is found in genes that are positively or negatively de-regulated in coInsm1 mutant β-cells. A large fraction (46%) but not all Insm1/Neurod1/Foxa2 sites locate to previously mapped putative enhancer sequences of islets (Tennant et al, 2013). Remaining sites might correspond to promoters or poised enhancers containing bivalent histone marks that are thought to respond to external stimuli (Creyghton et al, 2010). Together, these data indicate that Insm1 acts as a transcriptional regulator and, in a context-dependent manner, as activator or repressor, together with other factors that modify the function of Insm1/Neurod1/Foxa2. Insm1 is known to recruit histone-modifying factors such as Kdm1a, Hdac1/2, Rcor1-3 and other proteins implicated in transcriptional regulation (Hmg20a/b and Gse1) via its SNAG domain (Welcker et al, 2013), and our ongoing work indicates that the recruitment of such factors explains many but not all Insm1-dependent functions in the pancreas (Ulrich Köstner and C.B., unpublished data).
Functional deficits and islet immaturity in coInsm1 mutant islets
The development and maintenance of a mature functional state of β-cells and other cell types depends on the continuous presence of key transcription factors that define cellular identity (Holmberg & Perlmann, 2012). Nevertheless, distinct genes depend on Insm1 during development and in the adult, and furthermore, DNA binding by Insm1 appears to be dynamic. Thus, only a small proportion (4.9%) of Insm1-dependent genes identified in mature β-cells were also deregulated in developing Insm1 mutant pancreata, and among the five known Insm1 binding sites identified previously in developing β-cells, only one located in the Insm1 promoter was also identified in this study (Gierl et al, 2006; Osipovich et al, 2014). In addition, this analysis and previous work demonstrate that mutation of transcription factors in mature β-cells is less disruptive than mutation during development. For instance, among the few commonly deregulated genes identified after Insm1 mutation in developing and mature β-cells, we identified Insulin-1 (Ins1) that was downregulated twofold and 13-fold after mutation of Insm1 in adult and developing β-cells, respectively. The mature gene expression program of β-cells appears therefore to be more stable, possibly due to epigenetic modifications or the existence of more complex and redundant transcription factor networks.
We show here that conditional ablation of Insm1 in β-cells of mice results in a failure to secrete insulin in response to glucose challenge. Our data indicate that deficits in glucose uptake and metabolism as well as changes in secretagogue response account for this. Thus, coInsm1 mutant β-cells respond poorly to high glucose and to modulators of glucose-dependent insulin secretion like incretin or pyruvate. The primary deficit is restricted to glucose-dependent insulin secretion and its modulation by secretagogues. Mutant β-cells remain fully capable of insulin secretion after challenge with arginine or global membrane depolarization with exogenous KCl in vitro, excluding a general deficit in the basic secretory machinery. Insulin secretion from isolated islets of coInsm1 mutant mice and immature (P1) islets under various conditions shows remarkable physiological similarities. Furthermore, comparison of differentially expressed genes reveals a large overlap between coInsm1 mutant islets and immature β-cells. Thus, mutant β-cells resembled β-cells isolated from newborn animals, but we did not detect evidence for a return to a progenitor state marked for instance by Ngn3 expression. We noted that Insm1/Neurod1/Foxa2 sites with high factor occupancy cluster around genes important for β-cell identity, for instance Pdx1 and Ins1. Further analyses will show whether such clusters correspond to ‘super enhancers’ that were proposed to dominate the transcriptional control of cell identity (Hnisz et al, 2013), and to what extent such ‘super enhancers’ change during development and maturation in temporal dynamic patterns.
Materials and Methods
Animals and genotyping analysis
The Insm1flox allele was generated using homologous recombination in embryonic stem (ES) cells (Supplementary Fig S1A). The neomycine casette used for selection in ES cells was removed by standard techniques (Rodriguez et al, 2000). Control (Insm1flox/+;RIPCreER or Insm1flox/lacZ) and conditional mutant (Insm1flox/lacZ;RIPCreER) mice were generated by using RIPCreER (Dor et al, 2004) and Insm1LacZ/+ (Gierl et al, 2006) strains. Male animals at an age of 8–12 weeks were used. Tamoxifen pellets (25 mg, 21 d release) were inserted under the skin of 4- or 8-week-old mice (control and conditional mutant animals). The mT/mG reporter strain was used for verification of recombination (Muzumdar et al, 2007). Phenotypes were analyzed on a mixed C57Bl/6;129Ola background and mutants were always compared with littermates. RIPCreER was reported to be expressed also in brain neurons, but Insm1 is solely expressed in neuronal progenitor cells but not neurons, precluding recombination in the nervous system. Genotyping primers are listed in Supplementary Table S9. All breeding, housing and experiments were conducted in accordance with institutional German regulations.
Quantification of insulin levels, glucose levels and β-cells
Blood glucose and blood insulin measurements were performed as described (Poy et al, 2009). Average blood glucose levels were determined from average levels of at least six independent measurements of 12–14 individual animals/genotype. For blood insulin levels, average levels were determined from average values obtained from at least two independent measurements of 14–16 individual animals/genotype. Sample sizes chosen were similar as the ones previously reported to provide statistical significance (Kulkarni et al, 2002; Kubota et al, 2004; Poy et al, 2009). For glucose tolerance tests, glucose was injected intraperitoneally (2 g/kg body weight), and blood glucose levels were measured using a glucose meter (Bayer, Leverkusen, Germany). For insulin secretion, glucose (2 g/kg body weight) or arginine (0.3 g/kg body weight) was injected intraperitoneally, and insulin was measured from serum using an ultra sensitive mouse insulin ELISA kit (Crystal Chem. Inc., Downers Grove, USA). Pancreatic insulin content was determined from pancreas tissue extracted with acid ethanol using ELISA (Poy et al, 2009). In short, 3 pancreata/genotypes were collected in 5 ml acidic ethanol (2% concentrated HCl in 100% ethanol) and grinded. After centrifugation, supernatants were collected, and insulin concentration was determined by ELISA (Mouse High Range Insulin ELISA, Alpco, USA).
Pancreatic Ins1 and Ins2 mRNA was determined by qRT–PCR. The β-cell mass and β-cell number/mm2 pancreas were determined as described using 3 mice/genotype (Poy et al, 2009). In short, every 20th sections (8 μm) of pancreata were collected, that is, 6–8 sections/pancreas encompassing the whole organ, and β-cell area was identified by immunohistology using anti-insulin antibodies. The entire pancreas area, insulin-positive area and pancreas weight before sectioning were determined and used to calculate β-cell mass. The number of β-cells/pancreas area was determined from counts of β-cells (DAPI+ nuclei in insulin+ area) on sections of 90–120 islets/mouse.
Immunohistochemistry, immunoprecipitation and Western blot
Immunohistochemistry was performed as described by Poy et al (2009). Fluorescence was imaged on a Zeiss LSM 700 confocal microscope and processed using Adobe Photoshop software. Immunoprecipitation and Western blot were performed as described (Welcker et al, 2013). Antibodies used are listed in Supplementary Table S9. For co-immunoprecipitations, SJ β-cells were lysed and centrifuged, and the supernatant was incubated with the indicated antibodies. Antibodies were immobilized on protein A or G beads and used to precipitate endogenous proteins. Beads were washed 3 times with PBS containing 0.02% Tween-20, and protein was eluted using 4% SDS in 0.1 M Tris–HCl pH 7.4.
Isolation of pancreatic islets and analysis of insulin secretion from isolated islets
Pancreatic islets were isolated as described by Poy et al (2009). After enrichment on Histopaque (Sigma-Aldrich, Munich, Germany) step gradients, individual islets were picked with a pipette under the microscope.
Insulin secretion from isolated islets (n = 3–4) and SJ β-cells (n = 3) was measured after incubation with the various secretagogues (Poy et al, 2004). For this, isolated islets were cultured overnight in RPMI medium (Gibco, Darmstadt, Germany) containing 10% fetal calf serum for recovery. Islets were prepared for analysis by washing in secretion buffer (137 mM NaCl, 0.9 mM CaCl2, 2.7 mM KCl, 1.5 mM KH2PO4, 0.5 mM MgCl2, 8.1 mM Na2HPO4, 20 mM HEPES pH 7.4, 0.2% BSA), incubation in secretion buffer containing 5.5 mM glucose (30 min) and again washing in secretion buffer. The assay was then performed by incubation for 30 min in secretion buffer containing indicated concentrations of glucose and secretagogues. Released insulin was quantified using ELISA (Mouse High Range Insulin ELISA, Alpco, USA).
Microarray analysis
Total RNA from isolated islets was isolated using TRIzol reagent (Invitrogen, Carlsbad, USA). Genome-wide transcript analysis was performed using Affymetrix GeneChip Mouse Genome 430 2.0 arrays (8 microarrays/genotype, Grossmann et al, 2009) according to the manufacturer’s protocol. Microarray data were analyzed with R bioconductor package (Huber & Gentleman, 2004) and processed with affy and limma packages. To compare samples, we applied log2 transformation and normalized with the ‘quantile’ method. Only probes with log2 intensity > 7 were considered for further analysis. The Benjamini–Hochberg FDR method was used to calculate P-values (cutoff 0.05). The significance of overlaps in gene expression changes in various models was compared using the hypergeometric probability test http://www.geneprof.org/GeneProf/tools/hypergeometric.jsp.
qRT–PCR analysis
For qRT–PCR analysis, cDNA from five animals/genotype was synthetized using SuperScript III (Invitrogen) and independently analyzed using Absolute qPCR SYBR Green mix (AbGene) on a Bio-Rad C1000 Thermal Cycler (Sheean et al, 2014). Expression levels were determined using the 2-ΔΔCt method using ActB as internal standard.
ChIP-seq and ChIP-PCR
We generated a new pancreatic β-cell line using a described protocol (Radvanyi et al, 1993) in order to obtain cells with low passage number and good physiological response to glucose for ChIP-seq analysis.
Specificities of anti-Insm1 antibody were tested by immunohistochemistry and Western blotting on tissue from control and Insm1 mutant mice, and of Neurod1 and Foxa2 antibodies by Western blotting (Supplementary Fig S4C). Chromatin precipitation was done essentially as described by Lee et al (2006). The PCR primers used for chromatin analysis are shown in Supplementary Table S9. ChIP-PCR performed with anti-Insm1, anti-Neurod1 and anti-Foxa2 antibodies relied on the use of protein A (Insm1, Neurod1) and protein G (Foxa2) beads. Shown for ChIP-PCR are data from one experiment representative of 2–3 samples (Gao et al, 2008).
Chromatin-immunoprecipitated DNA was used to prepare Illumina ChIP-seq (Insm1, Neurod1, Foxa2 and IgG controls) libraries according to the manufacturers’ protocol. In brief, starting from 10–20 ng of ChIP-DNA, the following library preparation steps were performed for each sample (Pasquali et al, 2014): end-repair, A-tailing, adapter ligation, gel purification and a final PCR enrichment. After quality control on an Agilent Bioanalyzer and quantification of the final library on a Qubit, we proceeded with cluster generation and sequencing. Single-end 51-nt reads were generated, and reads that did not pass the Illumina chastity filter were filtered out. The number of reads obtained from the libraries used to compare Insm1 (148 × 106, 189 × 106), Neurod1 (114 × 106) and Foxa2 (36 × 106, 45 × 106) sites was on average 79% mappable (see also computational analyses). The data were visualized using the UCSC genome browser.
Computational analyses
Reads obtained by sequencing of the libraries were mapped to the mouse (mm9) genome using Bowtie. Reads that mapped with more than 2 mismatches or to more than one position were discarded from further analysis. Peaks were called using Macs software (Zhang et al, 2008) with default parameters. To visualize peaks in UCSC genome browser, the Bowtie output was converted to a BigWig format. We assigned a read cutoff to binding sites. For the first Insm1 ChIP-seq experiment, a peak height of 60 was taken as a cutoff. The cutoffs of all further experiments were accordingly normalized to the total number of mapped reads. Two independent ChIP-seq data sets for Insm1 and Foxa2 binding were generated, and we considered only those sites present in both replicates for further analysis (Supplementary Fig S4B). The two replicates of Neurod1 were dissimilar in coverage but displayed large overlap; for the analysis, the single data set with higher coverage was used.
Start and end coordinates of the binding sites were defined as the positions were the number of reads reached 50% of the peak height. Consensus binding site coordinates were then defined as the minimum start and maximum end of the peaks that were defined in the two replicates. Binding sites were annotated as being located in promoter, UTR, intron or exon sequences using the UCSC RefSeq table. When a particular binding site fell into several categories, it was scored only once, according to the following priorities: promoter, UTR, intron and exon. Data processing and visualization was performed with PERL and R scripts. To define the significance in correlation between changes in gene expression and presence of Insm1 or Insm1/Neurod1/Foxa2 binding sites, we used Fisher’s exact test.
Motif analysis in identified binding regions was done using MEME (Bailey et al, 2009); 500 binding sites containing the highest peak counts were used for analysis. To define in the entire data set numbers of sites containing a motif, we used FIMO (Grant et al, 2011) (P-value < 10−3). The motif search was applied to ±25 nucleotides around the peak mode. GO term analysis was performed by using the MGI Gene Ontology Term Finder (http://www.informatics.jax.org/gotools/MGI_Term_Finder.html).
The correlation between deregulated genes in coInsm1 mutant islets and various categories of binding sites was analyzed, and the best correlation was found for Insm1/Neurod1/Foxa2 sites. This analysis was complicated by the fact that genes often contain two or more binding sites (e.g., Insm1/Neurod1/Foxa2 and Insm1 only site). Therefore, equivalent analyses were performed after excluding genes with binding sites of multiple categories. Insm1/Neurod1/Foxa2 sites remained the most enriched category in deregulated genes (data summarized in Supplementary Table S5). Insm1 sites were converted to human (hg19) coordinates with UCSC liftOver tool. SNPs with genome-wide association for 14 traits in European individuals were retrieved from the GWAS catalog (P-value < 5 × 10⁻⁸) (Hindorff et al, 2014). The list of SNPs were pruned using PLINK tools with the following command: –indep-pairwise 100 10 0.2 (Purcell et al, 2007), generating a list of index SNPs. The pruning step eliminates SNPs that are in linkage disequilibrium and results in a list of index SNPs in which each disease associated locus is represented by a single SNP. Each index SNP was used to identify sequence variants in high linkage disequilibrium (r2 > 0.8), creating a final SNP list. The variants were identified in the 1,000 Genomes Project CEU (Utah residents of northern and western European ancestry) pilot 1 data. Insm1 binding sites (±250 bp of the start and end of the binding site defined as the positions where the number of reads reached 50% of the peak height) that overlapped with the final SNP list were identified. To test for enrichment, we generated a random set of sequences of identical length with the same genome annotation (such as intron, exon, promoter, UTR) as the Insm1 binding site data set and again tested for the presence SNPs in these sequences. The procedure was repeated 10,000 times. The P-values were calculated as the fraction of runs in which the number of SNPs in random sequences was as large or larger than the number of SNPs in Insm1 binding sites.
Electron microscopy
Pancreata from mice were fixed in 4% formaldehyde in phosphate buffer and postfixed in 2% formaldehyde and 1% glutaraldehyde in phosphate buffer. After treatment with 1% osmium tetroxide and dehydration, the tissue was embedded in Poly/Bed 812 (Polysciences, Inc., Eppelheim, Germany). Ultrathin sections were stained with uranyl acetate and lead citrate and examined using a FEI Morgagni electron microscope. Digital images were taken with a Morada CCD camera and the iTEM software (Olympus Soft Imaging Solutions GmbH, Münster, Germany).
Luciferase assays and siRNA experiments
DNA fragments (average size 678 bp; the exact sequence coordinates are given in Supplemental Table S9) were cloned upstream of a minimal promoter driving the firefly luciferase gene (pGL4.23[luc2/minP] vector; Promega). The selected fragments were derived from genes whose expression was deregulated in co-Insm1 mutant islets and had been assigned as bound by Insm1 using ChIP-seq in SJ β-cells and ChIP-PCR of isolated islets. Using Lipofectamine 2000 (Invitrogen), SJ β-cells, HepG2 or HEK293 cells were transfected with the firefly luciferase plasmid containing putative cis-regulatory sequences; as an internal control, Renilla luciferase plasmid (pRL-TK Renilla; Promega) was co-transfected. Cell lysates were prepared 24 h after transfection, and luciferase activity was determined using Dual-Luciferase® Reporter Assay kits (Promega). For each sample (n = 4, Ciofani et al, 2012), firefly luciferase values were normalized to Renilla luciferase values. We display relative luciferase activity as a fold change compared to empty pGL4.23 vector.
siRNAs against Insm1, Neurod1 and Foxa2 mRNAs were delivered by electroporation using Amaxa kit V and program G-16 according to the protocol provided by the manufacturer. Mouse Insm1 and non-targeting control siRNAs were purchased from Dharmacon (J-049233 -09/-11/-12 for Insm1 and D-001810-10 for control). Mouse Neurod1 and Foxa2 siRNAs were purchased from Ambion (s201725, s67628).
Data availability
Relevant gene expression and ChIP-seq data have been deposited in the GEO database under the following accession numbers: GSE54044 and GSE54046.
Acknowledgments
We want to thank Michael Strehle (MDC Berlin) for help during computational analyses and preparation of the manuscript, Bettina Brandt for technical assistance, Petra Stallerow and Claudia Päseler for expert animal husbandry support, and Gabriele Born for performing microarray hybridizations (all at the MDC, Berlin). We also thank Malgorzata Borowiak (Baylor College of Medicine, Houston, Texas), Walter Birchmeier, Matthias Treier and Uwe Ohler (MDC, Berlin) for helpful discussions and critical reading of the manuscript. This work was supported by a grant from the BIH to C.B. and a grant of the China Scholarship Council (CSC) to W.S.
Author contributions
SJ performed genetic, biochemical and physiological experiments, experimentally confirmed computational data and designed experiments; AI performed computational analyses. DB generated the Insm1flox strain, WS generated ChIP-seq libraries and sequences, TM helped with generation of confocal images and figures, BP performed electron microscopy, WC, MNP and NR supervised library production/deep sequencing, physiological experiments and computational analysis, respectively. CB supervised the project and wrote the article.
Conflict of interest
The authors declare that they have no conflict of interest.
Supporting Information
Supplementary Figure S1
Supplementary Figure S2
Supplementary Figure S3
Supplementary Figure S4
Supplementary Figure S5
Supplementary Figure Legends
Supplementary Table S1
Supplementary Table S2
Supplementary Table S3
Supplementary Table S4
Supplementary Table S5
Supplementary Table S6
Supplementary Table S7
Supplementary Table S8
Supplementary Table S9
Source Data for Supplementary Figure S4
Review Process File
Source Data for Figure 2
Source Data for Figure 4
Source Data for Figure 7
References
- Ahlgren U, Jonsson J, Jonsson L, Simu K, Edlund H. beta-cell-specific inactivation of the mouse Ipf1/Pdx1 gene results in loss of the beta-cell phenotype and maturity onset diabetes. Genes Dev. 1998;12:1763–1768. doi: 10.1101/gad.12.12.1763. [DOI] [PMC free article] [PubMed] [Google Scholar]
- Artner I, Hang Y, Mazur M, Yamamoto T, Guo M, Lindner J, Magnuson MA, Stein R. MafA and MafB regulate genes critical to beta-cells in a unique temporal manner. Diabetes. 2010;59:2530–2539. doi: 10.2337/db10-0190. [DOI] [PMC free article] [PubMed] [Google Scholar]
- Babenko AP, Polak M, Cave H, Busiah K, Czernichow P, Scharfmann R, Bryan J, Aguilar-Bryan L, Vaxillaire M, Froguel P. Activating mutations in the ABCC8 gene in neonatal diabetes mellitus. N Engl J Med. 2006;355:456–466. doi: 10.1056/NEJMoa055068. [DOI] [PubMed] [Google Scholar]
- Baggio LL, Drucker DJ. Biology of incretins: GLP-1 and GIP. Gastroenterology. 2007;132:2131–2157. doi: 10.1053/j.gastro.2007.03.054. [DOI] [PubMed] [Google Scholar]
- Bailey TL, Boden M, Buske FA, Frith M, Grant CE, Clementi L, Ren J, Li WW, Noble WS. MEME SUITE: tools for motif discovery and searching. Nucleic Acids Res. 2009;37:W202–W208. doi: 10.1093/nar/gkp335. [DOI] [PMC free article] [PubMed] [Google Scholar]
- Becker TC, BeltrandelRio H, Noel RJ, Johnson JH, Newgard CB. Overexpression of hexokinase I in isolated islets of Langerhans via recombinant adenovirus. Enhancement of glucose metabolism and insulin secretion at basal but not stimulatory glucose levels. J Biol Chem. 1994;269:21234–21238. [PubMed] [Google Scholar]
- Blum B, Hrvatin SS, Schuetz C, Bonal C, Rezania A, Melton DA. Functional beta-cell maturation is marked by an increased glucose threshold and by expression of urocortin 3. Nat Biotechnol. 2012;30:261–264. doi: 10.1038/nbt.2141. [DOI] [PMC free article] [PubMed] [Google Scholar]
- Bonn S, Furlong EE. cis-Regulatory networks during development: a view of Drosophila. Curr Opin Genet Dev. 2008;18:513–520. doi: 10.1016/j.gde.2008.09.005. [DOI] [PubMed] [Google Scholar]
- Breslin MB, Zhu M, Notkins AL, Lan MS. Neuroendocrine differentiation factor, IA-1, is a transcriptional repressor and contains a specific DNA-binding domain: identification of consensus IA-1 binding sequence. Nucleic Acids Res. 2002;30:1038–1045. doi: 10.1093/nar/30.4.1038. [DOI] [PMC free article] [PubMed] [Google Scholar]
- Carvalho CP, Barbosa HC, Britan A, Santos-Silva JC, Boschero AC, Meda P, Collares-Buzato CB. Beta cell coupling and connexin expression change during the functional maturation of rat pancreatic islets. Diabetologia. 2010;53:1428–1437. doi: 10.1007/s00125-010-1726-8. [DOI] [PubMed] [Google Scholar]
- Ciofani M, Madar A, Galan C, Sellars M, Mace K, Pauli F, Agarwal A, Huang W, Parkurst CN, Muratet M, Newberry KM, Meadows S, Greenfield A, Yang Y, Jain P, Kirigin FK, Birchmeier C, Wagner EF, Murphy KM, Myers RM, et al. A validated regulatory network for Th17 cell specification. Cell. 2012;151:289–303. doi: 10.1016/j.cell.2012.09.016. [DOI] [PMC free article] [PubMed] [Google Scholar]
- Colsoul B, Schraenen A, Lemaire K, Quintens R, Van Lommel L, Segal A, Owsianik G, Talavera K, Voets T, Margolskee RF, Kokrashvili Z, Gilon P, Nilius B, Schuit FC, Vennekens R. Loss of high-frequency glucose-induced Ca2 + oscillations in pancreatic islets correlates with impaired glucose tolerance in Trpm5-/- mice. Proc Natl Acad Sci USA. 2010;107:5208–5213. doi: 10.1073/pnas.0913107107. [DOI] [PMC free article] [PubMed] [Google Scholar]
- Creyghton MP, Cheng AW, Welstead GG, Kooistra T, Carey BW, Steine EJ, Hanna J, Lodato MA, Frampton GM, Sharp PA, Boyer LA, Young RA, Jaenisch R. Histone H3K27ac separates active from poised enhancers and predicts developmental state. Proc Natl Acad Sci USA. 2010;107:21931–21936. doi: 10.1073/pnas.1016071107. [DOI] [PMC free article] [PubMed] [Google Scholar]
- D’Amour KA, Bang AG, Eliazer S, Kelly OG, Agulnick AD, Smart NG, Moorman MA, Kroon E, Carpenter MK, Baetge EE. Production of pancreatic hormone-expressing endocrine cells from human embryonic stem cells. Nat Biotechnol. 2006;24:1392–1401. doi: 10.1038/nbt1259. [DOI] [PubMed] [Google Scholar]
- Davidson EH. Genomic Regulatory Systems: Development and Evolution. San Diego: Academic Press Inc; 2001. [Google Scholar]
- Dor Y, Brown J, Martinez OI, Melton DA. Adult pancreatic beta-cells are formed by self-duplication rather than stem-cell differentiation. Nature. 2004;429:41–46. doi: 10.1038/nature02520. [DOI] [PubMed] [Google Scholar]
- Dor Y, Glaser B. beta-cell dedifferentiation and type 2 diabetes. N Engl J Med. 2013;368:572–573. doi: 10.1056/NEJMcibr1214034. [DOI] [PubMed] [Google Scholar]
- Gao N, White P, Doliba N, Golson ML, Matschinsky FM, Kaestner KH. Foxa2 controls vesicle docking and insulin secretion in mature Beta cells. Cell Metab. 2007;6:267–279. doi: 10.1016/j.cmet.2007.08.015. [DOI] [PubMed] [Google Scholar]
- Gao N, LeLay J, Vatamaniuk MZ, Rieck S, Friedman JR, Kaestner KH. Dynamic regulation of Pdx1 enhancers by Foxa1 and Foxa2 is essential for pancreas development. Genes Dev. 2008;22:3435–3448. doi: 10.1101/gad.1752608. [DOI] [PMC free article] [PubMed] [Google Scholar]
- Gao N, Le Lay J, Qin W, Doliba N, Schug J, Fox AJ, Smirnova O, Matschinsky FM, Kaestner KH. Foxa1 and Foxa2 maintain the metabolic and secretory features of the mature beta-cell. Mol Endocrinol. 2010;24:1594–1604. doi: 10.1210/me.2009-0513. [DOI] [PMC free article] [PubMed] [Google Scholar]
- Gerrish K, Gannon M, Shih D, Henderson E, Stoffel M, Wright CV, Stein R. Pancreatic beta cell-specific transcription of the pdx-1 gene. The role of conserved upstream control regions and their hepatic nuclear factor 3beta sites. J Biol Chem. 2000;275:3485–3492. doi: 10.1074/jbc.275.5.3485. [DOI] [PubMed] [Google Scholar]
- Gierl MS, Karoulias N, Wende H, Strehle M, Birchmeier C. The zinc-finger factor Insm1 (IA-1) is essential for the development of pancreatic beta cells and intestinal endocrine cells. Genes Dev. 2006;20:2465–2478. doi: 10.1101/gad.381806. [DOI] [PMC free article] [PubMed] [Google Scholar]
- Grant CE, Bailey TL, Noble WS. FIMO: scanning for occurrences of a given motif. Bioinformatics. 2011;27:1017–1018. doi: 10.1093/bioinformatics/btr064. [DOI] [PMC free article] [PubMed] [Google Scholar]
- Grossmann KS, Wende H, Paul FE, Cheret C, Garratt AN, Zurborg S, Feinberg K, Besser D, Schulz H, Peles E, Selbach M, Birchmeier W, Birchmeier C. The tyrosine phosphatase Shp2 (PTPN11) directs Neuregulin-1/ErbB signaling throughout Schwann cell development. Proc Natl Acad Sci USA. 2009;106:16704–16709. doi: 10.1073/pnas.0904336106. [DOI] [PMC free article] [PubMed] [Google Scholar]
- Gu C, Stein GH, Pan N, Goebbels S, Hornberg H, Nave KA, Herrera P, White P, Kaestner KH, Sussel L, Lee JE. Pancreatic beta cells require NeuroD to achieve and maintain functional maturity. Cell Metab. 2010;11:298–310. doi: 10.1016/j.cmet.2010.03.006. [DOI] [PMC free article] [PubMed] [Google Scholar]
- Guillam MT, Hummler E, Schaerer E, Yeh JI, Birnbaum MJ, Beermann F, Schmidt A, Deriaz N, Thorens B. Early diabetes and abnormal postnatal pancreatic islet development in mice lacking Glut-2. Nat Genet. 1997;17:327–330. doi: 10.1038/ng1197-327. [DOI] [PubMed] [Google Scholar]
- Halban PA, Wollheim CB, Blondel B, Meda P, Niesor EN, Mintz DH. The possible importance of contact between pancreatic islet cells for the control of insulin release. Endocrinology. 1982;111:86–94. doi: 10.1210/endo-111-1-86. [DOI] [PubMed] [Google Scholar]
- Hang Y, Yamamoto T, Benninger RK, Brissova M, Guo M, Bush W, Piston DW, Powers AC, Magnuson M, Thurmond DC, Stein R. The MafA transcription factor becomes essential to islet beta-cells soon after birth. Diabetes. 2014;63:1994–2005. doi: 10.2337/db13-1001. [DOI] [PMC free article] [PubMed] [Google Scholar]
- Hindorff LA, MacArthur JEBI, Morales JEBI, Junkins HA, Hall PN, Klemm AK, Manolio TA. 2014. A Catalog of Published Genome-Wide Association Studies . Available at: www.genome.gov/gwastudies.
- Hnisz D, Abraham BJ, Lee TI, Lau A, Saint-Andre V, Sigova AA, Hoke HA, Young RA. Super-enhancers in the control of cell identity and disease. Cell. 2013;155:934–947. doi: 10.1016/j.cell.2013.09.053. [DOI] [PMC free article] [PubMed] [Google Scholar]
- Holland AM, Hale MA, Kagami H, Hammer RE, MacDonald RJ. Experimental control of pancreatic development and maintenance. Proc Natl Acad Sci USA. 2002;99:12236–12241. doi: 10.1073/pnas.192255099. [DOI] [PMC free article] [PubMed] [Google Scholar]
- Holmberg J, Perlmann T. Maintaining differentiated cellular identity. Nat Rev Genet. 2012;13:429–439. doi: 10.1038/nrg3209. [DOI] [PubMed] [Google Scholar]
- Huber W, Gentleman R. matchprobes: a Bioconductor package for the sequence-matching of microarray probe elements. Bioinformatics. 2004;20:1651–1652. doi: 10.1093/bioinformatics/bth133. [DOI] [PubMed] [Google Scholar]
- Kluth O, Matzke D, Schulze G, Schwenk RW, Joost HG, Schurmann A. Differential transcriptome analysis of diabetes-resistant and -sensitive mouse islets reveals significant overlap with human diabetes susceptibility genes. Diabetes. 2014;63:4230–4238. doi: 10.2337/db14-0425. [DOI] [PubMed] [Google Scholar]
- Kubota N, Terauchi Y, Tobe K, Yano W, Suzuki R, Ueki K, Takamoto I, Satoh H, Maki T, Kubota T, Moroi M, Okada-Iwabu M, Ezaki O, Nagai R, Ueta Y, Kadowaki T, Noda T. Insulin receptor substrate 2 plays a crucial role in beta cells and the hypothalamus. J Clin Invest. 2004;114:917–927. doi: 10.1172/JCI21484. [DOI] [PMC free article] [PubMed] [Google Scholar]
- Kulkarni RN, Holzenberger M, Shih DQ, Ozcan U, Stoffel M, Magnuson MA, Kahn CR. beta-cell-specific deletion of the Igf1 receptor leads to hyperinsulinemia and glucose intolerance but does not alter beta-cell mass. Nat Genet. 2002;31:111–115. doi: 10.1038/ng872. [DOI] [PubMed] [Google Scholar]
- Lai JS, Herr W. Ethidium bromide provides a simple tool for identifying genuine DNA-independent protein associations. Proc Natl Acad Sci USA. 1992;89:6958–6962. doi: 10.1073/pnas.89.15.6958. [DOI] [PMC free article] [PubMed] [Google Scholar]
- Lang J. Molecular mechanisms and regulation of insulin exocytosis as a paradigm of endocrine secretion. Eur J Biochem. 1999;259:3–17. doi: 10.1046/j.1432-1327.1999.00043.x. [DOI] [PubMed] [Google Scholar]
- Lantz KA, Vatamaniuk MZ, Brestelli JE, Friedman JR, Matschinsky FM, Kaestner KH. Foxa2 regulates multiple pathways of insulin secretion. J Clin Invest. 2004;114:512–520. doi: 10.1172/JCI21149. [DOI] [PMC free article] [PubMed] [Google Scholar]
- Lee TI, Johnstone SE, Young RA. Chromatin immunoprecipitation and microarray-based analysis of protein location. Nat Protoc. 2006;1:729–748. doi: 10.1038/nprot.2006.98. [DOI] [PMC free article] [PubMed] [Google Scholar]
- Leroux L, Desbois P, Lamotte L, Duvillie B, Cordonnier N, Jackerott M, Jami J, Bucchini D, Joshi RL. Compensatory responses in mice carrying a null mutation for Ins1 or Ins2. Diabetes. 2001;50(Suppl 1):S150–S153. doi: 10.2337/diabetes.50.2007.s150. [DOI] [PubMed] [Google Scholar]
- MacDonald PE, Joseph JW, Rorsman P. Glucose-sensing mechanisms in pancreatic beta-cells. Philos Trans R Soc Lond B Biol Sci. 2005;360:2211–2225. doi: 10.1098/rstb.2005.1762. [DOI] [PMC free article] [PubMed] [Google Scholar]
- Mastracci TL, Anderson KR, Papizan JB, Sussel L. Regulation of Neurod1 contributes to the lineage potential of Neurogenin3 + endocrine precursor cells in the pancreas. PLoS Genet. 2013;9:e1003278. doi: 10.1371/journal.pgen.1003278. [DOI] [PMC free article] [PubMed] [Google Scholar]
- Mellitzer G, Bonne S, Luco RF, Van De Casteele M, Lenne-Samuel N, Collombat P, Mansouri A, Lee J, Lan M, Pipeleers D, Nielsen FC, Ferrer J, Gradwohl G, Heimberg H. IA1 is NGN3-dependent and essential for differentiation of the endocrine pancreas. EMBO J. 2006;25:1344–1352. doi: 10.1038/sj.emboj.7601011. [DOI] [PMC free article] [PubMed] [Google Scholar]
- van der Meulen T, Xie R, Kelly OG, Vale WW, Sander M, Huising MO. Urocortin 3 marks mature human primary and embryonic stem cell-derived pancreatic alpha and beta cells. PLoS ONE. 2012;7:e52181. doi: 10.1371/journal.pone.0052181. [DOI] [PMC free article] [PubMed] [Google Scholar]
- Morris AP, Voight BF, Teslovich TM, Ferreira T, Segre AV, Steinthorsdottir V, Strawbridge RJ, Khan H, Grallert H, Mahajan A, Prokopenko I, Kang HM, Dina C, Esko T, Fraser RM, Kanoni S, Kumar A, Lagou V, Langenberg C, Luan J, et al. Large-scale association analysis provides insights into the genetic architecture and pathophysiology of type 2 diabetes. Nat Genet. 2012;44:981–990. doi: 10.1038/ng.2383. [DOI] [PMC free article] [PubMed] [Google Scholar]
- Muzumdar MD, Tasic B, Miyamichi K, Li L, Luo L. A global double-fluorescent Cre reporter mouse. Genesis. 2007;45:593–605. doi: 10.1002/dvg.20335. [DOI] [PubMed] [Google Scholar]
- Naya FJ, Huang HP, Qiu Y, Mutoh H, DeMayo FJ, Leiter AB, Tsai MJ. Diabetes, defective pancreatic morphogenesis, and abnormal enteroendocrine differentiation in BETA2/neuroD-deficient mice. Genes Dev. 1997;11:2323–2334. doi: 10.1101/gad.11.18.2323. [DOI] [PMC free article] [PubMed] [Google Scholar]
- Newburger DE, Bulyk ML. UniPROBE: an online database of protein binding microarray data on protein-DNA interactions. Nucleic Acids Res. 2009;37:D77–D82. doi: 10.1093/nar/gkn660. [DOI] [PMC free article] [PubMed] [Google Scholar]
- Nostro MC, Keller G. Generation of beta cells from human pluripotent stem cells: potential for regenerative medicine. Semin Cell Dev Biol. 2012;23:701–710. doi: 10.1016/j.semcdb.2012.06.010. [DOI] [PMC free article] [PubMed] [Google Scholar]
- Osipovich AB, Long Q, Manduchi E, Gangula R, Hipkens SB, Schneider J, Okubo T, Stoeckert CJ, Jr, Takada S, Magnuson MA. Insm1 promotes endocrine cell differentiation by modulating the expression of a network of genes that includes Neurog3 and Ripply3. Development. 2014;141:2939–2949. doi: 10.1242/dev.104810. [DOI] [PMC free article] [PubMed] [Google Scholar]
- Pagliuca FW, Millman JR, Gurtler M, Segel M, Van Dervort A, Ryu JH, Peterson QP, Greiner D, Melton DA. Generation of functional human pancreatic beta cells in vitro. Cell. 2014;159:428–439. doi: 10.1016/j.cell.2014.09.040. [DOI] [PMC free article] [PubMed] [Google Scholar]
- Pasquali L, Gaulton KJ, Rodriguez-Segui SA, Mularoni L, Miguel-Escalada I, Akerman I, Tena JJ, Moran I, Gomez-Marin C, van de Bunt M, Ponsa-Cobas J, Castro N, Nammo T, Cebola I, Garcia-Hurtado J, Maestro MA, Pattou F, Piemonti L, Berney T, Gloyn AL, et al. Pancreatic islet enhancer clusters enriched in type 2 diabetes risk-associated variants. Nat Genet. 2014;46:136–143. doi: 10.1038/ng.2870. [DOI] [PMC free article] [PubMed] [Google Scholar]
- Poy MN, Eliasson L, Krutzfeldt J, Kuwajima S, Ma X, Macdonald PE, Pfeffer S, Tuschl T, Rajewsky N, Rorsman P, Stoffel M. A pancreatic islet-specific microRNA regulates insulin secretion. Nature. 2004;432:226–230. doi: 10.1038/nature03076. [DOI] [PubMed] [Google Scholar]
- Poy MN, Hausser J, Trajkovski M, Braun M, Collins S, Rorsman P, Zavolan M, Stoffel M. miR-375 maintains normal pancreatic alpha- and beta-cell mass. Proc Natl Acad Sci USA. 2009;106:5813–5818. doi: 10.1073/pnas.0810550106. [DOI] [PMC free article] [PubMed] [Google Scholar]
- Purcell S, Neale B, Todd-Brown K, Thomas L, Ferreira MA, Bender D, Maller J, Sklar P, de Bakker PI, Daly MJ, Sham PC. PLINK: a tool set for whole-genome association and population-based linkage analyses. Am J Hum Genet. 2007;81:559–575. doi: 10.1086/519795. [DOI] [PMC free article] [PubMed] [Google Scholar]
- Radvanyi F, Christgau S, Baekkeskov S, Jolicoeur C, Hanahan D. Pancreatic beta cells cultured from individual preneoplastic foci in a multistage tumorigenesis pathway: a potentially general technique for isolating physiologically representative cell lines. Mol Cell Biol. 1993;13:4223–4232. doi: 10.1128/mcb.13.7.4223. [DOI] [PMC free article] [PubMed] [Google Scholar]
- Raum JC, Gerrish K, Artner I, Henderson E, Guo M, Sussel L, Schisler JC, Newgard CB, Stein R. FoxA2, Nkx2.2, and PDX-1 regulate islet beta-cell-specific mafA expression through conserved sequences located between base pairs -8,118 and -7,750 upstream from the transcription start site. Mol Cell Biol. 2006;26:5735–5743. doi: 10.1128/MCB.00249-06. [DOI] [PMC free article] [PubMed] [Google Scholar]
- Rodriguez CI, Buchholz F, Galloway J, Sequerra R, Kasper J, Ayala R, Stewart AF, Dymecki SM. High-efficiency deleter mice show that FLPe is an alternative to Cre-loxP. Nat Genet. 2000;25:139–140. doi: 10.1038/75973. [DOI] [PubMed] [Google Scholar]
- Rorsman P, Arkhammar P, Bokvist K, Hellerstrom C, Nilsson T, Welsh M, Welsh N, Berggren PO. Failure of glucose to elicit a normal secretory response in fetal pancreatic beta cells results from glucose insensitivity of the ATP-regulated K+ channels. Proc Natl Acad Sci USA. 1989;86:4505–4509. doi: 10.1073/pnas.86.12.4505. [DOI] [PMC free article] [PubMed] [Google Scholar]
- Scott RA, Lagou V, Welch RP, Wheeler E, Montasser ME, Luan J, Magi R, Strawbridge RJ, Rehnberg E, Gustafsson S, Kanoni S, Rasmussen-Torvik LJ, Yengo L, Lecoeur C, Shungin D, Sanna S, Sidore C, Johnson PC, Jukema JW, Johnson T, et al. Large-scale association analyses identify new loci influencing glycemic traits and provide insight into the underlying biological pathways. Nat Genet. 2012;44:991–1005. doi: 10.1038/ng.2385. [DOI] [PMC free article] [PubMed] [Google Scholar]
- Sheean ME, McShane E, Cheret C, Walcher J, Muller T, Wulf-Goldenberg A, Hoelper S, Garratt AN, Kruger M, Rajewsky K, Meijer D, Birchmeier W, Lewin GR, Selbach M, Birchmeier C. Activation of MAPK overrides the termination of myelin growth and replaces Nrg1/ErbB3 signals during Schwann cell development and myelination. Genes Dev. 2014;28:290–303. doi: 10.1101/gad.230045.113. [DOI] [PMC free article] [PubMed] [Google Scholar]
- Stanojevic V, Habener JF, Holz GG, Leech CA. Cytosolic adenylate kinases regulate K-ATP channel activity in human beta-cells. Biochem Biophys Res Commun. 2008;368:614–619. doi: 10.1016/j.bbrc.2008.01.109. [DOI] [PMC free article] [PubMed] [Google Scholar]
- Sugden MC, Holness MJ. The pyruvate carboxylase-pyruvate dehydrogenase axis in islet pyruvate metabolism: going round in circles? Islets. 2013;3:302–319. doi: 10.4161/isl.3.6.17806. [DOI] [PMC free article] [PubMed] [Google Scholar]
- Szabat M, Lynn FC, Hoffman BG, Kieffer TJ, Allan DW, Johnson JD. Maintenance of beta-cell maturity and plasticity in the adult pancreas: developmental biology concepts in adult physiology. Diabetes. 2012;61:1365–1371. doi: 10.2337/db11-1361. [DOI] [PMC free article] [PubMed] [Google Scholar]
- Taylor BL, Liu FF, Sander M. Nkx6.1 is essential for maintaining the functional state of pancreatic beta cells. Cell Rep. 2013;4:1262–1275. doi: 10.1016/j.celrep.2013.08.010. [DOI] [PMC free article] [PubMed] [Google Scholar]
- Tennant BR, Robertson AG, Kramer M, Li L, Zhang X, Beach M, Thiessen N, Chiu R, Mungall K, Whiting CJ, Sabatini PV, Kim A, Gottardo R, Marra MA, Lynn FC, Jones SJ, Hoodless PA, Hoffman BG. Identification and analysis of murine pancreatic islet enhancers. Diabetologia. 2013;56:542–552. doi: 10.1007/s00125-012-2797-5. [DOI] [PMC free article] [PubMed] [Google Scholar]
- Truax AD, Greer SF. ChIP and Re-ChIP assays: investigating interactions between regulatory proteins, histone modifications, and the DNA sequences to which they bind. Methods Mol Biol. 2012;809:175–188. doi: 10.1007/978-1-61779-376-9_12. [DOI] [PubMed] [Google Scholar]
- Tseng CC, Zhang XY. Role of regulator of G protein signaling in desensitization of the glucose-dependent insulinotropic peptide receptor. Endocrinology. 1998;139:4470–4475. doi: 10.1210/endo.139.11.6282. [DOI] [PubMed] [Google Scholar]
- Wang Y, Martin CC, Oeser JK, Sarkar S, McGuinness OP, Hutton JC, O’Brien RM. Deletion of the gene encoding the islet-specific glucose-6-phosphatase catalytic subunit-related protein autoantigen results in a mild metabolic phenotype. Diabetologia. 2007;50:774–778. doi: 10.1007/s00125-006-0564-1. [DOI] [PubMed] [Google Scholar]
- Wang Z, York NW, Nichols CG, Remedi MS. Pancreatic beta Cell Dedifferentiation in Diabetes and Redifferentiation following Insulin Therapy. Cell Metab. 2014;19:872–882. doi: 10.1016/j.cmet.2014.03.010. [DOI] [PMC free article] [PubMed] [Google Scholar]
- Weir GC, Bonner-Weir S. Five stages of evolving beta-cell dysfunction during progression to diabetes. Diabetes. 2004;53(Suppl 3):S16–S21. doi: 10.2337/diabetes.53.suppl_3.s16. [DOI] [PubMed] [Google Scholar]
- Welcker JE, Hernandez-Miranda LR, Paul FE, Jia S, Ivanov A, Selbach M, Birchmeier C. Insm1 controls development of pituitary endocrine cells and requires a SNAG domain for function and for recruitment of histone-modifying factors. Development. 2013;140:4947–4958. doi: 10.1242/dev.097642. [DOI] [PubMed] [Google Scholar]
- Wildner H, Gierl MS, Strehle M, Pla P, Birchmeier C. Insm1 (IA-1) is a crucial component of the transcriptional network that controls differentiation of the sympatho-adrenal lineage. Development. 2008;135:473–481. doi: 10.1242/dev.011783. [DOI] [PubMed] [Google Scholar]
- Xu J, Han J, Long YS, Epstein PN, Liu YQ. The role of pyruvate carboxylase in insulin secretion and proliferation in rat pancreatic beta cells. Diabetologia. 2008;51:2022–2030. doi: 10.1007/s00125-008-1130-9. [DOI] [PMC free article] [PubMed] [Google Scholar]
- Zhang Y, Liu T, Meyer CA, Eeckhoute J, Johnson DS, Bernstein BE, Nusbaum C, Myers RM, Brown M, Li W, Liu XS. Model-based analysis of ChIP-Seq (MACS) Genome Biol. 2008;9:R137. doi: 10.1186/gb-2008-9-9-r137. [DOI] [PMC free article] [PubMed] [Google Scholar]
- Ziv O, Glaser B, Dor Y. The plastic pancreas. Dev Cell. 2013;26:3–7. doi: 10.1016/j.devcel.2013.06.013. [DOI] [PubMed] [Google Scholar]
Associated Data
This section collects any data citations, data availability statements, or supplementary materials included in this article.
Supplementary Materials
Supplementary Figure S1
Supplementary Figure S2
Supplementary Figure S3
Supplementary Figure S4
Supplementary Figure S5
Supplementary Figure Legends
Supplementary Table S1
Supplementary Table S2
Supplementary Table S3
Supplementary Table S4
Supplementary Table S5
Supplementary Table S6
Supplementary Table S7
Supplementary Table S8
Supplementary Table S9
Source Data for Supplementary Figure S4
Review Process File
Source Data for Figure 2
Source Data for Figure 4
Source Data for Figure 7
Data Availability Statement
Relevant gene expression and ChIP-seq data have been deposited in the GEO database under the following accession numbers: GSE54044 and GSE54046.