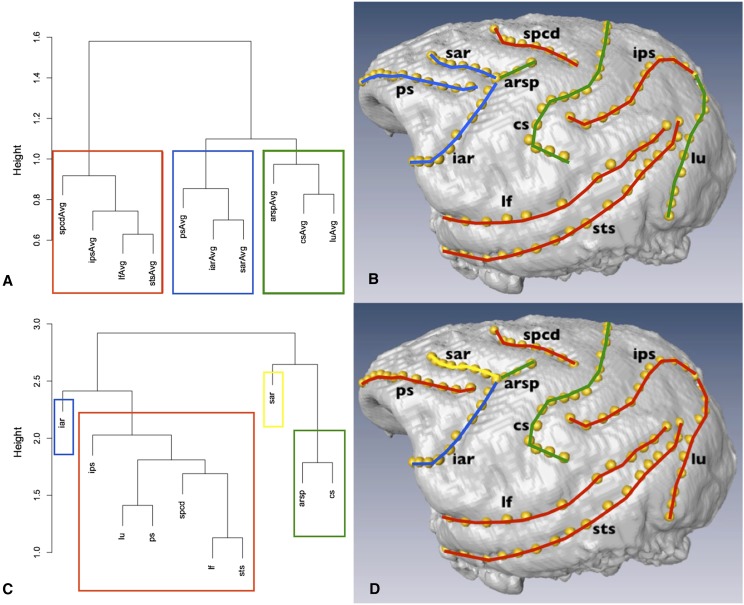
Figure 2.
Sulcus module assignments for phenotype (A and B) and genotype (C and D). Hierarchical clustering dendrograms (left) were created using the average linkage method. Colored boxes illustrate the module borders determined by k-means testing using the Hartigan–Wong algorithm. Annotated endocasts (right) visualize sulcus module assignment. Module color is retained between phenotype and genotype.

