Abstract
The translational control of oncoprotein expression is implicated in many cancers. Here we report an eIF4A/DDX2 RNA helicase-dependent mechanism of translational control that contributes to oncogenesis and underlies the anticancer effects of Silvestrol and related compounds. For example, eIF4A promotes T-ALL development in vivo and is required for leukaemia maintenance. Accordingly, inhibition of eIF4A with Silvestrol has powerful therapeutic effects in vitro and in vivo. We use transcriptome-scale ribosome footprinting to identify the hallmarks of eIF4A-dependent transcripts. These include 5′UTR sequences such as the 12-mer guanine quartet (CGG)4 motif that can form RNA G-quadruplex structures. Notably, among the most eIF4A-dependent and Silvestrol-sensitive transcripts are a number of oncogenes, super-enhancer associated transcription factors, and epigenetic regulators. Hence, the 5′UTRs of selected cancer genes harbour a targetable requirement for the eIF4A RNA helicase.
The activation of translation contributes to malignant transformation and is an emerging target for cancer therapies1,2. For example, oncogenic RAS, ERK, and AKT stimulate cap-dependent translation via mTORC1 and the eIF4E binding protein (4E-BP)3. The initiation of cap-dependent translation involves a tightly controlled multi-protein initiation complex4. This includes the cap-binding protein, eIF4E, that is abundantly expressed in cancer and can transform fibroblasts and promote tumour development in vivo1,5–8. Another key factor is the eIF4A RNA helicase that plays a role in scanning the mRNA 5′UTR for a translation start site and has been implicated in the translation of mRNAs with long and complex 5′UTRs9. EIF4A is the molecular target for three distinct natural compounds – Silvestrol, Hippuristanol, and Pateamine A – and these compounds show promising anti-cancer activity10,11. Recent studies have defined eIF4A’s helicase action, protein interactions12, and revealed a role in microRNA action13. Exactly how eIF4A affects translation and which specific mRNA features necessitate its helicase activity has not been defined.
Ribosome footprinting provides a snapshot of translation across the transcriptome14. It uses deep sequencing to identify ribosome-protected RNA fragments and compare them to total transcript levels. Among the various applications of this technology, the most relevant to this study concern the translational effects of mTORC1 inhibition15,16. We use ribosome footprinting to identify eIF4A-dependent transcripts and their hallmark features.
Results
eIF4A is an oncogene in T-ALL
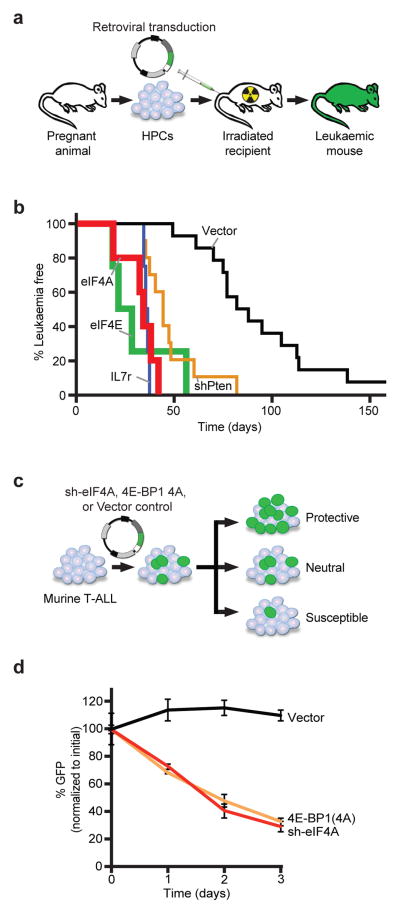
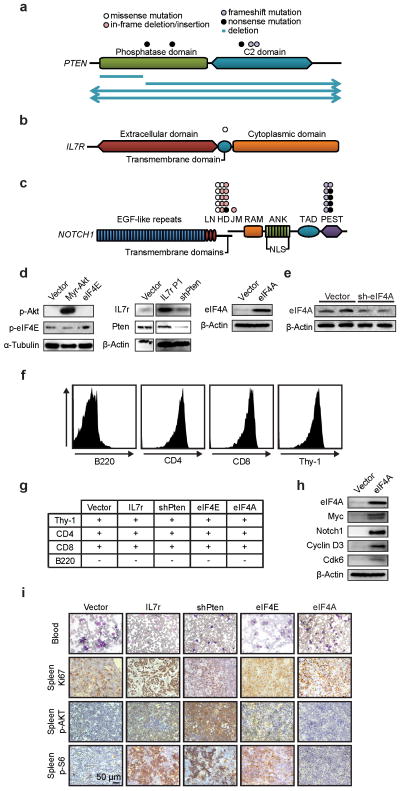
NOTCH-driven T-ALL exemplifies the activation of AKT/mTORC1 and cap-dependent translation in cancer. In 36 paediatric T-ALL samples we find PTEN mutations (14%) and deletions (11%)17, NOTCH1 mutations (56%)18, and IL7R mutation (3%)19 ( Extended Data Fig. 1a–c, Suppl. Table 1). These genetic lesions promote T-ALL development in a murine T-ALL model (Figure 1a)20. Notch causes T-ALL with a mean latency of 91.5 days (n = 14), knockdown of Pten or expression of the mutant IL7r/p.L242-L243ins accelerates disease onset (PTEN: 47.1d; n = 10, p < 0.0001; IL7R: 35.5d, n = 4, p < 0.0001). Remarkably, expression of eIF4E or eIF4A1 similarly accelerates leukaemia development (eIF4E: 30.75d; n = 4, p < 0.0001; eIF4A1: n = 5, p < 0.0001) (Figure 1b, Extended Data Fig. 1d). All T-ALLs are CD4/CD8 double positive, and increased ribosomal S6 phosphorylation indicates mTORC1 activation in PTEN-deficient and IL7R expressing T-ALLs (Extended Data Fig. 1d, f–i). EIF4E and eIF4A1 are required to maintain T-ALL and cells expressing a constitutive 4E-BP1 allele (4E-BP1(4A))21 or an eIF4A1 knockdown construct are rapidly eliminated from mixed populations (Figure 1c/d; Extended Data Fig. 1e) (pVector vs. 4E-BP1(4A) = 0.000002 and pVector vs. sh-eIF4A = 0.000008).
Figure 1. eIF4A promotes T-ALL development in vivo.
a) Diagram of the NOTCH-ICN-driven murine T-ALL model; b) Kaplan-Meier analysis showing time to leukaemia development after transplantation of HPC transduced with NOTCH1-ICN and empty vector (black, n = 14), eIF4E (green, n = 4), eIF4A1 (red, n = 5), IL7r p.L242-L243insNPC (P1) (blue, n = 4), shPten (orange, n = 10); c) Experimental design of competition experiments; d) Results as percentage of each starting GFP positive population of murine T-ALL cells partially transduced with vector/GFP, sh-eIF4A, or the constitutive inhibitory 4E-binding protein (4E-BP1 (4A)), mean and standard deviations are shown, n = 3 biological replicates.
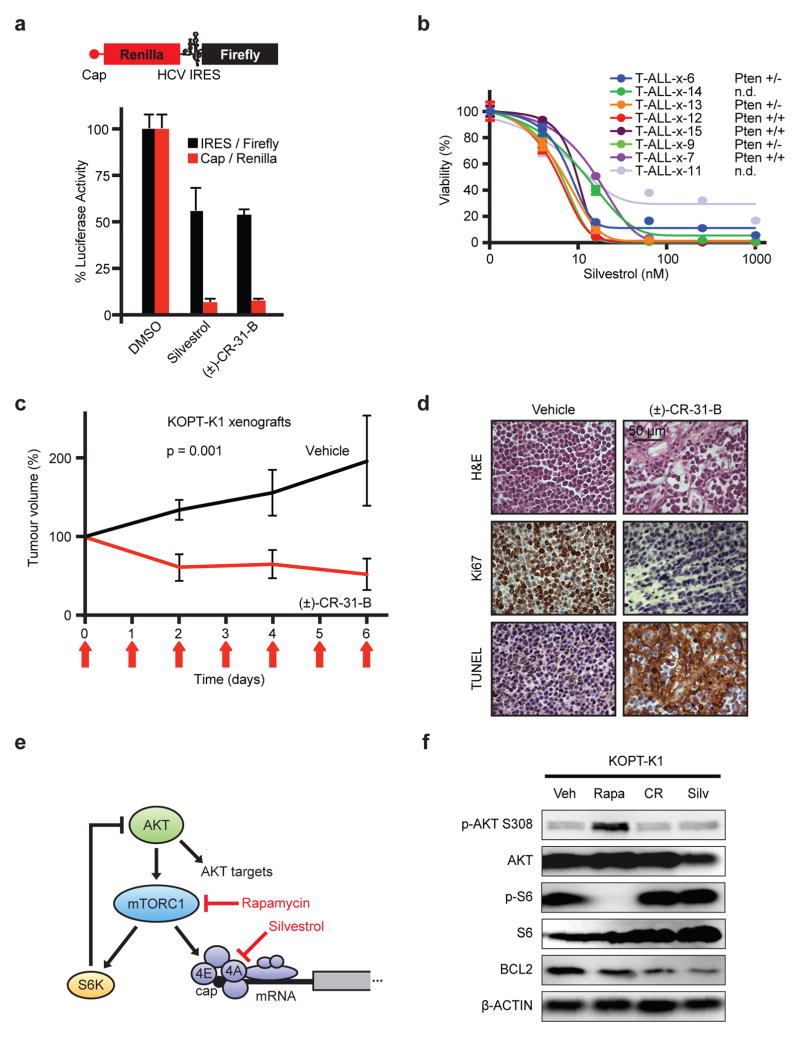
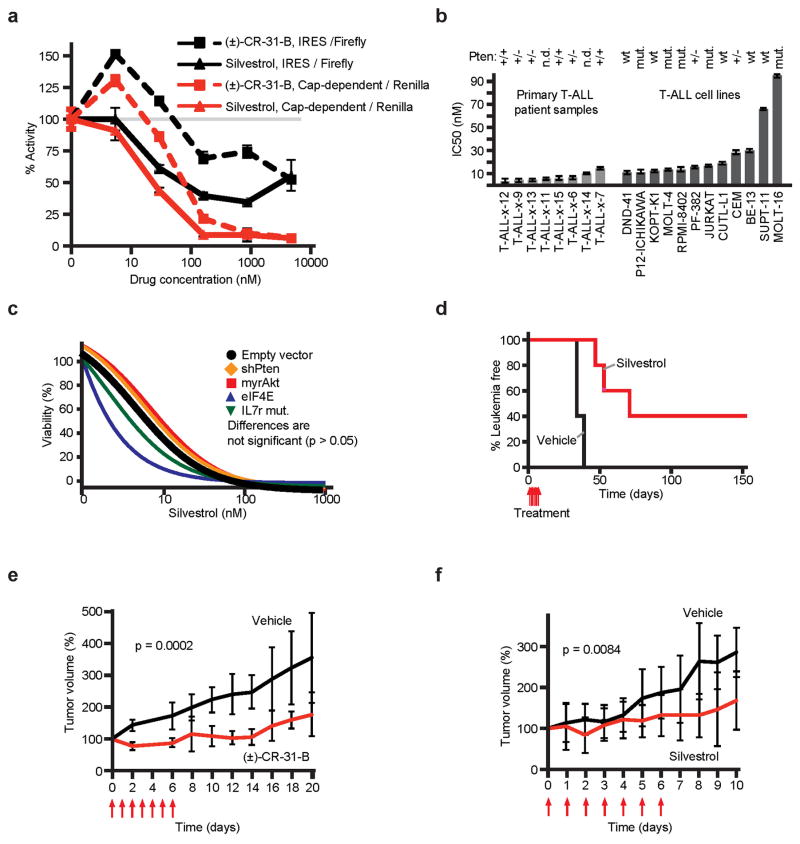
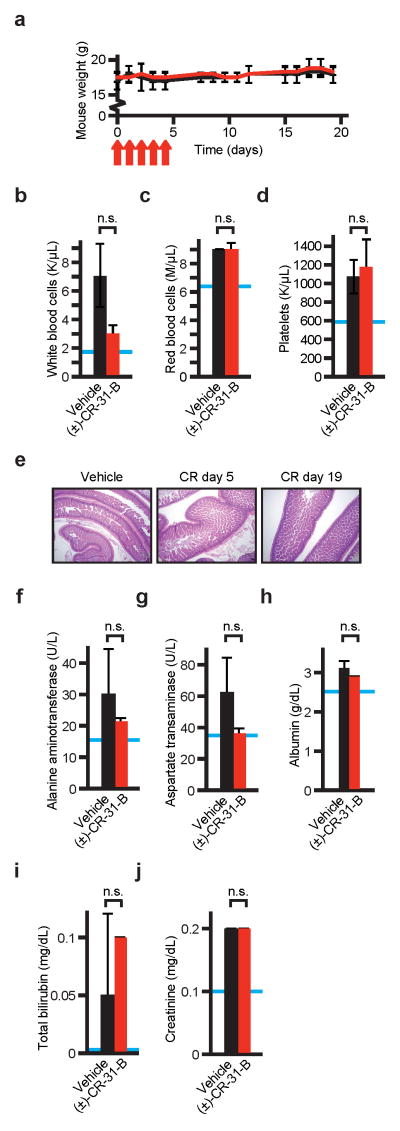
Silvestrol and a synthetic analogue (±)-CR-31-B (CR) inhibit eIF4A1/211,22. A reporter assay confirms that both drugs preferentially block cap-dependent translation of renilla luciferase compared to firefly luciferase expressed from the HCV IRES (Figure 2a, Extended Data Fig. 2a). Silvestrol induces cell death in primary human T-ALL samples, cell lines, and murine T-ALLs at nanomolar IC50s (Figure 2b, Extended Data Fig. 2b/c). In vivo Silvestrol is effective against murine or xenografted T-ALLs (Figure 2c, Extended Data Fig. 2d–f). In KOPT-K1 tumour-bearing (~1 cm3) NOD/SCID mice, treatment with Silvestrol (0.5 mg/kg, i.p., d 0–6, n = 7, p < 0.001) or (±)-CR-31-B (0.2 mg/kg, i.p., d 0–6, n = 8, p < 0.001) delays tumour growth, and causes apoptosis and cell cycle arrest (Figure 2c/d, Extended Data Fig. 2e/f). Detailed toxicology shows that this treatment is well-tolerated in mice (Extended Data Fig. 3a–j, Suppl. Table 2). Rapamycin induces an S6 kinase-dependent feedback activation of AKT (T308)23, by contrast Silvestrol or (±)-CR-31-B do not trigger this response in KOPT-K1 cells (Figure 2e/f). The result implies that inhibition of eIF4A is effective without effect on S6 kinase.
Figure 2. Silvestrol has single-agent activity against T-ALL.
a) Reporter system with capped renilla luciferase (red) and firefly luciferase under the HCV IRES (black); (below) Relative levels of renilla luciferase (red) and firefly (black) luciferase upon vehicle (DMSO), Silvestrol, or (±)-CR-31-B. Mean/SD, n = 3 biological replicates; b) Viability of primary patient T-ALL samples treated with Silvestrol (48 h; mean/SD of 4 replicates; c) Tumour size of KOPT-K1 xenografts treated with (±)-CR-31-B (0.2 mg/kg) or vehicle, mean/SD of 5 tumors; d) Immunohistochemical analysis of (±)-CR-31-B treated KOPT-K1 tumours; e) Diagram of drug targets; f) Lysates of KOPT-K1 cells treated with vehicle (Veh), Rapamycin (Rapa: 25 nM), (±)-CR-31-B (CR: 25 nM), or Silvestrol (Silv: 25 nM) for 48 hours and probed as indicated.
Ribosome footprinting
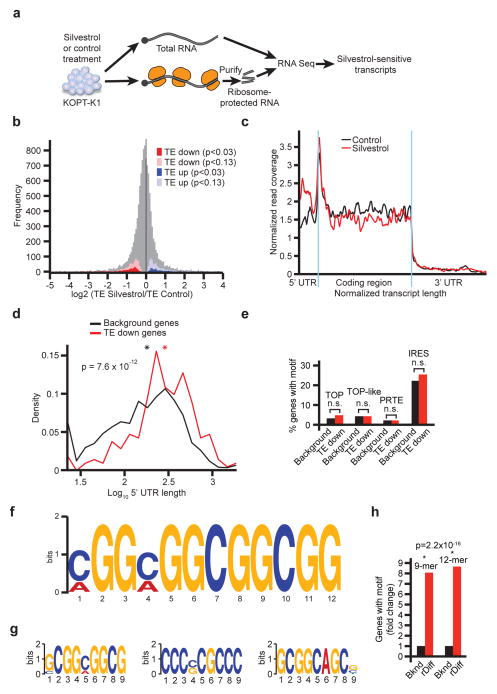
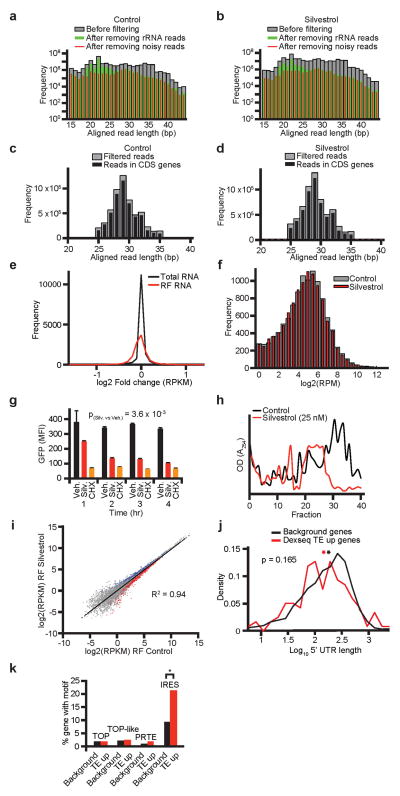
For footprinting studies, we treated KOPT-K1 cells with 25 nM of Silvestrol or vehicle for 45 minutes, then deep-sequenced total RNA and ribosome protected RNA (ribosome footprints = RFs) (Figure 3a)14. We removed reads mapping to ribosomal RNAs, non-coding RNAs, library linkers, and incomplete alignments (Extended Data Fig. 4a/b). The majority of the remaining reads between 25–35 nucleotides in length mapped to protein coding genes (Extended Data Fig. 4c/d). The total number of RF reads that mapped to exons was 3.2 million in control and 3.4 million Silvestrol samples and this corresponded to ~11,128 protein coding genes. RF reads showed a wider variation between control and Silvestrol than total RNA sequences indicating minimal transcriptional variation (Extended Data Fig. 4e). The number of ribosomes occupying any transcript is given as gene specific RF reads per one million total reads (RPM). The RPM frequency distribution in control and Silvestrol samples was overlapping, indicating that Silvestrol equally affected mRNAs with high and low ribosome occupancy (Extended Data Fig. 4f). Polysome analysis and metabolic labelling with L-azidohomoalanine (AHA) labelling confirmed an inhibitory effect on translation (AHA: Silvestrol ~ 60%; p(Silv. vs. Veh.) = 3.6 × 10⁻³; Cycloheximide 80%, p(CHX vs. Veh.) = 2 × 10⁻⁴) (Extended Data Fig. 4g/h). The translational efficiency (TE) for each mRNA is calculated by normalizing the RF frequency to transcript length and total transcript abundance (RPKM: reads per kilobase per million reads). RPKM values for RF from vehicle and Silvestrol samples were correlated (R2 = 0.94) indicating an overall inhibitory effect (Extended Data Fig. 4i).
Figure 3. Ribosome footprinting defines Silvestrol’s effects on translation.
a) Schematic of the ribosome footprinting study; b) Frequency distribution of the ratio of translational efficiency (TE) in control and Silvestrol treated samples (TESilvestrol/TEcontrol). More or less affected mRNAs identified as TE down (red) and TE up (blue); n = 2 replicates; c) Ribosome distribution for 62 TE down and rDiff positive transcripts upon Silvestrol (red) or vehicle (black). RF coverage and transcript length are normalized, blue indicates translation start and stop sites; d) Comparison of 5′UTR lengths for TE down versus background genes. Mathematical density is scaled such that all values on the x-axis sum to 1; red: TE down, black: background genes, *: mean value, n = 2 replicates; e) Prevalence of the indicated 5′UTR motifs among the TE down and background genes (n.s.: not significant p > 0.05); f) 12-mer motif enriched in TE down genes (p = 2 × 10⁻¹⁶); g) Three most common 9-mer motifs in TE down genes; h) Enrichment of 12-mer and 9-mer motifs in the rDiff gene set.
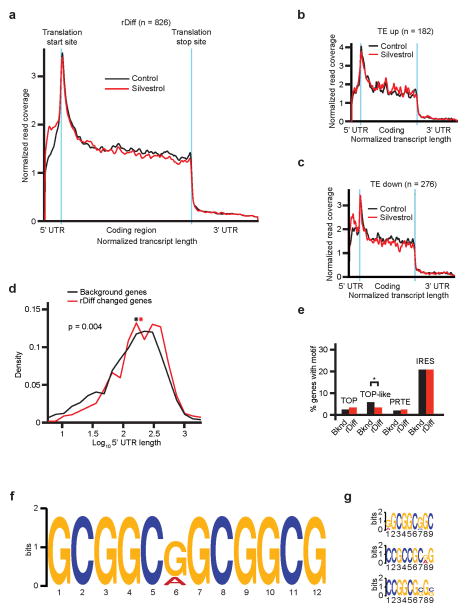
We developed the DERseq algorithm (Differential Expression-normalized Ribosome-occupancy; based on DEXseq24) to identify mRNAs that were most strongly affected by Silvestrol. We used a cut-off at p < 0.03 (Z-score > 2.5) to define groups of mRNAs whose translational efficiency was the most (TE down; red) or least (TE up; blue) affected by Silvestrol compared to background (grey) (Figure 3b, Suppl. Table 3a–c). The TE down group includes 281 mRNAs (220 with annotated 5′UTRs), TE up includes 190 mRNAs, and the background list 2243 mRNAs. The footprinting methodology also provides positional information and the rDiff algorithm identifies mRNAs with significant shifts in RF distribution25. For example, Silvestrol caused an accumulation of RFs in the 5′UTR of 847 protein-coding transcripts (rDiff positive genes; 641 with annotated 5′UTRs; p < 0.001) (Suppl. Table 3d). Sixty-two transcripts showed both decreased TE and altered RF distribution, while we observed no change in distribution among TE up genes (Figure 3c, Extended Data Fig. 5a–c, Suppl. Table 3e).
The (CGG)4 motif marks eIF4A-dependent mRNAs
We compared the TE up, TE down, and background groups (Suppl. Table 3a–c), and confirm that mRNAs with longer 5′UTRs were significantly enriched in the TE down group (mean UTR length: 368 nt in TE down; 250 nt in background, p(Silvestrol vs. Control) = 7.6 × 10⁻¹² by two-sample Kolmogorov-Smirnov) (Figure 3d). The TE up group showed no difference in 5′UTR length (265 nt; p(Silvestrol vs. Control) = 0.165) (Extended Data Fig. 4j). We found no predilection for known regulatory elements in the TE down group, these included TOP26, TOP-like sequences15, IRES27, and pyrimidine rich translational elements (PRTEs)26 (Figure 3e). The TE up group showed the expected enrichment in IRES elements (Extended Data Fig. 4k). Using the DREME algorithm28 we found a striking enrichment of a 12-mer (CGG)4 motif and related but shorter 9-mer motifs among the 220 TE down genes (Figure 3f/g, Suppl. Table 4a/b). Both 12-mer and 9-mer motifs were significantly enriched over background and their frequency was significantly higher than expected merely by the longer UTR length (p < 2.2 × 10⁻¹⁶; one-sided binomial test) (Figure 3h). We found no enriched motif in the TE up group. Transcripts with an altered RF distribution (rDiff positive) showed similar features. These included longer 5′UTRs (rDiff: 271 nucleotides versus background: 230 nucleotides; p = 0.004) (Extended Data Fig. 5d) and absence of enrichment for TOP, TOP-like, PTRE, or IRES elements (Extended Data Fig. 5e). Strikingly, we again identified the 12-mer motif seen in the TE analysis but shifted by one nucleotide (Extended Data Fig. 5f, Suppl. Table 4c), along with 9-mer variants, highly significantly enriched in the rDiff positive set compared to background (p = 2.2 × 10⁻¹⁶) (Extended Data Fig. 5g; Suppl. Table 4d).
The (CGG)4 motif corresponds to G-quadruplexes
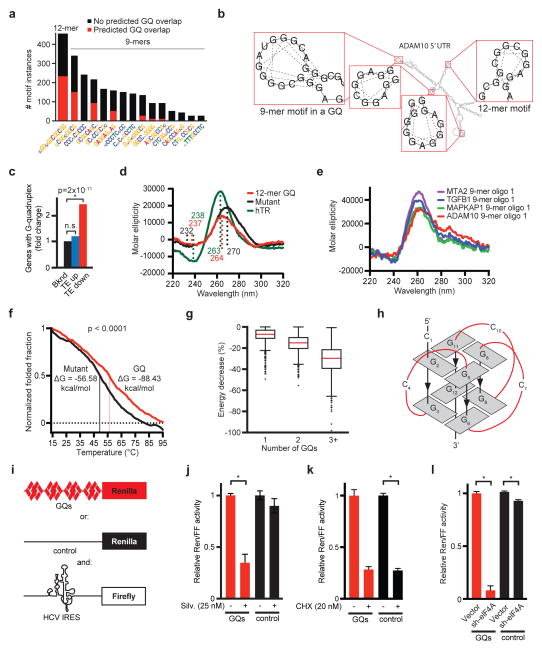
We noticed that in many instances the 5′UTR motifs coincided with computationally predicted G-quadruplex (GQ) structures29. For example 51% of the 12-mer (CGG)4 sequences and 43% of the most common 9-mer localized precisely to the GQ structures – the ADAM10 5′UTR provides an example (Figure 4a/b, Extended Data Fig. 6a, Suppl. Table 4e–k). GQ structures form by non-Watson-Crick interactions between paired guanine nucleotides that align parallel or anti-parallel arrangements in different planes connected by at least one linker nucleotide (A or C). Accordingly, GQ structures were significantly enriched among TE down genes and 79/220 TE down transcripts harboured at least one GQ (p = 2 × 10⁻¹¹) (Figure 4a–c, Suppl. Table 4e–k).
Figure 4. GQ structures confer eIF4A-dependent translation.
a) Bar graph indicating the motif prevalence and likelihood to form GQs (red); b) The ADAM10 5′UTR illustrates 12-mer and 9-mer motifs and GQs; c) Enrichment of predicted 5′UTR GQ structures in the TE down gene set; d) CD spectra scan of 12-mer motif (CGG)4, mutant oligomer (equal length and GC content), and human telomeric RNA (hTR) with known GQ structure folded in KCl, n = 5 replicates; e) CD spectra scan of 9-mer motifs with 2nt flank from the 5′UTR of indicated genes folded with KCl, n = 5 replicates; f) Melting curve for CD spectra scan at λ264nm for the 12-mer (CGG)4 and mutant oligomer, Tm = melting temperature, ΔG = free energy of unfolding; g) Calculated decrease in free energy for cellular UTRs with 1, 2, or 3+ motifs when allowed to fold into GQ structures; h) Diagram of parallel GQ conformation; i) Schematic of reporter constructs with four 12-mer motifs (GQs, red), random sequence matched for length and GC content (control, black), HCV IRES (white); j–k) Relative Renilla luciferase (normalized to IRES-Firefly) expressed from the GQ (red) or control construct (black), treated with Silvestrol (j) or Cycloheximide (k) for 24 hours (* indicates p < 0.05, n = 3 biological replicates and n = 2 technical replicates); l) Assay as above comparing empty vector and sh-eIF4A (* indicates p < 0.05, n = 3 biological replicates and n = 2 technical replicates).
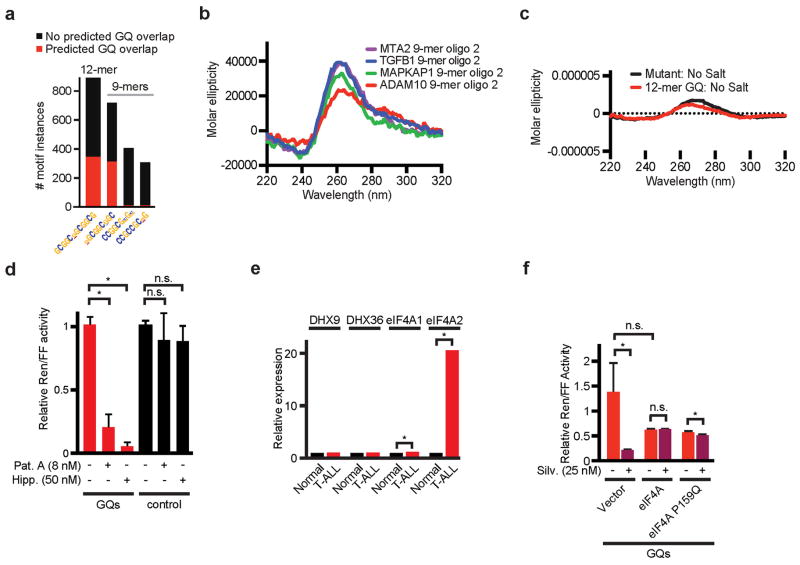
We confirmed by circular dichroism (CD) that the 12-mer and extended 9-mer sequence motifs form GQs. Briefly, we compared the molar ellipticity of RNA oligomers encoding the 12-mer and the 9-mer motifs to a known GQ element in the human telomeric RNA30 and a randomly organized oligomer with equal GC content and length. The 9-mers included either two (oligo 1) or five (oligo 2) flanking nucleotides as seen in the 5′UTRs of MTA2, TGFB1, MAPKAP1, and ADAM10 (Suppl. Table 5). The human telomeric sequence, the 12-mer and the 9-mer motifs showed typical positive and negative molar ellipticity peaks at 264 nm and 240 nm indicating parallel GQ structures. By contrast, the random oligomer had a shift in peak wavelengths (270 and 233 nm) (Figure 4d/e, Extended Data Fig. 6b). This effect was dependent on the presence of potassium and was abrogated in sodium phosphate buffer without potassium (Extended Data Fig. 6c). CD combined with thermal unfolding revealed that under potassium conditions the melting temperature for the 12-mer motif was higher (56°C) than the random oligomer (49°C), corresponding to a free energy difference of −32 kcal/mol (Figure 4f). Similarly, computational modelling of complete 5′UTRs with increasing numbers of motifs showed a decrease of the predicted minimum free energy (MFE) when the 5′UTR is allowed to fold into GQs (Figure 4g). Hence, the 12-mer and some of the 9-mer motifs can form energetically favourable GQ structures (Figure 4h).
Next, we tested the 12-mer (CGG)4 in a translation assay. We constructed a reporter system to compare four 12-mer motifs in tandem (GQ construct) to a random sequence of equal length and GC content (control construct), using IRES firefly luciferase as internal control (Figure 4i). Treatment with Silvestrol (25 nM) reduced the translation of the GQ construct and did not affect the control construct, Hippuristanol and Pateamine A had identical effects (Extended Data Fig. 6d), whereas cycloheximide (CHX, 20nM) suppressed both reporters (Figure 4j/k). Other RNA helicases (DHX9, DHX36) may resolve GQ structures30,31. However, we find predominant expression of eIF4A2 in T-ALL32, and knockdown confirms an eIF4A-dependent effect on the GQ reporter (Figure 4l, Extended Data Fig. 6e). Conversely, increased expression of eIF4A or a Silvestrol-binding site mutant of eIF4A (P159Q)33 renders the GQ reporter insensitive to Silvestrol (Extended Data Fig. 6f). Hence, eIF4A is limiting for the translation of mRNAs harbouring GQs in their 5′UTRs.
What transcripts are affected by Silvestrol?
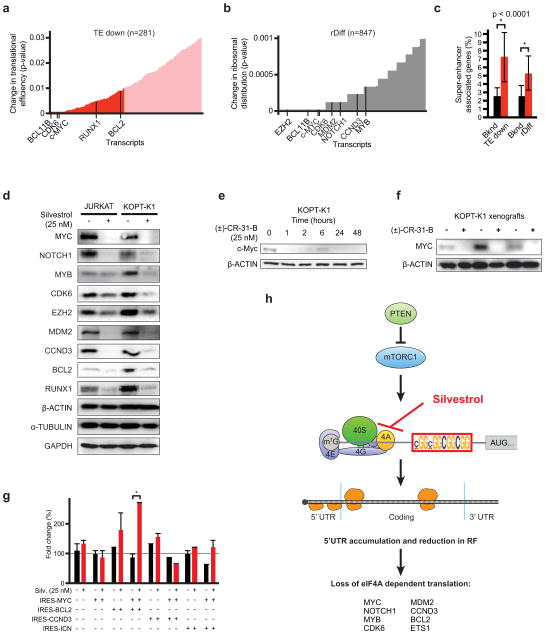
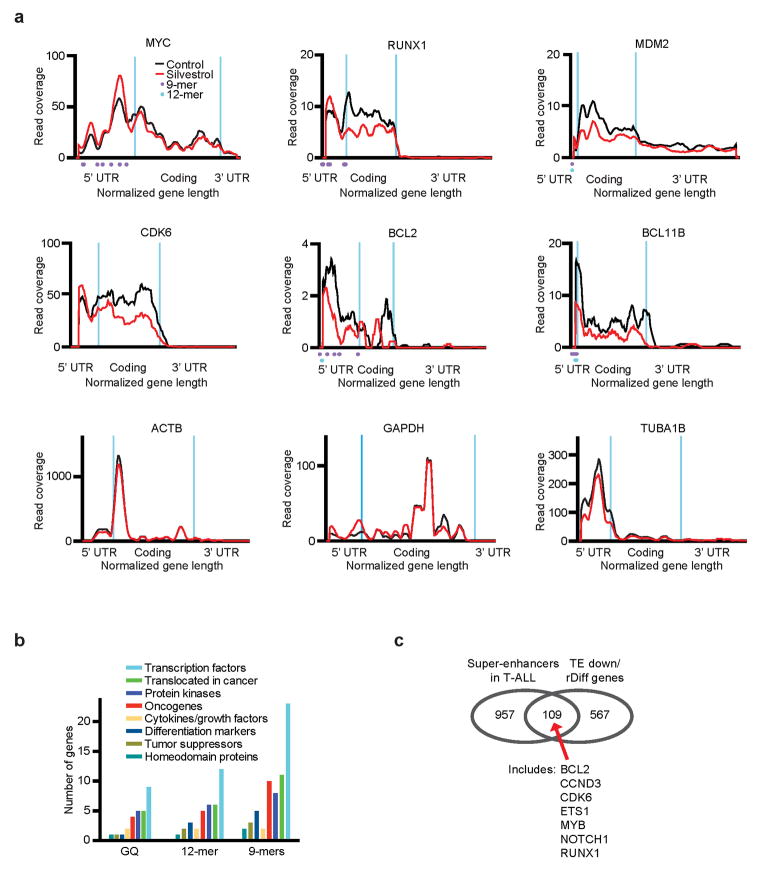
The Silvestrol sensitive transcripts (TE down and rDiff gene lists) include many genes with known roles in T-ALL (Figure 5a/b). The individual RF distribution graphs (normalized for mean RF count and gene length) illustrate recurrent patterns and also variations (Extended Data Fig. 7a). For example, the MYC, MDM2, and RUNX1 transcripts harbour multiple motifs in their 5′UTRs that correspond to peaks in RF density, while housekeeping genes show no changes in RF profiles. Gene ontology reveals a preponderance of transcription factors and oncogenes, but also some tumour suppressors (Extended Data Fig. 7b). Further, we note a significant enrichment of “super-enhancer”-associated genes34 - mostly transcription factors like NOTCH1, MYC, MYB, ETS1 and others (Figure 5c, Extended Data Fig. 7c, Suppl. Table 6).
Figure 5. Many oncogenes and transcription factors require eIF4A for translation.
a) TE down genes ranked by translational efficiency (red, up to p = 0.01, see Fig. 3b); b) rDiff genes ranked by significance (up to p = 0.001, see Fig. 3c); c) Genes associated with “super-enhancers” in T-ALL cells are enriched among TE down and rDiff gene sets; d) Immunoblots of lysates from human T-ALL lines treated with Silvestrol (25 nM, 24h) and probed as indicated; e) Time course analysis of protein expression in KOPT-K1 cells treated with CR (25 nM) for the indicated number of hours; f) Immunoblot on CR or vehicle treated KOPT-K1 xenografts, probed as indicated; g) Competition experiment (as in Figure 1c/d) showing the percentage of each starting GFP positive population of murine T-ALL cells partially transduced with the indicated constructs and treated with Silvestrol (*indicates p <0.05); h) Diagram: An eIF4A-dependent mechanism of translational control.
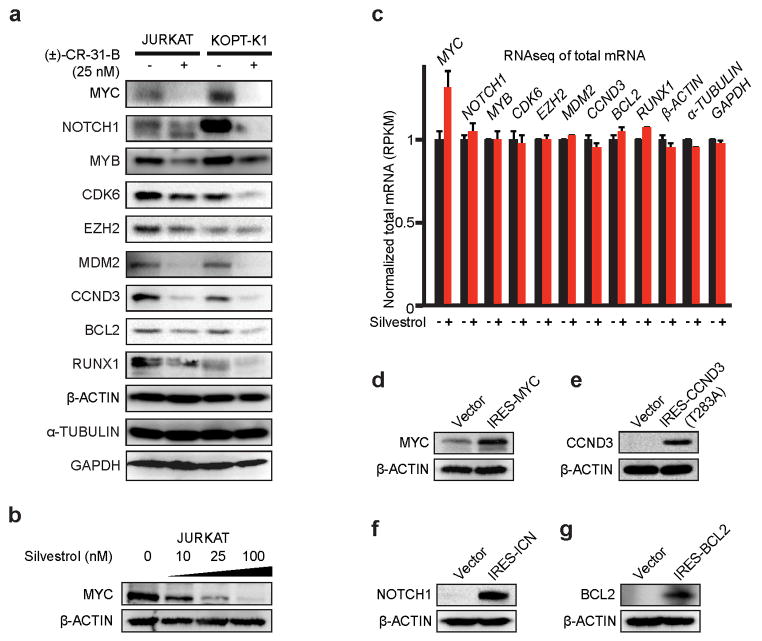
We confirmed the Silvestrol effects (25 nM for 24h) on key target proteins (Figure 5d, Extended Data Fig. 7a). The effect on the MYC protein was especially striking, it lasted for up 48h, and was readily detected in xenografts in vivo (Figure 5d–f, Extended Data Fig. 8a/b). The corresponding mRNAs were unchanged, and the increase in MYC mRNA may reflect a known auto-regulatory mechanism35 (Extended Data Fig. 8c). To test which proteins account for Silvestrol’s effects, we expressed several candidate genes and GFP in an eIF4A-independent manner from the HCV IRES. In mixed populations of transduced and parental murine leukemic cells (see Fig. 1c), we found that individually genes were not protective, while co-expression of IRES-MYC and IRES-BCL2 afforded significant protection (Figure 5g, Extended Data Fig. 8d–g). This result indicates that Silvestrol kills cancer cells by disrupting the translation of several critical factors.
Discussion
A selective mechanism of translational control
We report an eIF4A-dependent mechanism of translational control that is encoded in the 5′UTR of susceptible transcripts (Figure 5h). The eIF4A RNA helicase has been implicated in the translation of mRNAs with long and complex 5′UTRs9. Ribosome footprinting technology allowed us to identify Silvestrol-sensitive mRNAs and analyse their hallmark features. Besides 5′UTR length, these included a 12-mer (CGG)4 motif, additional 9-mer motifs, and computationally predicted GQ structures that correspond to the motif. RNA GQs are energetically favourable/stable RNA structures made from at least two stacks of four guanosines with non-Watson-Crick interactions (Hoogsteen hydrogen bonds) with intervening linker nucleotides29. The minimum number is twelve nucleotides, e.g. in the 12-mer motif (CGG)4, and shorter 9-mer motifs include neighbouring nucleotides to complete the structure. Frequently more than 12 nucleotides contribute to GQs, and typically Silvestrol-sensitive transcripts harbour several GQs in their 5′UTRs. These features define a specific subset of genes whose translation requires eIF4A and that is clearly distinct form mTORC1-dependent translation15,16.
Many transcription factors and oncogenes require eIF4A for translation. GQ structures have been observed e.g. in the NRAS and VEGF mRNAs36–38, and computational predictions have suggested a broader role in translational regulation39. Our results identify a broad set of eIF4A sensitive transcripts including many oncogenes and transcriptional regulators (e.g. MYC, MYB, NOTCH, CDK6, BCL2, and others). We can speculate that this mechanism provides additional control over these genes. In this regard, we note a recent study identified a role for eIF4A2 in microRNA function and reports that eIF4A sensitive transcripts are more likely controlled by microRNAs13. We further find a significant overlap with genes whose transcription is controlled by “super-enhancers”34.
Our study provides new insight into the striking anticancer effect of Silvestrol and related compounds. Several strategies are available to target oncoprotein translation (e.g. mTORC inhibitors15, an eIF4G inhibitory peptide 4EGI-140, or ribavirin41). We find that eIF4A is an oncogenic activity that is required for the expression of key oncogenes. Accordingly, Silvestrol can obliterate oncoproteins including MYC, NOTCH, BCL2, and others. This finding suggests potential activity in other cancers as single agent or in combination with other drugs.
Extended Experimental Procedures
(Non-radioactive) Metabolic labelling of nascent protein
KOPTK1 cells were labelled for nascent protein synthesis using Click-iTR AHA (L-azidohomoalanine) metabolic labelling reagent obtained from Invitrogen (cat no. C10102) as per manufacturer’s instructions. Briefly, following Silvestrol, Cycloheximide or DMSO treatment, cells were incubated in methionine-free medium for 30 min prior to AHA labelling for 1 hour. Cells were fixed with 4% paraformaldehyde in PBS for 15 min, permeabilized with 0.25% Triton X-100 in PBS for 15 min followed by one wash with 3% BSA. Cells were then stained using Alexa Fluor 488 Alkyne (Invitrogen cat no. A10267) with Click-iT Cell reaction Buffer Kit (Invitrogen cat no. C10269). Changes in mean fluorescence intensity as a measure of newly synthesized protein were detected by Flow cytometric analysis.
Polysome profiling
KOPTK1 cells were treated with Silvestrol or DMSO for 45 minutes, followed by cycloheximide treatment for 10 minutes. Cell pellet was lysed in polysome lysis buffer (300mM NaCl, 15mM Tris-HCl (pH 7.5), 15mM MgCl2, 1% TritonX-100, 0.1mg/ml Cycloheximide, 1mg/ml Heparin). Polysome fractions were isolated using 4 ml 10–50% sucrose density gradients (300mM NaCl, 100mM MgCl2, 15mM Tris-HCl (pH 7.5), 1mg/ml Cycloheximide, 10mg/ml Heparin). Gradients were centrifuged in an SW40Ti rotor at 35,000 rpm for 2 hours. Fractions of 100 μl were collected manually from the top, and optical density (OD) at 254 nm was measured.
Sequence Alignment
The human genome sequence hg19 was downloaded from UCSC public database: http://hgdownload.cse.ucsc.edu/goldenPath/hg19/chromosomes. Ribosome footprint (RF) reads were aligned to reference genome hg19 using PALMapper42. PALMapper clips the linker sequence (5′-CTGTAGGCACCATCAAT-3′), which is technically introduced during RF library construction, and trims the remaining sequence from the 3′ end while aligning the reads to reference sequence. Briefly, we set the parameters for PALMapper as follows: maximum number of mismatches: 2; maximum number of gaps: 0; minimum aligning length: 15; maximum intron length (splice alignment): 10000; minimum length of a splicing read aligned to either side of the intron boundary: 10. We only use the uniquely aligned reads for further analysis.
To remove ribosome RNA contamination, the footprint reads were also aligned to a ribosome sequence database using PALMapper with the same parameters except allowing splice alignment. We retrieved the human ribosome sequences from BioMart Ensembl43 and SILVA44 databases and merged the results into a single FASTA file, which was used as reference sequence to align against. The rRNA-aligned reads were filtered out from hg19-aligned reads.
After removing the rRNA contamination, we still observed a portion of reads that were dominated by linker sequence and Illumina P7 adapter. These reads can also be trimmed during mapping and cause false alignment. Therefore, we searched a string of 1~8 nt from linker sequence around the trimming site (±2 bp) allowing 1 nt mismatch. We removed the read if there was no such linker sequence. Finally, we filtered out reads ≤ 24-bp and ≥ 36-bp, and the remaining reads with aligned length from 25- to 35-bp were used to analyse the translational effects of Silvestrol.
Total mRNA sequencing reads were aligned to the hg19 reference using STAR45. We performed the splice alignment and only use the uniquely aligned reads with maximum 3 mismatches. rRNA contaminating reads were also filtered out using the same strategy described before. Out of six measurements we removed two outliers and the remaining two biological replicates showed excellent consistency (Control: R2 = 0.90; Silvestrol: R2 = 0.88; data not shown).
Footprint Profile Analysis
For each gene, we only counted the number of aligned reads that were mapped within exonic regions. The genome annotation was downloaded from GENCODE project (http://www.gencodegenes.org/releases/14.html). Ribosome footprint intensity (reads per million, RPM) was calculated as RPM = Ci/(N/106), where Ci is the read count for gene i, and N is the library size of Silvestrol- or vehicle-treated samples. In order to eliminate the effluence of rRNA contamination, the library size was calculated after read filtering described previously. Similarly, the expression value measured from total mRNA-seq data and translation value measured from ribosome footprint data (both were referred as reads per kilobase per million, RPKM) were calculated as RPKM = Ci/(Ki · N/106), where Ki is the non-overlapped exonic region of each gene. To evaluate the translation efficiency (TE) change between Silvestrol- and vehicle-treated samples, we then calculated TE = RPKMfootprint/RPKMmRNA as Thoreen et al did recently15.
To detect the genes that ribosome footprint profiles were significantly changed between Silvestrol treated sample and control, we used DEXSeq24 to perform the statistical test. DEXSeq accounts for the discrete nature of the read counts and it also models the biological variability, which has been demonstrated in other applications to be crucial to avoid a great number of false positives. Here, DEXSeq was used in a specific way: we fit the footprint and mRNA-seq read counts into DEXseq framework, in which Silvestrol treatment and control are two biological conditions, and we tested whether footprint (consisting 2 replicates for each condition) and mRNA-seq (We split the 3 replicates and recombined them into two combinations such that each of them consists of two replicates.) read counts were significantly different in the two conditions. The log-ratio of normalized read counts of Silvestrol treated sample to control indicated whether ribosome footprint profile was increased or decreased. In the end, we plotted the ratio of TEsilvestrol/TEcontrol of all the genes and colour-highlighted them according to the statistical significance of the DEXSeq test.
In addition to studying the translation efficiency, we also evaluated the ribosomal distribution change between Silvestrol treated sample and control. First, a BED file contained all non-overlapped exonic regions was generated based on genome annotation. Then the BED file and footprint BAM files were given as an input to SAMTOOLS46 to generate new BAM files only included exonic alignment. We input the exonic BAM files of two conditions to rDiff25 to identify genes that presented significant change in ribosomal distribution. In detail, we performed a nonparametric test implemented in rDiff to detect differential read densities. rDiff takes relevant read information, such as the mapping location and the read structure, to measure the significance of changes in the read density within a given gene between two conditions. The minimal read length was set to 25-bp, and number of permutation was set to 10000.
To plot the ribosomal distribution curves for multiple genes, we normalized read coverage of each transcript by the mean coverage value of that particular transcript. Then the UTR and coding exon length were normalized in proportion to the overall average length of corresponding regions of a group of genes. Finally all the normalized transcripts were averaged together in a vectored way to plot the coverage distribution. The ribosomal distribution curves for a single gene were plotted in a similar way but without normalizing the read coverage, and the coverage was smoothed using ‘moving average’ smoothing algorithm.
Motif analysis
The transcripts of each gene were quantified based on the total mRNA-seq data using MISO47. The 5′UTR of most abundant transcript was collected for predicting motifs. Both the significant genes with increased or decreased TE and altered ribosomal distribution and the corresponding background gene sets were predicted by DREME28. Over- and under-represented motifs were determined with three different settings: searching for motifs of length greater than or equal to six, nine and twelve base pairs. We considered the predicted consensus sequences with P < 1×10⁻⁴ as significant motifs. Motif occurrences were called using FIMO48 with default parameters for strand specific prediction. P-values for the enrichment of Motifs in GQs were calculated using a one-sided binomial test and account for UTR length. The secondary structure of different gene sets was predicted using RNAfold49 based on the same 5′UTR prepared before.
5′UTR sequences for respective group of targets were subjected to motif prediction using online available program RegRNA (A Regulatory RNA motifs and Elements Finder) (http://regrna.mbc.nctu.edu.tw/html/prediction.html) and looked specifically for motifs that occur in 5′UTR. Statistical significance for the results obtained was calculated using Fisher’s exact test for count data.
Luciferase assays
Four tandem repeats of the (CGG)4 12-mer motif (GQs) or random sequence matched for length and GC content (random) were cloned into the 5′UTR of Renilla luciferase plasmid pGL4.73. Empty firefly luciferase plasmid pGL4.13 or HCV-IRES firefly were used as internal controls. Luciferase assays were performed using Dual-Luciferase Reporter Assay System (Promega E1960) following the manufacturer’s instructions.
GQs sequence:
CTAGGTTGAAAGTACTTTGACGGCGGCGGCGGTCAATCTTACGGCGGCGGCGGACATAGATACGGCGGCGGCGGTAGAAACTACGGCGGCGGCGGATTAGAATAGTAAA
Random sequence matched for GC-content:
CTAGGGCGCACGTACTTCGACAACGTCAGCGTTCAGCGTTCCAACGTCAGCGTACAGCGATCCAACGTCAGCGTTCTGCGCTACAACGTCAGCGTATCCGCGTAGCACA
Circular dichroism and thermal denaturation analysis
RNA oligos (see Supplemental Table 5) were used at 10 μM concentration. The buffer used for GQ studies contained: 40mM KCl, 10mM potassium phosphate, pH 7.050. The buffer used for salt-free conditions contained: 10mM sodium phosphate buffer pH 7.0. The CD experiments were performed using Aviv 202 CD Spec (DWB 208) spectropolarimeter equipped with peltier temperature control. For wavelength scan, a range of 320-220 nm was used with equilibration time of 0.83 sec. Thermal unfolding/folding experiments were performed across a temperature range of 15°C to 95°C, with a 1°C/minute temperature gradient. At least five scans each sample were collected and were corrected with respective buffer controls. Calculations for Tm and deltaG were performed as described in 51. Smoothing of the CD curves was performed with Prism software by cumulating five neighboring data points.
T-ALL samples
Thirty-six bone marrow biopsies were historically collected from patients with T-ALL at multiple organizations (Universitair Ziekenhuis (UZ) Ghent, Ghent, Belgium; UZ Leuven, Leuven, Belgium; Hôpital Purpan, Toulouse, France; Centre Hospitalier Universitaire (CHU) de Nancy-Brabois, Vandoeuvre-Les-Nancy, France). The QIAamp DNA Mini kit was used to obtain genomic DNA (Qiagen 51304). The Medical Ethical Commission of Ghent University Hospital (Ghent, Belgium, B67020084745) approved this study.
Mutation analysis
NOTCH1 (exons 26, 27, 28 and 34), FBXW7 (exons 7, 8, 9, 10 and 11), PTEN (exons 1 till 9) and IL7R (exon 6) were amplified and sequenced using primers as reported in 52–54. FBXW7, PTEN and IL7R amplification were performed using 20 ng of genomic DNA, 1x KapaTaq reaction buffer (KapaBiosystems), 1U KapaTaq DNA polymerase, 0.2 mM dNTP, 2.5 μM MgCl2, 0.2 mM forward and reverse primer in a 25 μl PCR reaction. For NOTCH1 amplification, we used the PCRx enhancer system (Invitrogen) for the PCR reaction. Reactions contained 20 ng of DNA, 2.5U KapaTaq DNA Polymerase, 1x PCRx Amplification Buffer, 2x PCRx Enhancer Solution, 0.2 mM dNTP, 1.5 mM MgSO4 and 0.2 mM of each primer. The PCR steps were: 95 °C for 10 minutes, (96 °C for 15 sec, 57 °C for 1 minute, then 72 °C for 1 min) for 40 cycles, then 72 °C for 10 minutes. Purified PCR products were analysed using the Applied Biosystems 3730XL DNA Analyse.
Array Complete Genomic Hybridization
PTEN deletions and MYC amplifications were detected by array CGH analysis using SurePrint G3 Human 4×180K CGH Microarrays (Agilent Technologies). First, random prime labelling of the T-ALL DNA sample and a control human reference DNA was performed with Cy3 and Cy5 dyes (Perkin Elmer), respectively. The subsequent hybridization protocol was performed according to the manufacturer’s instructions (Agilent Technologies). The data was analysed using arrayCGHbase55.
Generation of mice
The ICN-driven mouse T-ALL model has been reported1,20. Mice were C57BL/6J females between 6 and 10 weeks of age. Treatment conditions and HPC genotypes were randomized and non-blinded; n was determined empirically based on previous mouse experiments. Data were analysed in Kaplan-Meier format using the log-rank (Mantel-Cox) test for statistical significance. The surface marker analysis was as described in 1. ShRNAs against Pten52 and eIF4A156 have been reported. For xenograft studies, 5,000,000 KOPT-K1 cells in 30% matrigel (BD 354234) were injected subcutaneously into C.B-17 SCID mice. When tumours were readily visible, the mice were injected on 7 consecutive days with 0.5 mg/kg Silvestrol, 0.2mg/kg (±)-CR-31-B. Tumour size was measured daily by caliper. P-values were calculated using 2-way repeated measures ANOVA. All animal experiments were performed in accordance with regulations from Memorial Sloan-Kettering Cancer Center’s Institutional Animal Care and Use Committee.
Real-Time Quantitative PCR
Total RNA was extracted using AllPrep DNA/RNA/Protein Mini Kit (Qiagen 80004). Normal CD3+ T-cell RNA mixed from healthy donors was purchased from Miltenyi Biotec (130-093-164). cDNA was made using SuperScript III First-Strand (Invitrogen 18080-400). Analysis was performed by ΔΔCt. Applied Biosystems Taqman GeneExpression Assays: human Myc Hs00153408_m1, hsa-miR-19b RT and TM 396, Rnu6b RT and TM 001093, and mouse Myc Mm00487804_m1.
T-ALL cell lines
T-ALL cell lines were obtained from ATCC and all tested negative for mycoplasma contamination. Lines were cultured in RPMI-1640 (Invitrogen, CA), 20% fetal calf serum, 1% penicillin/streptomycin, and 1% L-glutamine. The MOHITO line was supplemented with 5 ng/mL IL2 (Fitzgerald 30R-AI022 and 10 ng/mL of IL7 (Fitzgerald 30R-AI084X). To generate IC50 curves, T-ALL cell lines and samples were treated with Silvestrol or CR for 48 hours. Viable cells were measured using ATP quantification via the CellTiter-Glo Luminescent Cell Viability Assay (Promega G7571).
Immunoblots
Lysates were made using Laemli lysis buffer. 30ug of protein was loaded onto SDS-PAGE gels then transferred onto Immobilon-FL Transfer Membranes (Millipore IPFL00010). The antibodies used were α-Tubulin (Sigma T5168), β-actin (Sigma A5316), Myc (Santa Cruz Biotechnology sc-40), p-Akt 308 (Cell Signaling 9275), Akt (Cell Signaling 9272), S6 (Cell Signaling 2317), and p-S6 (Cell Signaling 2215), Notch1 (Cell signaling 3608), Myb (Santa Cruz Biotechnology, sc-517), CDK6 (Cell Signaling 3136), EZH2 (Cell Signaling 5246), Mdm2 (Santa Cruz Biotechnology, sc-965), Bcl2 (Santa Cruz Biotechnology, sc-509), Runx1 (Cell Signaling 4336), and GAPDH (Cell Signaling 5174).
Statistical analysis
All Kaplan-Meier curves were analysed using the Mantel-Cox test. The significance of xenografted tumour size differences was determined using two-way repeated measures ANOVA tests. RT-PCRs were analysed with two-tailed t-tests. The significance of motif enrichments was determined using a one-tailed binomial test with correction for differences in 5′UTR lengths. The p-value for this test is defines as:
where TPos resp. TNeg is the number of genes in the positive resp. negative (background) set, NPos resp. NNeg is the average length of the 5′UTR of the positive resp. negative set of genes and HPos resp. HNeg is the number of genes with the motif under consideration and B(n,p)(i) is the probability for observing i events drawn from the distribution B(n,p)
Compounds
Silvestrol was a gift from Jerry Pelletier’s laboratory and was subsequently purchased from ChemScene (CS-0543). (±)-CR-31-B was a gift from John Porco’s laboratory. Each was suspended in DMSO for in vitro experiments and 5.2% Tween 80 5.2% PEG 400 for in vivo experiments. Cycloheximide (C7698) and Rapamycin (R8781) were purchased from Sigma.
Toxicity studies
Eight week-old C57Bl/6NTac female mice were randomly assigned to either control or treatment groups. Each treatment group received one daily dose of test article through i.p. injections over 5 consecutive days. Toxicity was monitored by weight loss and daily clinical observation for the 14 days following test article administration. 24 hours after the last test article administration 4 mice in each group were sacrificed and clinical chemistry, haematology and tissue specific histopathology were done at autopsy. The remaining mice (n = 2 per group) were kept under observation for an additional 13 days; at that point all mice were sacrificed and clinical chemistry, haematology and tissue specific histopathology were done at time of autopsy.
Extended Data
Extended Data Figure 1. Translational activation in T-ALL.
a–c) Diagram of mutations in human T-ALL affecting PTEN (a), IL7R (b), and NOTCH1 (c); d) Immunoblots of lysates from ICN-driven murine leukaemia with the additional indicated construct, probed as indicated; e) Immunoblots of lysates from 3T3 cells with empty vector or sh-eIF4A and probed as indicated; f) Representative FACS profiles measuring levels of the indicated markers in murine leukaemia; g) Surface marker expression on murine leukemic cells of indicated genotype (+ and − indicate < or ≥ 50% positive cells); h) Lysates of murine leukaemia expressing ICN and either empty vector or eIF4A1 and probed as indicated; i) Representative histology detailing the pathological appearance of murine T-ALLs harbouring the indicated genes and stained as indicated.
Extended Data Figure 2. Silvestrol and the synthetic analogue (±)-CR-31-B are effective against T-ALL.
a) Dual luciferase reporter assay, shown are relative levels of each firefly (cap-dependent) and renilla (IRES-dependent) luciferase upon treatment with Silvestrol or (±)-CR-31-B. Mean and standard deviation are shown, n = 3 biological replicates; b) IC50 values for Silvestrol and CR in a panel of human T-ALL primary patient samples and cell lines. Mean and standard deviation are shown, n = 4 biological replicates; c) Silvestrol’s effect on murine T-ALLs with the indicated genetic lesions; curves are mean of triplicates and differences between the genotypes did not reach significance; d) Kaplan-Meier analysis showing time to leukaemia development after systemic transplantation of MOHITO cells in Balb/c mice followed by treatment on 7 consecutive days (treatments are indicated by red arrows) with either Silvestrol (0.5 mg/kg, red line, n = 5) or vehicle (black line, n = 5); e) KOPT-K1 xenograft studies. Shown is the tumour volume during and after systemic treatment with CR or vehicle (intraperitoneal injection, 0.2 mg/kg on days indicated by red arrows). Mean and standard deviation are shown, n = 6 biological replicates; f) Tumour volume upon intraperitoneal treatment with vehicle or Silvestrol (0.5 mg/kg on days indicated by red arrows). Mean and standard deviation are shown, n = 3 biological replicates.
Extended Data Figure 3. a–j) Toxicity studies with (±)-CR-31-B.
Mean and standard deviation are shown, n = 2 biological replicates. a) Animal weights during and after CR treatment (intraperitoneal injection, 0.2 mg/kg on days indicated by red arrows), red = CR, black = vehicle; b–d) Counts of white blood cells (b), red cells (c), and platelets (d) 14 days after cessation of CR treatment, blue lines indicate the species and strain specific reference range, n.s. indicates not significant, n = 2 biological replicates; e) Representative histology of gastrointestinal tract (small intestine) on the indicated days during (n = 4) and after (n = 2) (±)-CR-31-B treatment; f–j) Serum levels of alanine aminotransferase (ALT) (f), aspartate transaminase (AST) (g), albumin (h), total bilirubin (i), and creatinine (j) two weeks after cessation of treatment with CR or vehicle, blue lines indicate the species and strain specific reference range, n.s. indicates not significant.
Extended Data Figure 4. Ribosome profiling quality control data and effects on translation.
a and b) Read counts by length of mapped sequence before and after filtering rRNA, linker reads, non-coding RNAs, short mapped sequences (“noisy” reads; see text and method for details), n = 2 biological replicates; c and d) Read length frequency histograms and mapping analysis of ribosome footprint data after quality control filtering for vehicle treated cells (c) or Silvestrol treated cells (d), n = 2 biological replicates; e) Silvestrol induced changes in total RNA (log2 Fold change RPKM) and ribosome protected RNA (RF), n = 2 biological replicates; f) Histogram of all genes’ ribosome footprint intensity (measured as unique read number per million per gene, RPM) for Silvestrol and vehicle treated cells indicating Silvestrol affected mRNAs were broadly distributed (see text for details), n = 2 biological replicates; g) Mean fluorescence intensity of incorporated L-azidohomoalanine (AHA) in newly synthesized proteins in KOPT-K1 cells treated with vehicle (DMSO), Silvestrol (Silv. 25 nM), or Cycloheximide (CHX 100 nM) for the indicated time period, n = 3 biological replicates; h) Polyribosome profiles of Silvestrol (25 nM) or vehicle (DMSO) treated KOPT-K1 cells showing OD254 absorption across the ribosome containing fractions, n = 3 biological replicates; i) Ribosome density for transcripts across control and Silvestrol samples (ribosomal footprint (RF) reads per kilobases per million reads (RPKM)), n = 2 biological replicates. The correlation (R2 = 0.94) indicates a broad effect on translation and transcripts with significantly differential changes in ribosome density are indicated as red and blue dots; j) Length comparison of 5′UTRs of TE up genes and a background gene set; *: mean, n = 2 biological replicates; k) Percentage of TE up genes and background genes containing the indicated sequence motifs; *: p < 0.001, n = 2 biological replicates.
Extended Data Figure 5. Analysis of genes with differential ribosomal distribution (rDiff positive set).
a) Representation of ribosome coverage for 826 transcripts with significant changes in distribution between Silvestrol (red) and vehicle (black); corresponding to the rDiff positive gene list after filtering out genes with 5′ UTR length < 20nt. Both RF coverage and transcript length are normalized for comparison; translation start and stop sites are indicated by blue lines, n = 826; b–c) Ribosomal distribution plots, as in a, showing how Silvestrol affects ribosome distribution in all TE up genes (b), n = 182 after filtering out genes with 5′ UTR length < 20nt and all TE down genes (c), n = 276 after filtering out genes with 5′ UTR length < 20nt; d) Length comparison of 5′UTRs of genes with significantly altered ribosomal distribution (rDiff positive: red) and background genes (black); *: mean value, n = 826; e) Percentage of rDiff positive genes and background genes containing the indicated sequence motifs, * indicates p < 0.05, n = 2 biological replicates; f–g) The rDiff positive genes are enriched for the indicated 12-mer (f) and 9-mer (g) consensus motifs.
Extended Data Figure 6. Circular dichroism (CD) and characterization of eIF4A.
a) Bar graph indicating the prevalence of each sequence motif from the rDiff data set and its predicted likelihood to form GQ structures (red); b) CD spectra scan of 9-mer motif with a 5 nt flank taken from the actual 5′UTR of the indicated genes folded with KCl; c) CD spectra scan of 12-mer motif and mutant folded in sodium phosphate buffer without KCl, note the y-axis scale; d) Relative amounts of Renilla luciferase (normalized to Firefly) expressed from the GQs (red bars) or control construct (black bars), treated with 8 nM Pateamine A (Pat. A) or 50 nM Hippuristanol (Hipp.) for 24 hours (* indicates p < 0.05, n = 3 biological replicates and n = 2 technical replicates); e) Analysis of mRNA expression of the indicated RNA helicases in normal T-cells and T-ALL cells (* indicates p < 0.05, n = 57 biological replicates)32; f) Relative amounts of Renilla luciferase expressed from the GQ construct in 3T3 cells and normalized to IRES/Firefly with either empty vector or the indicated genes, treated with Silvestrol (25 nM) for 24 hours, mean and standard deviation are shown, n = 3 biological replicates, n = 2 technical replicates.
Extended Data Figure 7. Silvestrol-sensitive transcripts.
a) Distribution of ribosomal footprints for the indicated genes, n = 2 biological replicates. Silvestrol: Red; Vehicle: black; purple dots: 9-mer motifs; blue dots 12-mer motif; b) Gene ontology classification for genes in TE down group with G-quadruplex, 12-mer and 9-mer motif; c) Venn diagram illustrating the overlap between TE and/or rDiff genes and reported super-enhancers in T-ALL cell lines34.
Extended Data Figure 8. Immunoblots and mRNA expression.
a) Lysates from human T-ALL lines treated with CR (25 nM, 24H) and probed as indicated; b) Lysates from JURKAT cells treated with escalating doses of Silvestrol and probed as indicated; c) mRNA levels for the indicated genes treated with vehicle (DMSO, black) or Silvestrol (red, 25 nM) for 45 minutes. Mean and standard deviation are shown, n = 2 biological replicates; d–g) Immunoblots of lysates from murine T-ALL cells expressing either vector control or IRES-MYC (d), IRES-CCND3 T283A (e), IRES-ICN (f), or IRES-BCL2 (g) and probed as indicated.
Supplementary Material
Summary of re-sequencing data showing mutation data observed in 36 T-ALL samples.
The multi-panel table provides results of a detailed analysis of the toxic effects of CR treatment in non-tumour bearing c57/B6 mice. a) Body and organ weights; b) Individual haematology; c) Bone marrow and spleen cytology; d) Individual chemistry.
a) Genes with decreased Translational Efficiency (TE down); b) Genes with increased Translational Efficiency (TE up); c) Background genes with no change in Translational Efficiency (TE background); d) Complete list of genes that showed a significant change in RF distribution across the length of their transcript (rDiff positive gene set); e) Genes that are both TE down and rDiff positive.
a–b) Complete lists of TE Down genes that harbour the 12-mer (a) or 9-mer (b) in their 5′UTRs; c–d) Complete lists of rDiff genes that harbour the 12-mer (c) or 9-mer (d) in their 5′UTRs; Prevalence of the TE Down 12-mer motif; e) TE Down genes with one or more predicted G-quadruplex structures; f) rDiff genes with one or more predicted G-quadruplex structures; g–h) Overlap of TE Down 12-mer motif (g) or 9-mer motif (h) with predicted G-quadruplexes. i–j) Overlap of rDiff 12-mer motif (i) or 9-mer motif (j) with predicted G-quadruplexes; k) Nucleotide-level depiction of the overlap between 9-mer motifs and G-quadruplexes. The motif is located at the positions marked X in the sequence. The middle row shows the structure. + represents that it is part of a G-quadruplex,) (represents a bond with another nucleotide.
Note: 12-mers or 9-mers are shown in red.
Overlap of TE down or rDiff genes with reported super-enhancer associated genes in the T-ALL cell lines DND41, JURKAT, or RPMI-840234. ‘+’ indicates presence of one or more 12-mers, 9-mers, or predicted G-quadruplexes in the 5′UTR.
Acknowledgments
We thank the members of Andrew Wolfe’s thesis committee: N. Rosen, A.M. Brown, and S.W. Lowe. For reagents and advice we thank J.T. Barata (Lisbon), W.S. Pear (U. Pennsylvania), R. Cencic (McGill), G.I. Evan (Cambridge), J. Cools (Leuven), A.A. Ferrando (Columbia U.), C.S. Fraser (UC Davis), N.J. Lajkiewicz (Boston U.), A. Luz and J.F. Glickman (Rockefeller U.), C.Y. Park, P. Yellen, A. Heguy, K. Huberman, and A. Viale (all MSKCC). This research was supported by NCI R01-CA142798-01 (HGW), the Leukemia Research Foundation (HGW), the Experimental Therapeutics Center (HGW), the American Cancer Society 10284 (HGW), HGW is a Scholar of the Leukemia and Lymphoma Society, EU grant no PITN-GA-2012-316861 (YZ), the Fund for Scientific Research FWO Flanders (JVdM and PR), grants G.0198.08 and G.0869.10N (FS), the GOA-UGent 12051203 (FS), Stichting tegen Kanker (FS), the Belgian Program of Interuniversity Poles of Attraction (FS), the Belgian Foundation Against Cancer (FS), the American Cancer Society PF-11-077-01-CDD (CMR), the Lymphoma Research Foundation (JHS), National Institutes of Health Grants GM-067041 and GM-073855 (JAP), and the Canadian Institutes of Health Research MOP-10653 (JP).
Footnotes
Online Content Additional Methods, Extended Data display items and Source Data are available in the online version of the paper; references unique to these sections appear only in the online paper.
Author contributions ALW performed in vivo and treatment studies; KS ribosome footprinting and RNA structure studies; YZ, PD analysed footprint data; VKR, VRS, KJM, MJ, JER, JHS, CYZ, JTF, and MAK contributed to experiments; CMR prepared (±)-CR-31-B; EdS directed murine drug toxicity experiments; JVdM, PR, FS genomic data on T-ALL; JAP, JP advised on all aspects of the study, GR supervised computational analyses, HGW designed the study and wrote the paper.
The authors declare no competing financial interests.
The ribosome footprinting and total mRNA sequencing data were deposited in the NCBI Gene Expression Omnibus database (GSE56887).
References
- 1.Wendel HG, et al. Survival signalling by Akt and eIF4E in oncogenesis and cancer therapy. Nature. 2004;428:332–337. doi: 10.1038/nature02369. [DOI] [PubMed] [Google Scholar]
- 2.Mamane Y, Petroulakis E, LeBacquer O, Sonenberg N. mTOR, translation initiation and cancer. Oncogene. 2006;25:6416–6422. doi: 10.1038/sj.onc.1209888. [DOI] [PubMed] [Google Scholar]
- 3.Rajasekhar VK, et al. Oncogenic Ras and Akt signaling contribute to glioblastoma formation by differential recruitment of existing mRNAs to polysomes. Molecular cell. 2003;12:889–901. doi: 10.1016/s1097-2765(03)00395-2. [DOI] [PubMed] [Google Scholar]
- 4.Jackson RJ, Hellen CU, Pestova TV. The mechanism of eukaryotic translation initiation and principles of its regulation. Nature Rev Mol Cell Biol. 2010;11:113–127. doi: 10.1038/nrm2838. [DOI] [PMC free article] [PubMed] [Google Scholar]
- 5.Lazaris-Karatzas A, Montine KS, Sonenberg N. Malignant transformation by a eukaryotic initiation factor subunit that binds to mRNA 5′ cap. Nature. 1990;345:544–547. doi: 10.1038/345544a0. [DOI] [PubMed] [Google Scholar]
- 6.Ruggero D, et al. The translation factor eIF-4E promotes tumor formation and cooperates with c-Myc in lymphomagenesis. Nature medicine. 2004;10:484–486. doi: 10.1038/nm1042. [DOI] [PubMed] [Google Scholar]
- 7.Wendel HG, et al. Dissecting eIF4E action in tumorigenesis. Genes & development. 2007;21:3232–3237. doi: 10.1101/gad.1604407. [DOI] [PMC free article] [PubMed] [Google Scholar]
- 8.Mavrakis KJ, et al. Tumorigenic activity and therapeutic inhibition of Rheb GTPase. Genes & development. 2008;22:2178–2188. doi: 10.1101/gad.1690808. [DOI] [PMC free article] [PubMed] [Google Scholar]
- 9.Parsyan A, et al. mRNA helicases: the tacticians of translational control. Nature reviews. Molecular cell biology. 2011;12:235–245. doi: 10.1038/nrm3083. [DOI] [PubMed] [Google Scholar]
- 10.Schatz JH, et al. Targeting cap-dependent translation blocks converging survival signals by AKT and PIM kinases in lymphoma. The Journal of experimental medicine. 2011;208:1799–1807. doi: 10.1084/jem.20110846. [DOI] [PMC free article] [PubMed] [Google Scholar]
- 11.Bordeleau ME, et al. Therapeutic suppression of translation initiation modulates chemosensitivity in a mouse lymphoma model. The Journal of clinical investigation. 2008;118:2651–2660. doi: 10.1172/JCI34753. [DOI] [PMC free article] [PubMed] [Google Scholar]
- 12.Marintchev A, et al. Topology and regulation of the human eIF4A/4G/4H helicase complex in translation initiation. Cell. 2009;136:447–460. doi: 10.1016/j.cell.2009.01.014. [DOI] [PMC free article] [PubMed] [Google Scholar]
- 13.Meijer HA, et al. Translational repression and eIF4A2 activity are critical for microRNA-mediated gene regulation. Science. 2013;340:82–85. doi: 10.1126/science.1231197. [DOI] [PubMed] [Google Scholar]
- 14.Ingolia NT, Ghaemmaghami S, Newman JR, Weissman JS. Genome-wide analysis in vivo of translation with nucleotide resolution using ribosome profiling. Science. 2009;324:218–223. doi: 10.1126/science.1168978. [DOI] [PMC free article] [PubMed] [Google Scholar]
- 15.Thoreen CC, et al. A unifying model for mTORC1-mediated regulation of mRNA translation. Nature. 2012;485:109–113. doi: 10.1038/nature11083. [DOI] [PMC free article] [PubMed] [Google Scholar]
- 16.Hsieh AC, et al. The translational landscape of mTOR signalling steers cancer initiation and metastasis. Nature. 2012;485:55–61. doi: 10.1038/nature10912. [DOI] [PMC free article] [PubMed] [Google Scholar]
- 17.Palomero T, et al. Mutational loss of PTEN induces resistance to NOTCH1 inhibition in T-cell leukemia. Nature medicine. 2007;13:1203–1210. doi: 10.1038/nm1636. [DOI] [PMC free article] [PubMed] [Google Scholar]
- 18.Weng AP, et al. c-Myc is an important direct target of Notch1 in T-cell acute lymphoblastic leukemia/lymphoma. Genes & development. 2006;20:2096–2109. doi: 10.1101/gad.1450406. [DOI] [PMC free article] [PubMed] [Google Scholar]
- 19.Zenatti PP, et al. Oncogenic IL7R gain-of-function mutations in childhood T-cell acute lymphoblastic leukemia. Nat Genet. 2011;43:932–939. doi: 10.1038/ng.924. ng.924 [pii] [DOI] [PMC free article] [PubMed] [Google Scholar]
- 20.Pear WS, et al. Exclusive development of T cell neoplasms in mice transplanted with bone marrow expressing activated Notch alleles. The Journal of experimental medicine. 1996;183:2283–2291. doi: 10.1084/jem.183.5.2283. [DOI] [PMC free article] [PubMed] [Google Scholar]
- 21.Rong L, et al. Control of eIF4E cellular localization by eIF4E-binding proteins, 4E-BPs. Rna. 2008;14:1318–1327. doi: 10.1261/rna.950608. [DOI] [PMC free article] [PubMed] [Google Scholar]
- 22.Rodrigo CM, Cencic R, Roche SP, Pelletier J, Porco JA. Synthesis of rocaglamide hydroxamates and related compounds as eukaryotic translation inhibitors: synthetic and biological studies. Journal of medicinal chemistry. 2012;55:558–562. doi: 10.1021/jm201263k. [DOI] [PMC free article] [PubMed] [Google Scholar]
- 23.Choo AY, Yoon SO, Kim SG, Roux PP, Blenis J. Rapamycin differentially inhibits S6Ks and 4E-BP1 to mediate cell-type-specific repression of mRNA translation. Proceedings of the National Academy of Sciences of the United States of America. 2008;105:17414–17419. doi: 10.1073/pnas.0809136105. [DOI] [PMC free article] [PubMed] [Google Scholar]
- 24.Anders S, Reyes A, Huber W. Detecting differential usage of exons from RNA-seq data. Genome Res. 2012;22:2008–2017. doi: 10.1101/gr.133744.111. [DOI] [PMC free article] [PubMed] [Google Scholar]
- 25.Drewe P, et al. Accurate detection of differential RNA processing. Nucleic acids research. 2013;41:5189–5198. doi: 10.1093/nar/gkt211. [DOI] [PMC free article] [PubMed] [Google Scholar]
- 26.Meyuhas O. Synthesis of the translational apparatus is regulated at the translational level. Eur J Biochem. 2000;267:6321–6330. doi: 10.1046/j.1432-1327.2000.01719.x. [DOI] [PubMed] [Google Scholar]
- 27.Pelletier J, Sonenberg N. Internal initiation of translation of eukaryotic mRNA directed by a sequence derived from poliovirus RNA. Nature. 1988;334:320–325. doi: 10.1038/334320a0. [DOI] [PubMed] [Google Scholar]
- 28.Bailey TL. DREME: motif discovery in transcription factor ChIP-seq data. Bioinformatics. 2011;27:1653–1659. doi: 10.1093/bioinformatics/btr261. [DOI] [PMC free article] [PubMed] [Google Scholar]
- 29.Bugaut A, Balasubramanian S. 5′-UTR RNA G-quadruplexes: translation regulation and targeting. Nucleic acids research. 2012;40:4727–4741. doi: 10.1093/nar/gks068. [DOI] [PMC free article] [PubMed] [Google Scholar]
- 30.Booy EP, et al. The RNA helicase RHAU (DHX36) unwinds a G4-quadruplex in human telomerase RNA and promotes the formation of the P1 helix template boundary. Nucleic acids research. 2012;40:4110–4124. doi: 10.1093/nar/gkr1306. [DOI] [PMC free article] [PubMed] [Google Scholar]
- 31.Chakraborty P, Grosse F. Human DHX9 helicase preferentially unwinds RNA-containing displacement loops (R-loops) and G-quadruplexes. DNA Repair (Amst) 2011;10:654–665. doi: 10.1016/j.dnarep.2011.04.013. [DOI] [PubMed] [Google Scholar]
- 32.Van Vlierberghe P, et al. ETV6 mutations in early immature human T cell leukemias. The Journal of experimental medicine. 2011;208:2571–2579. doi: 10.1084/jem.20112239. [DOI] [PMC free article] [PubMed] [Google Scholar]
- 33.Sadlish H, et al. Evidence for a Functionally Relevant Rocaglamide Binding Site on the eIF4A-RNA Complex. ACS chemical biology. 2013 doi: 10.1021/cb400158t. [DOI] [PMC free article] [PubMed] [Google Scholar]
- 34.Hnisz D, et al. Super-enhancers in the control of cell identity and disease. Cell. 2013;155:934–947. doi: 10.1016/j.cell.2013.09.053. [DOI] [PMC free article] [PubMed] [Google Scholar]
- 35.Penn LJ, Brooks MW, Laufer EM, Land H. Negative autoregulation of c-myc transcription. The EMBO journal. 1990;9:1113–1121. doi: 10.1002/j.1460-2075.1990.tb08217.x. [DOI] [PMC free article] [PubMed] [Google Scholar]
- 36.Kumari S, Bugaut A, Huppert JL, Balasubramanian S. An RNA G-quadruplex in the 5′ UTR of the NRAS proto-oncogene modulates translation. Nat Chem Biol. 2007;3:218–221. doi: 10.1038/nchembio864. [DOI] [PMC free article] [PubMed] [Google Scholar]
- 37.Shahid R, Bugaut A, Balasubramanian S. The BCL-2 5′ untranslated region contains an RNA G-quadruplex-forming motif that modulates protein expression. Biochemistry. 2010;49:8300–8306. doi: 10.1021/bi100957h. [DOI] [PMC free article] [PubMed] [Google Scholar]
- 38.Morris MJ, Negishi Y, Pazsint C, Schonhoft JD, Basu S. An RNA G-quadruplex is essential for cap-independent translation initiation in human VEGF IRES. J Am Chem Soc. 2010;132:17831–17839. doi: 10.1021/ja106287x. [DOI] [PubMed] [Google Scholar]
- 39.Huppert JL, Bugaut A, Kumari S, Balasubramanian S. G-quadruplexes: the beginning and end of UTRs. Nucleic acids research. 2008;36:6260–6268. doi: 10.1093/nar/gkn511. [DOI] [PMC free article] [PubMed] [Google Scholar]
- 40.Moerke NJ, et al. Small-molecule inhibition of the interaction between the translation initiation factors eIF4E and eIF4G. Cell. 2007;128:257–267. doi: 10.1016/j.cell.2006.11.046. [DOI] [PubMed] [Google Scholar]
- 41.Kentsis A, Topisirovic I, Culjkovic B, Shao L, Borden KL. Ribavirin suppresses eIF4E-mediated oncogenic transformation by physical mimicry of the 7-methyl guanosine mRNA cap. Proc Natl Acad Sci USA. 2004;101:18105–18110. doi: 10.1073/pnas.0406927102. [DOI] [PMC free article] [PubMed] [Google Scholar]
- 42.Jean G, Kahles A, Sreedharan VT, De Bona F, Ratsch G. RNA-Seq read alignments with PALMapper. In: Baxevanis Andreas D, et al., editors. Current protocols in bioinformatics/editoral board. Unit 11. Chapter 11. 2010. p. 16. [DOI] [PubMed] [Google Scholar]
- 43.Flicek P, et al. Ensembl 2013. Nucleic acids research. 2013;41:D48–55. doi: 10.1093/nar/gks1236. [DOI] [PMC free article] [PubMed] [Google Scholar]
- 44.Quast C, et al. The SILVA ribosomal RNA gene database project: improved data processing and web-based tools. Nucleic acids research. 2013;41:D590–596. doi: 10.1093/nar/gks1219. [DOI] [PMC free article] [PubMed] [Google Scholar]
- 45.Dobin A, et al. STAR: ultrafast universal RNA-seq aligner. Bioinformatics. 2013;29:15–21. doi: 10.1093/bioinformatics/bts635. [DOI] [PMC free article] [PubMed] [Google Scholar]
- 46.Li H, et al. The Sequence Alignment/Map format and SAMtools. Bioinformatics. 2009;25:2078–2079. doi: 10.1093/bioinformatics/btp352. [DOI] [PMC free article] [PubMed] [Google Scholar]
- 47.Katz Y, Wang ET, Airoldi EM, Burge CB. Analysis and design of RNA sequencing experiments for identifying isoform regulation. Nature methods. 2010;7:1009–1015. doi: 10.1038/nmeth.1528. [DOI] [PMC free article] [PubMed] [Google Scholar]
- 48.Grant CE, Bailey TL, Noble WS. FIMO: scanning for occurrences of a given motif. Bioinformatics. 2011;27:1017–1018. doi: 10.1093/bioinformatics/btr064. [DOI] [PMC free article] [PubMed] [Google Scholar]
- 49.Hofacker IL. Vienna RNA secondary structure server. Nucleic acids research. 2003;31:3429–3431. doi: 10.1093/nar/gkg599. [DOI] [PMC free article] [PubMed] [Google Scholar]
- 50.Fratta P, et al. C9orf72 hexanucleotide repeat associated with amyotrophic lateral sclerosis and frontotemporal dementia forms RNA G-quadruplexes. Scientific reports. 2012;2:1016. doi: 10.1038/srep01016. [DOI] [PMC free article] [PubMed] [Google Scholar]
- 51.Greenfield NJ. Using circular dichroism collected as a function of temperature to determine the thermodynamics of protein unfolding and binding interactions. Nature protocols. 2006;1:2527–2535. doi: 10.1038/nprot.2006.204. [DOI] [PMC free article] [PubMed] [Google Scholar]
- 52.Mavrakis KJ, et al. A cooperative microRNA-tumor suppressor gene network in acute T-cell lymphoblastic leukemia (T-ALL) Nat Genet. 2011;43:673–678. doi: 10.1038/ng.858. ng.924 [pii] [pii] [DOI] [PMC free article] [PubMed] [Google Scholar]
- 53.Shochat C, et al. Gain-of-function mutations in interleukin-7 receptor-alpha (IL7R) in childhood acute lymphoblastic leukemias. The Journal of experimental medicine. 2011;208:901–908. doi: 10.1084/jem.20110580. [DOI] [PMC free article] [PubMed] [Google Scholar]
- 54.Zuurbier L, et al. The significance of PTEN and AKT aberrations in pediatric T-cell acute lymphoblastic leukemia. Haematologica. 2012 doi: 10.3324/haematol.2011.059030. [DOI] [PMC free article] [PubMed] [Google Scholar]
- 55.Menten B, et al. arrayCGHbase: an analysis platform for comparative genomic hybridization microarrays. BMC Bioinformatics. 2005;6:124. doi: 10.1186/1471-2105-6-124. [DOI] [PMC free article] [PubMed] [Google Scholar]
- 56.Galicia-Vazquez G, Cencic R, Robert F, Agenor AQ, Pelletier J. A cellular response linking eIF4AI activity to eIF4AII transcription. Rna. 2012;18:1373–1384. doi: 10.1261/rna.033209.112. [DOI] [PMC free article] [PubMed] [Google Scholar]
Associated Data
This section collects any data citations, data availability statements, or supplementary materials included in this article.
Supplementary Materials
Summary of re-sequencing data showing mutation data observed in 36 T-ALL samples.
The multi-panel table provides results of a detailed analysis of the toxic effects of CR treatment in non-tumour bearing c57/B6 mice. a) Body and organ weights; b) Individual haematology; c) Bone marrow and spleen cytology; d) Individual chemistry.
a) Genes with decreased Translational Efficiency (TE down); b) Genes with increased Translational Efficiency (TE up); c) Background genes with no change in Translational Efficiency (TE background); d) Complete list of genes that showed a significant change in RF distribution across the length of their transcript (rDiff positive gene set); e) Genes that are both TE down and rDiff positive.
a–b) Complete lists of TE Down genes that harbour the 12-mer (a) or 9-mer (b) in their 5′UTRs; c–d) Complete lists of rDiff genes that harbour the 12-mer (c) or 9-mer (d) in their 5′UTRs; Prevalence of the TE Down 12-mer motif; e) TE Down genes with one or more predicted G-quadruplex structures; f) rDiff genes with one or more predicted G-quadruplex structures; g–h) Overlap of TE Down 12-mer motif (g) or 9-mer motif (h) with predicted G-quadruplexes. i–j) Overlap of rDiff 12-mer motif (i) or 9-mer motif (j) with predicted G-quadruplexes; k) Nucleotide-level depiction of the overlap between 9-mer motifs and G-quadruplexes. The motif is located at the positions marked X in the sequence. The middle row shows the structure. + represents that it is part of a G-quadruplex,) (represents a bond with another nucleotide.
Note: 12-mers or 9-mers are shown in red.
Overlap of TE down or rDiff genes with reported super-enhancer associated genes in the T-ALL cell lines DND41, JURKAT, or RPMI-840234. ‘+’ indicates presence of one or more 12-mers, 9-mers, or predicted G-quadruplexes in the 5′UTR.


