

Abstract
Exosomes participate in cancer metastasis, but studying them presents unique challenges as a result of their small size and purification difficulties. Asymmetrical field flow fractionation with in-line ultraviolet absorbance, dynamic light scattering, and multi-angle light scattering was applied to the size separation and characterization of non-labeled B16-F10 exosomes from an aggressive mouse melanoma cell culture line. Fractions were collected and further analyzed using batch mode dynamic light scattering, transmission electron microscopy and compared with known size standards. Fractogram peak positions and computed radii show good agreement between samples and across fractions. Ultraviolet absorbance fractograms in combination with transmission electron micrographs were able to resolve subtle heterogeneity of vesicle retention times between separate batches of B16-F10 exosomes collected several weeks apart. Further, asymmetrical field flow fractionation also effectively separated B16-F10 exosomes into vesicle subpopulations by size. Overall, the flow field flow fractionation instrument combined with multiple detectors was able to rapidly characterize and separate exosomes to a degree not previously demonstrated. These approaches have the potential to facilitate a greater understanding of exosome function by subtype, as well as ultimately allow for “label-free” isolation of large scale clinical exosomes for the purpose of developing future exosome-based diagnostics and therapeutics.
Keywords: Field flow fractionation, Exosomes, Separation, Multi-angle light scattering, Dynamic light scattering, Cancer
Introduction
Extracellular vesicles are important in cell signaling and consist of membrane-bound vesicles that have been released from cells in three primary types: exosomes, microvesicles, and apoptotic bodies. Exosomes are excreted by the fusion of a multi-vesicular body (MVB) with the plasma membrane of the cell [1, 2]. Upon fusion, the intraluminal vesicles from within the MVB are emptied to the extracellular space, becoming exosomes [3]. Exosomes are traditionally 15–50 nm in radius [4–9], but larger exosomes (~75 nm radius) of endothelial origin have been reported [10]. Microvesicles (10–500 nm radius [8]) are heterogeneous [11] and bleb directly from the cell membrane. Apoptotic bodies (500–2,500 nm radius [8]) contain organelles [3] and remnants of programmed cell death. Other particles that may be present in the cellular milieu include viruses, soluble proteins, protein aggregates, bacteria, and cellular fragments. Developing methods to separate vesicle types from one another and from this milieu will allow researchers to develop a better understanding of vesicle components and function.
Compared to other extracellular vesicles, exosomes are much smaller and, thus, require special consideration in separation and analysis. They are too small for typical light microscopy or direct flow cytometry [12] and require ultracentrifugation to sediment. As a result, the methods used to characterize exosomes often rely on electron microscopy and fluorescence-based detection and tracking techniques [9, 13]. Some additional characterization techniques that may be useful for biological particles in the size range of exosomes are reviewed in [12, 14, and 6] and include atomic force microscopy, indirect flow cytometry methods, multi-angle light scattering (MALS), impedance-based methods, nanoparticle-tracking analysis, and dynamic light scattering (DLS) [9]. Despite only having a moderate zeta potential (−16 mV in PBS buffer) [15], exosomes have been shown to be fairly stable in size over many environmental conditions, including temperature, freeze-thaw cycles, and cycles of differential ultracentrifugation [6].
Exosomes have diverse roles including aiding in reticulocyte maturation [16, 17] and in avoiding early maternal immune trophoblast rejection [8]. In cancers, exosomes have been shown to laterally transfer oncogenes [18] and translatable mRNA [19], facilitate immune system evasion, promote angiogenesis [9, 8], support cancer growth and metastasis [5, 2], and enable tumor survival by expelling anti-cancer agents such as cisplatin [20, 8]. Considering their diversity of actions, it is not surprising that Exocarta [21, 22] and Vesicleopedia [23] databases are devoted to listing their differences. Utilizing the specificity and cargo-carrying capacity of exosomes, it has been proposed that exosomes be modified for use in therapeutic treatments for disease [2].
The most commonly used technique to purify exosomes is differential ultracentrifugation, but several other techniques are also used including ultracentrifugation in a density gradient, high-pressure liquid chromatography-gel exclusion chromatography (HPLC-GEC), solvent precipitation, ultrafiltration, immunoaffinity capture (IAC), and field flow fractionation (FFF). In differential ultracentrifugation, a sample to be separated is first filtered [24] or spun at a series of slow speeds to eliminate cellular debris and microvesicles [11]. Exosomes are finally pelleted at ≥100,000×g [25] in an ultracentrifuge. Differential ultracentrifugation is reported to result in non-ideal clumping of the exosomes [26, 8], but this seems contrary to the finding of other researchers [6]. Ultracentrifugation in a density gradient separates a sample based on density using a gradient medium such as sucrose. Exosomes have densities 1.13–1.19 g/cm3 [8, 7, 27] and may be separated with an ultracentrifuge in a continuous gradient medium or by using a single-density sucrose cushion [27]. Combining differential ultracentrifugation with a density-based technique helps remove proteins that may co-elute with the exosome sample during standard differential ultracentrifugation. HPLC-GEC can also successfully separate both liposomes [28–30] and exosomes [31–33]. The column packing material is selected for a given size separation cutoff. Additionally, since the sample interacts with the high-surface area of a gel-filled column, any adhesion to the packing material [30] can decrease the yield. As with other methods, the interaction of the particle with the elution buffer can cause the particles to degrade or aggregate leading to poor fractionation and decreased yields. Solvent precipitation is a technique that successfully separates exosomes at relatively slow spin speeds without an ultracentrifuge. Three commercial kits using solvent precipitation are Exosome Isolation kit (Life Technologies), ExoQuick (System Bioscience), and Exospin (Cell Guidance System). ExoQuick boasts a high yield relative to other methods [25] and works by capturing microvesicles from 30 to 90 nm in radius in a polymer lattice. The miRNA profile obtained through ExoQuick was slightly different than being obtained through differential ultracentrifugation [34]. ExoQuick can be adversely affected by contaminating proteins which required additional filtration or ultracentrifugation steps for removal [35]. Ultrafiltration is a very simple exosome separation method based on whether or not a particle fits through a commercial filter with a known pore size. Larger contaminants are first removed with a slow to medium speed spin [36, 37]. Subsequently, exosomes are retained [31] on spin filters [38, 39] at 3,000×g [36]. The use of an intermediate filter step with a different membrane type achieved higher recovery rates of urinary exosomes [27, 37]. Aside from the relative simplicity of ultrafiltration, it also had the benefit of isolating exosomes from small (0.5–10 ml) samples [27].
IAC relies on the binding of an antibody to its specific antigen. As the knowledge of the subcomponents of exosomes grows, more individual antigen targets (typically proteins) are identified that can be used to specifically identify exosomes. Substrates or microbeads are selected for exosome recovery by coating with antibodies and then exposed to samples containing exosomes. IAC capture methods to purify exosomes include immunomagnetic beads [25], polystyrene beads [40] as in the case of fluorescence-activated cell sorting (FACS) [41], or antibody capture surfaces [26] including microarrays [42]. IAC is the only capture technique that is specific enough to distinguish exosome subtypes, such as tumor-derived exosomes expressing specific antigens [25]. Unfortunately, since many of the antigens conspicuously present on exosomes are also present on other cells or membrane vesicles, a size-based separation may still be required to ensure that only exosomes are recovered. The selectivity of IAC is impressive, but requires a priori identification of the exosome antigen. If the target antigen is not present or is underrepresented, IAC may not effectively capture a specific subfraction of the total exosome population. In this way, the process of correlating specific exosome biomarkers to disease-relevant information may be impeded. The high specificity of IAC also does not necessarily translate into a higher exosome yield. A comparative study [25] found that in terms of total mRNA and total protein recovery, immunoaffinity methods were on par with ultracentrifugation and chromatography, but all these methods recovered less material than ExoQuick (solvent precipitation). In contrast, with the goal of obtaining a very homogeneous exosome sample, a recent article comparing separation methods found that IAC “… was able to enrich exosome markers and exosome-associated proteins by at least two-fold more than the other two methods.” [43]. In instances where capture is not required, immunostains [24] are often employed to confirm the presence of antigens in fractions containing exosomes. While the purchase of the required specific antibodies can be costly, selectivity is achieved.
FFF is a technique where particles are separated by their position in a laminar velocity gradient. In asymmetrical flow field flow fractionation [44] (A4F), a cross-flow perpendicular to the down-channel flow drives particles toward the membrane that bounds the channel. Diffusion causes particles to migrate away from the membrane, opposing the cross-flow. Because smaller particles have greater Brownian motion, they migrate farther on average into the bulk flow, which velocity increases parabolically with distance from the membrane. Therefore, smaller particles travel down-channel faster on average than large particles, eluting from the channel at times which correspond to size, with peaks that can be detected and collected as fractions similar to HPLC-GEC. In this “normal mode” separation, the smallest particles elute first.
FFF has been applied to various sized particles [45] and liposomes [46], but field flow fractionation of exosomes has only been performed rarely: Two of these papers were produced by a common author and evaluated exosomes from the human mesenchymal stem cell line (B10) [38] and human neural stem cell line (HB1.F3) [39], a third evaluated circulating exosomes in the blood [47]. Although more technically complex than some of the other techniques, FFF shows an advantage and promises in achieving high-quality separations of exosomes for several reasons. Few techniques can effect a separation so gently [48] as FFF, which requires no stationary phase, and allows nearly any fluid to elute the sample including the sample’s original buffer. The subtle separation forces act across a gradient of sizes in a fluid medium instead of requiring the sample to become a pellet or pass through a pore to achieve separation. Additionally, separation of exosomes into subpopulations from a single cell type can be performed without any of the biological tags required with affinity methods. Fractionated exosomes eluting at different times expressed different proteins as evaluated with mass spectrometry [39]. While this technique is capable of independent size-based separations, it may also be coupled to affinity methods for increased specificity. Some of the drawbacks of this method are that samples become diluted, and membranes or elution buffers may cause sticking or aggregation of particles similar to the problems of HPLC-GEC methods. This sticking can be significant. For example, bovine serum albumin was found to have recovery rates in a flow FFF system between 37 and 75 % varying directly with the level of cross-flow [39]. Considering the many exosome differences shown in terms of protein, lipids, and nucleic acid content in recent years [22, 21, 23], it seems reasonable that additional cell types should be evaluated with FFF. While other methods show great promise, using FFF to gently separate exosomes may be advantageous in resolving differences between exosome sub-populations. Here, we extend the use of the FFF platform to exosomes derived from a mouse melanoma B16-F10 cell line for the first time and demonstrate the ability to detect consistent as well as subtle differences within a population of exosomes from a single cell line. In addition, multiple detectors are employed in tandem to generate additional information about the size subpopulations in real time.
Experimental methods
Cell culture and exosome isolation
Isolation and characterization of highly purified populations of B16 melanoma exosomes from cell culture by means of differential centrifugation and ultracentrifugation have previously been established [2, 49, 13] Summarizing briefly, B16-F10 mouse melanoma cells (ATCC CRL 6475) were cultured at 37 °C “in 90 % Dulbecco’s modified Eagle’s medium (DMEM), with 10 % heat-inactivated fetal bovine serum and 5 % CO2.” After growing to 70 % confluence in three 300-cm2 flasks, the culture media was removed and the cells were washed with phosphate-buffered saline (PBS). Cells were then cultured for 48 h in media that had previously been conditioned through overnight ultracentrifugation at 110,000g to remove any bovine exosomes. Melanoma exosomes were harvested after 48 h using a series of differential centrifugation steps in which the supernatants were collected and the pellets were discarded: 300g for 10 min, 2,000g for 10 min, and 10,000g for 30 min. Finally, the pellet was collected after 100,000g for 2 h and washed three times in PBS, pooled, and re-isolated in PBS again at 100,000g for 2 h. The pellet was resuspended in 1 ml PBS, a bicinchoninic acid (BCA) assay for protein absorbance was performed (Pierce), and sample stored at −80 °C until use. While samples A, B, and C were all cultured the same, differences existed in terms of cell passage number and exosome yield. The American Type Culture Collection (ATCC) does not publish recommended passage numbers for B16-F10 melanoma cells given their immortality. However, previous reports indicate that B16-F10 melanoma cells retain similar metastatic capacity in mice even at a tested passage number of 17 [49] and well beyond in our experience. Given that melanoma exosomes are pro-metastatic [2], this guided our exosome sampling process. As such, samples A and B were obtained at passage numbers of approximately P5 and P8 with 18 days of continuous culture time between isolations. Both samples A and B contained typical exosome protein yields of approximately 1.2 and 0.5 mg for collections from three 300-cm2 flasks easily reaching 70 % confluence respectively. In contrast, sample C was obtained at a high passage number of slower growing cells of at least P18 while having difficulty reaching 70 % confluence. Sample C contained only 0.15 mg of B16 melanoma exosome protein. We have noted through repeated batch isolations that yields <0.2 mg B16 melanoma exosome protein are produced approximately 10 % of the time, and we typically discard and do not use such small batch sizes from slow-growing cells having set a target of ≥0.5 mg of exosome protein per batch to obtain enough material for downstream experimentation. All samples were collected at Washington University in St. Louis and shipped frozen to the University of Utah overnight on ice.
Field flow fractionation and detection
Exosomes were thawed on ice. A4F was performed at room temperature on a PostNova AF2000 Focus instrument using a 10-kDa molecular weight cutoff (MWCO) regenerated cellulose membrane. PBS buffer was filtered with a 100-nm inline filter, and flow parameters were as follows: 350 μm channel thickness, 0.4 ml/min detector flow throughout, 0.1 ml/min tip flow during focusing, 0.5 ml/min cross-flow during focusing, 7 min focus flow, 1 min transition time, a linear decrease in cross-flow to 0.3 ml/min over 10 min, then a linear decrease over 30 min to 0 ml/min before the rinse step when all flows were switched off except the tip flow. In some tests, this linear decrease rate was modified slightly to accommodate a machine error at low cross-flows near the rinse. Detectors were arranged as shown in Fig. 1 with the detector flow passing first through the ultraviolet absorbance (UV) detector (Prominance SPD-20A) which measured the absorbance at 260 nm for the detection of proteins and nucleic acids. In later tests, both absorbance at 260 and 280 nm were measured.
Fig. 1.
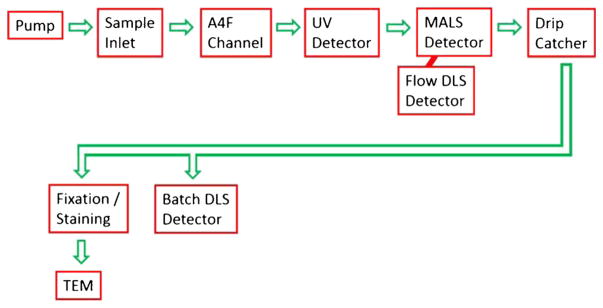
Flow diagram of the fluid path through the AF4 instrument, detectors, and transmission electron microscope
Immediately downstream was the MALS and flow DLS detectors (Wyatt Dawn Helios II and Wyatt DynaPro Nanostar). MALS determines the root mean square radius of the exosomes, whereas dynamic light scattering (DLS) independently measures the hydrodynamic radius of the exosomes. Size fractions were collected manually. Several of the fractions were measured in the DynaPro Nanostar instrument in batch DLS mode within a few hours of fractionation using disposable Eppendorf UVettes. While batch DLS and flow DLS are essentially the same technique (sometimes called quasi-elastic light scattering), batch mode is run in a cuvette with many averaged repeat measurements, and flow DLS measured a sample as it moves in a flow. Two methods are commonly applied to processing DLS data, namely the method of cumulants and the method of regularization. Cumulants assume that there is a single population of sizes of particles. Regularization allows DLS to compute multiple decay time constants and thus multiple radii for a mixture of particle populations. Regularization (Wyatt uses the DYNALS) is most often used in batch mode whereas flow-mode DLS typically uses cumulants. The measurement cells and lasers for the batch DLS and the flow DLS are located in separate instruments; however, both the Wyatt Dawn Helios II and the Wyatt DynaPro Nanostar used Ga-As lasers of 658 nm nominal wavelength. In the MALS, flow DLS, and batch DLS, the size data was determined with Wyatt Software based on well-known equations [50]. The Zimm method was originally selected for the particle model because it is “valid for unilamellar spherical vesicles that are no more than ~200 nm in diameter [46]”. Because exosomes are spherical in solution [24], the sphere model [51] was also applied.
Negative staining and transmission electron microscopy
Subfractions corresponding to each peak of interest (1st peak, 12–20 min; 2nd peak, 24–32 min) were combined by sample type and concentrated using Amicon Ultra-4 10 kDa MWCO centrifuge filters. Exosomes were stained as per modified procedure modified from [52] briefly as follows: 3.5 μl of sample was placed on a carbon grid and allowed to rest for 60 s before blotting with filter paper. Using forceps, the carbon grid was dipped facedown in a water droplet for 2–3 s and again blotted. One percent uranyl acetate (3.5 μl) was pipetted onto the grid and allowed to rest for 15 s before blotting and drying. Transmission electron microscopy (TEM) images were taken with a JEOL 1400 TEM at an acceleration voltage of 120 keV and a Gatan Orius Camera.
Data analysis and sample recovery
The UV readings at 260 and 280 nm from a Beckman DU-650 Spectrophotometer were cross-checked with those from the in-line (to FFF) UV detector (Prominance SPD-20A) using different known concentrations of bovine serum albumin and a syringe pump to verify that the two UV instruments gave equivalent steady-state absorbance values. The UV absorbance (260 and 280 nm) of each dilution of exosome sample in PBS was measured in a quartz cuvette and plotted against the BCA concentration. Each resulting linear relationship had a slope (attenuation coefficient) specific to each exosome type. Using this relationship, the absorbance from the in-line UV detector could be converted to BCA milligram protein and integrated to obtain the total BCA protein content recovered during the entire run. One hundred times the ratio of the recovered to the injected BCA protein was the percent recovered. At zero cross-flow, particles are not retained, so the recovery should be 100 %. This method was checked in-line with the FFF at zero cross-flow by injecting a stepped series of identical known dilutions of exosome sample C spanning most of the detectable range of the UV detector and checking the percent recovered.
As a second measure of recovery, integration of the intensity from the 90° MALS detector was used as a static light scattering detector. The integrated 90° MALS signal (multiplied by the time between data points) during FFF runs correlated with the total BCA microgram protein injected (R2=.71); however, only relative percent recovery was surmised among tests run under the same flow conditions.
Results
FluoSpheres carboxylate-modified polystyrene nanosphere standards suspended in 2 mM NaN3 (Invitrogen) of known diameters were diluted, combined, and then injected in the AF4 instrument using the same experimental conditions as was used for the exosomes. Three peaks were obtained corresponding to each standard at 17 min (20 nm radius), 21 min (50 nm radius), and 29 min (100 nm radius), as shown in Fig. 2. These results were used to help calibrate (R2=.998) the size estimations made using flow FFF. Note that each detector registers a synchronous response centered at the time that each size of the polystyrene standards passes the detectors.
Fig. 2.

Normalized signals show the peak positions from separating a mixture of polystyrene standards in PBS buffer using the protocol for exosome separation: 17 min (20 nm radius), 21 min (50 nm radius), and 29 min (100 nm radius)
Successful fractionation of exosomes was achieved as demonstrated by typical exosome fractograms for samples A and B, as shown in Fig. 3. Peaks were found for the exosomes at 16 and 26 min which correspond to radii of 15 and 81 nm, respectively, by interpolation of the polystyrene standard data. Samples A and B had similar peaks and line shapes for MALS and flow DLS, but sample A had a large, extra peak at about 16 min that was clearly visible from the UV data. Note that an instrumentation problem at very low cross-flows (near the rinse) was fixed by a slight modification to the rate of decrease in the overall cross-flow for some of the tests which shifted both peaks by about 1–2 min relative to the protocol for the standards. Exosomes were kept frozen at −80 °C for 4 months, and the same peaks were observed (data not shown), suggesting that the exosomes were relatively stable.
Fig. 3.
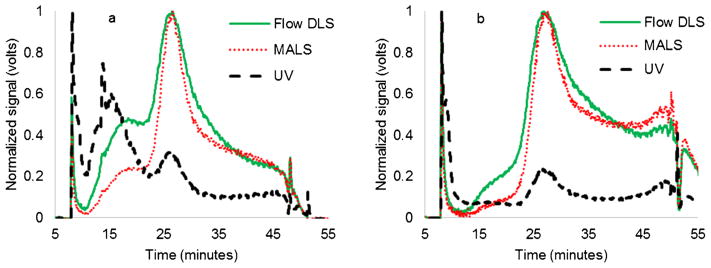
a Normalized signals showing the fractogram of sample A (51 μg protein). b Normalized signals showing the fractogram of sample B (39 μg protein). The UV signal has an extra peak at 16 min for sample A
The measured exosome radii from a relatively concentrated sample (60 μg sample A) is shown as either the root mean square radius (RMS) or the geometric radius from the MALS detector for the Zimm and sphere approximation, respectively, or hydrodynamic radius (Rh) from the flow and batch DLS detector (Fig. 4) and is calculated with Wyatt software. In Fig. 4, the raw signal from the MALS 90° detector is shown for reference. The radii agree for exosomes less than about 50 nm, but the RMS radius (MALS) and the Rh (flow DLS) measurements begin to diverge at larger diameters. The batch DLS data is from static DLS measurements of captured fractions. In Fig. 5, the fractionated exosome radii are very similar by all methods tested and in comparing across sample types A, B, and C, which are apparent even when fewer exosomes were injected, as shown in comparing Fig. 4 with Fig. 5. The radii achieved from extrapolation of known polystyrene standards correspond best to the MALS-based techniques (Zimm and sphere) (Figs. 4 and 5).
Fig. 4.

Raw MALS 90° detector signal from fractionation of a 60 μg of sample A. Left axis: raw signal for the 90° MALS detector; right axis: Zimm RMS radii from MALS, sphere geometric radii from MALS, Rh from flow DLS, Rh from batch DLS, and radius calculated from extrapolation of elution times of polystyrene standards of known radii. Radii for sample A agree well at middle ranges of radii but flow-mode DLS and Zimm-based MALS especially diverge at higher run times, which corresponds to larger particles. The standard radius follows both the sphere-based MALS and the Zimm-based MALS at different times
Fig. 5.

Comparison of raw MALS 90° detector response of injecting three exosome types into the FFF. a 20 μg (sample A), b 9 μg (sample B), and c 20 μg (sample C). All samples had very similar radii by MALS, flow DLS, and batch DLS even at these lower concentrations
The determination of exosome radii is helpful and was determined independent of the recovery of the particles. Using the UV integration methods described previously primarily at 260 nm, we calculated the total recovery of samples A, B, and C to be about 30, 17, and 9 %, respectively, in FFF with the cross-flows used in separation.
MALS is comprised of many static light scattering detectors capable of measuring concentration changes for equally sized particles independent of the UV detector. Signal above noise for exosomes was detectable across nearly 2.5 decades on a log plot using the 90° MALS detector. For equally sized particles, the areas under the curve give an estimate of relative recovery of sample. In Fig. 6, this increase in injected concentration of exosomes to the AF4 is reflected in an increase to the raw intensity and area under the 90° MALS detector curves. Figure 6 also shows the relative peak positions from run to run on the time scale. Of note is that even though they were run with the same flow profile and had similar injected protein amounts (~20 μg), samples A and B (Fig. 6a, b) had similar peak areas,, but sample C was considerably lower. This may be due to a physical difference in sample C that reduces its recovery.
Fig. 6.

Raw MALS 90° detector response. a Sample A, b sample B, c sample C. Peak positions were reproducible for each sample. Samples with higher protein concentration have higher signal intensities (volts). A greatly reduced area under the curve in C (note change in scale) despite injecting a similar amount of protein indicated that the recovery was significantly worse in sample C than in samples B or A. An increase in cross-flows reduced the recovery of sample C and shifted the peaks slightly to the right
The difference in the various samples may stem from the cell culture process. It is important to note that sample C is very rare, occurring for ~10 % of B16 melanoma batch isolations. Even at 18 passages or greater, high yields of exosomes are usually obtained from rapidly growing B16 melanoma cells. However, sample C was included for scientific curiosity. Typically, the B16 melanoma cells adhere to their recommended rapid ATCC subcultivation instructions over many passages. However, if a given B16-F10 exosome batch such as sample C, which appears to coincide with cells having difficulty reaching 70 % confluence, is below typical yields (1.2 and 0.5 mg for samples A and B, respectively), fresh batch cultures are started. In this case, it was postulated that FFF could be used to better understand potential exosome heterogeneity by both detecting consistently within batches (samples A and B) and between batches (sample C versus A and B) as well.
Aside from the cell culture differences, another factor that affected exosome recovery was an increase of cross-flow (Fig. 6c). In these higher cross-flow tests, sample C was run using a focus period and cross-flow decline that began at 0.7 ml/min whereas samples A and B both used 0.5 ml/min. This decrease in area under the 90° MALS intensity curve indicates that a cross-flow increase decreases the relative recovery rate in AF4. For example, for sample C, the area at regular cross-flow was larger for a 20-μg injection than for a 30-μg injection at the higher cross-flow. Transmission electron micrographs of the collected first and second peaks from the stained samples are shown in Fig. 7. In the first peak for sample A, there were numerous round particles with apparent dimples and are likely exosomes. The second peak of sample A contained larger, more irregular particles, which likely correspond to a larger variety of exosome. The first peak of sample B showed aggregates of differentially stained particles. It is not clear at what point in the process this aggregation occurs. The second peak for sample B shows larger particles that stain similarly to the second peak of sample A.
Fig. 7.

TEM images of uranyl acetate stained exosome fractions on a carbon grid. a Sample A, 12–20 min, numerous round dimple or cup-like structures [8] shown with arrow; b sample A, 24–32 min, irregularly shaped heterogeneous mixture of large and small particles; c sample B, 12–20 min, aggregates of many small particles; d sample B, 24–32 min, irregularly shaped heterogeneous mixture of large and small particles
Discussion
The combination of flow FFF with the detectors and polystyrene standards proved valuable in analyzing the samples and demonstrated the efficacy of this technique. Samples A, B, and C, though harvested weeks apart, fractionated very similarly (Fig. 5), showing excellent agreement in both the peak positions, and radii determined using each individual evaluation technique: MALS, flow DLS, batch DLS. Analysis of the fractograms demonstrated nanovesicle sizes spanning a range of ~15–160 nm in radius for all detection methods. This range likely corresponds to smaller and larger exosome subtypes. The detected sizes (Fig. 4) are consistent with the size ranges reported previously for B16 melanoma exosomes [9].
When evaluated with MALS and flow DLS, the radii for the first peak region did not appear to be different for samples A, B, and C (Fig. 5); however, the UV detector had a significant signal in the first peak region for sample A (Fig. 3a), which was much smaller for sample B (Fig. 3b). This difference in the UV signal for the first peak region indicates a difference between samples A and B. Comparison of the TEM images for the fractions from first peak regions also showed stark contrast between the samples. It should be noted that samples A and B are different exosome samples harvested from the same B16-F10 mouse melanoma cell culture over time, so differences between the samples suggest that exosome production from a given cell line vary over time. AF4 could therefore be a valuable device to fractionate exosomes which could then further be characterized from a biological point of view for diagnostic and clinical applications. Reanalysis of the same samples after storage suggested that the particle size and relative numbers of particles at those sizes are stable over time.
One of the most surprising features of Figs. 4 and 5 is that the computed radii for the batch DLS and the flow DLS measurements differed so much, especially at higher elution times, as shown in Fig. 4 at 27 min. Since the DLS technique, sample, and light processing instrument are the same, it begs the question of why the computed radii would be different especially since fractionation should result in fairly homogeneous fractions. The lasers in the two machines are the same nominal wavelength, so this is not likely the reason. One explanation could be in the way that the data is processed. Since the flow mode is typically measured with cumulants and the batch mode with regularization, it could be that the differences are associated with the calculation method. Additionally, a larger acquisition time could make the batch measurement technique more sensitive to recording larger particles resulting in a higher measurement. It is also possible that (larger) contaminating particles could have entered the fluid during the collection stage as it exited the detectors before it was capped, again increasing the average radius. It should be noted that there is considerable general scatter in the data from each of the curves in Fig. 5, so there is some ambiguity in the data. In Fig. 5c, however, the batch DLS corresponds almost perfectly to the sphere-based computed MALS radius. While the DLS-based measurements and the MALS-based measurements do not need to agree, a strong correlation such as this suggests that the batch data may be correct and the flow radius measurement may be low. In conclusion, many different techniques were used to obtain measurements of exosomes, yet a comparison of each technique showed some discrepancies between the measured values of the radii. It is not surprising therefore that many different radii of exosomes are reported in the literature. The difference in the reported radii between all methods used highlights a need to have acceptable methods to reproducibly and reliably measure biological particles such as exosomes.
The Zimm method gives RMS radii equivalent to the radius of a hollow sphere model [53, 51], whereas the Zimm sphere approximation gives the radii equivalent to the hard sphere model. Since the internal contents of exosomes may vary from enclosing merely fluid or denser contents such as nucleic acids and proteins, it is not known which model best approximates exosomes of various sizes. It seems that the Zimm RMS radius is not correct for large particles because the method increases rapidly in radius when other methods do not show these rapid increases in size. At large sizes, the sphere approximation does follow both the exosome and the batch DLS data. At smaller size ranges, the Zimm RMS method better approximates the polystyrene spheres than does the geometric radius, which is interesting considering that the polystyrene particles are in fact solid spheres. For these reasons, it is not obvious which MALS approximation is best to use for small sizes. The MALS sphere method compared to the DLS data at small sizes indicates a very thin hydrated layer surrounding the exosome. However, the MALS Zimm method compared to the DLS data at small sizes indicates an ~15-nm hydrated layer surrounding the exosome.
The MALS and flow DLS reported radii data began to diverge from each other at radii greater than about 50 nm, but were consistent between samples A and B (Fig. 5). This divergence could be explained in part by shape anisotropy [54]. In a recent publication [55], significant differences in vesicle radii were calculated for both static light scattering (SLS) and DLS based on the effect of polydispersity and shape anisotropy. For example, relative to a sphere of equivalent surface area, one prolate vesicle (3:1 long axis-to-short axis ratio) had a hydrodynamic radius that was larger by 2.5 %, and the SLS radius was larger by 33 %. For comparison, in Fig. 4, at 27 min, both the Zimm-based or sphere-based MALS computed radius is ~50–60 % larger than the flow DLS computed radius. Considering this difference in radii to be primarily a result of the measurement method, it could be that exosomes that elute first at higher cross-flows are more spherical, while those eluting later at lower cross-flows are more asymmetrical, possibly prolate. Notwithstanding this explanation, there was no indication of rod-like structures in the second peak regions of the TEM micrographs. The difference in composition of the different microvesicle extracts could also explain the difference in shape and rigidity observed. Other shape anisotropies or polydispersity effects may cause a difference in radii which may be harder to distinguish on TEM.
While each of the individual (unclumped) exosomes of Fig. 7a is within the measured light scattering range of sizes, there is an initially apparent discrepancy that is between the light scattering data and the TEM images. In Fig. 5, the exosome radii from light scattering results suggest a good separation of particles by size, yet in Fig. 7a, the individual (unclumped) particles have a large distribution of sizes. The apparent discrepancy lies in that size information is poorly discerned with light scattering techniques on mixed sized populations. The TEM data is not however a contradiction since each sample measured with TEM is actually a pooled sample of different fractions. In principle, each size fraction had a size distribution resolved with light scattering techniques before it was pooled, concentrated, stained, and evaluated with TEM. Regarding the large aggregates, this probably occurred overnight post-fractionation, but prior to TEM analysis. Additionally, the concentration step with the spin column may have caused aggregation in exosomes. Because this is a pooled sample of discrete fractions, it does not contradict with the light scattering data by having a large size distribution.
Since the exosomes were not fixed with gluteraldehyde, morphological changes could occur in the samples prior to the TEM analysis. The use of a fixative agent or cryo-TEM will likely improve image quality of imaged fractions. Each image shows a degree of polydispersity including a range of particle sizes within the expected size range for both first and second peak exosome populations. Since the sizes present in the fractions are not completely monodisperse, these may contain co-eluting proteins [7] (not visible in Fig. 7) or artifacts of insufficient separation. With the exception of Fig. 7a, exosomes were not distinctly seen with a characteristic cup-shaped appearance. The present work attempted an unlabeled purely physical separation of exosomal components as a separation step for biological applications. Therefore, in future work, it is hoped to use an exosomal marker such as Melan A/MART-1 to be sure of the exosomal contents.
Another concern is sticking or degradation of the sample. Estimates obtained by integrating the UV signal suggest that only 30 % of the injected exosome sample emerged from the instrument. Sample C was run with a higher cross-flow rate than the other two sample types and had a 9 % recovery rate. Similar trends were seen between the relative recoveries of samples A and C from the 90° MALS intensity curve. The stronger the cross-flow driving exosomes closer to the membrane, the more likely they are to stick to the membrane and not be detected. It may be possible in the future to reduce the cross-flow further which would decrease the time required for recovery (i.e., decrease the retention time), use a different membrane type, or use a blocking agent on a membrane to increase recovery. Alternatively, exploring different dilution buffers might be of value. Recently, it was found that a trehalose-based buffer was able to minimize exosome aggregation following electroporation [15]. It could be that such a buffer might ameliorate exosome sticking to the separation membranes.
Both a large and small concentration of exosomes and between samples A, B, and C generally produce similarly shaped fractograms (Fig. 6) with similar radii measurements, suggesting that there is not a concentration-dependent bias in determining the radii from the samples tested. However, while the radii are consistent, dilution can negatively affect the scatter in the determination of the radius as well as the percent recovery. Dilution therefore may be reduced by reducing the retention time by reducing the cross-flow.
The percent recoveries calculated by integration of the UV signal were useful as an estimate of percent yield, but they were not as accurate as desired. For comparison, in using this same method to determine the total percent recovery of injected known concentrations of sample C with a zero cross-flow (where the expected recovery is 100 %), the obtained values over the useable range of the detector were less than 100 %, but varied from 20 to 90 % in 15 total measurements. It was, however, clear from the UV data that the percent recovery of all exosome types using cross-flows was reduced compared to zero cross-flow. One reason for the inaccuracy may be that the UV data was based on an attenuation coefficient (scatter plus absorbance) of the whole system of particles which may have underestimated the concentration of some particles and overestimated others due to differential scattering effects at 260 nm. Another reason for this percent recovery inaccuracy may be dilution. Dilution of the sample was often over a hundred fold at the peak heights as determined from exosome adsorption coefficients. This meant that even though a typical exosome sample was injected at a concentration that would saturate a UV detector, it was diluted down during the run to a concentration where much of the signal was difficult to detect. This leads to error propagation in integration of signals compounded by adsorption coefficient error. Decreasing dilution by decreasing cross-flow (decreased retention time) or quantifying exosome yield by another means such as measuring collected fractions offline with BCA absorbance may be a more accurate means of quantifying yield in the future; however, considering the dilution and loss of sample as indicated by UV, BCA absorbance may also have the same difficulty in determining the protein concentrations of the fractions.
Although exosomes may be separated by various methods, one common problem with all these methods is that it is still difficult to obtain large quantities of purified exosomes. Many of the current separation techniques are run in small batches, so large scale quantities could be achieved only by running multiple batches and pooling the obtained exosomes. This approach is inherently time-consuming and inefficient. In the future, scalable separation techniques that maintain exosome purity and allow non-affinity-based subfractionation are very desirable and may be possible through continuous flow splitting FFF designs.
Conclusion
Separation of exosomes by physical subtypes is useful prior to proteomic analysis, labeling, or genetic testing. FFF is one of the few techniques that has been able to separate exosomes by subtype without the use of highly specific affinity tags. Despite this great advantage, very little work has been done optimizing FFF to characterize and/or separate exosomes. In contrast to previous FFF exosome characterizations relying on detection of exosomes by protein absorbance, in the present study, AF4 was “hyphenated” or coupled with multiple detectors to perform a more physical characterization of the separated effluent. For the first time, exosomes from an aggressive melanoma cell line were fractionated using multi-detector A4F. Using batch DLS, MALS, and flow DLS, exosome size was determined and compared with eluted times of polystyrene standards. The results were consistent for several samples over time and for a range of sample concentrations. Samples A, B, and C that were collected several weeks apart from the same source cells were found to have both similar profiles and some slight differences suggesting an even higher level of complexity to the exosome production process than previously observed. MALS and DLS disagreed somewhat in radius measurement above about 50 nm which may indicate shape anisotropy differences of exosomes eluting at low and high cross-flows. While the size data from various detectors could not determine a difference between samples A and B, the UV signal did detect a difference in the first peak region corresponding to the smallest particles. Corresponding TEM images of the first peak fraction also revealed differences. Sample A contained dimpled circular vesicles (with minor clumping) whereas extensive clumping was observed for sample B. Our FFF approach resulted in label-free separation of exosomes into subfractions providing excellent detail from the detectors concerning exosome size and may one day allow for a continuous harvesting of exosomes in large quantities for applied clinical diagnostic or therapeutic treatment of cancer or other disease states.
Acknowledgments
This research was supported in part by the US National Science Foundation Division of Graduate Education under grant DGE-0903715 and in part by the National Institutes of Health under grant 1R21GM107894-01. We would also like to thank Michael J. Scott at C-TRAIN for assisting in exosome collections and shipments between C-TRAIN at Washington University and the University of Utah laboratories. Additional grant support for C-TRAIN investigators included the Elsa U. Pardee Foundation (J. L. Hood) and the National Institutes of Health R01HL073646-08 (S. A. Wickline).
Footnotes
Published in the topical collection Field- and Flow-based Separations with guest editors Gaetane Lespes, Catia Contado, and Bruce Gale.
Contributor Information
Kevin E. Petersen, Email: u0072538@utah.edu, Department of Mechanical Engineering, University of Utah, Salt Lake City, UT 84112, USA
Eliana Manangon, Department of Geology and Geophysics, University of Utah, Salt Lake City, UT 84112, USA.
Joshua L. Hood, Consortium for Translational Research in Advanced Imaging and Nanomedicine, School of Medicine, Washington University, St. Louis, MO 63110, USA
Samuel A. Wickline, Consortium for Translational Research in Advanced Imaging and Nanomedicine, School of Medicine, Washington University, St. Louis, MO 63110, USA
Diego P. Fernandez, Department of Geology and Geophysics, University of Utah, Salt Lake City, UT 84112, USA
William P. Johnson, Department of Geology and Geophysics, University of Utah, Salt Lake City, UT 84112, USA
Bruce K. Gale, Department of Mechanical Engineering, University of Utah, Salt Lake City, UT 84112, USA
References
- 1.Schorey JS, Bhatnagar S. Exosome function: from tumor immunology to pathogen biology. Traffic (Copenhagen, Denmark) 2008;9(6):871–881. doi: 10.1111/j.1600-0854.2008.00734.x. [DOI] [PMC free article] [PubMed] [Google Scholar]
- 2.Hood JL, Wickline SA. A systematic approach to exosome-based translational nanomedicine. Wiley Interdiscip Rev Nanomed Nanobiotechnol. 2012;4(4):458–467. doi: 10.1002/wnan.1174. [DOI] [PubMed] [Google Scholar]
- 3.D’Souza-Schorey C, Clancy JW. Tumor-derived microvesicles: shedding light on novel microenvironment modulators and prospective cancer biomarkers. Genes Dev. 2012;26(12):1287–1299. doi: 10.1101/gad.192351.112. [DOI] [PMC free article] [PubMed] [Google Scholar]
- 4.Thery C, Ostrowski M, Segura E. Membrane vesicles as conveyors of immune responses. Nat Rev Immunol. 2009;9(8):581–593. doi: 10.1038/nri2567. [DOI] [PubMed] [Google Scholar]
- 5.Peinado H, Aleckovic M, Lavotshkin S, Matei I, Costa-Silva B, Moreno-Bueno G, Hergueta-Redondo M, Williams C, Garcia-Santos G, Ghajar C, Nitadori-Hoshino A, Hoffman C, Badal K, Garcia BA, Callahan MK, Yuan J, Martins VR, Skog J, Kaplan RN, Brady MS, Wolchok JD, Chapman PB, Kang Y, Bromberg J, Lyden D. Melanoma exosomes educate bone marrow progenitor cells toward a pro-metastatic phenotype through MET. Nat Med. 2012;18(6):883–891. doi: 10.1038/nm.2753. [DOI] [PMC free article] [PubMed] [Google Scholar]
- 6.Sokolova V, Ludwig AK, Hornung S, Rotan O, Horn PA, Epple M, Giebel B. Characterisation of exosomes derived from human cells by nanoparticle tracking analysis and scanning electron microscopy. Colloids Surf B Biointerfaces. 2011;87(1):146–150. doi: 10.1016/j.colsurfb.2011.05.013. [DOI] [PubMed] [Google Scholar]
- 7.Gyorgy B, Szabo TG, Pasztoi M, Pal Z, Misjak P, Aradi B, Laszlo V, Pallinger E, Pap E, Kittel A, Nagy G, Falus A, Buzas EI. Membrane vesicles, current state-of-the-art: emerging role of extracellular vesicles. Cell Mol Life Sci: CMLS. 2011;68(16):2667–2688. doi: 10.1007/s00018-011-0689-3. [DOI] [PMC free article] [PubMed] [Google Scholar]
- 8.van der Pol E, Boing AN, Harrison P, Sturk A, Nieuwland R. Classification, functions, and clinical relevance of extracellular vesicles. Pharmacol Rev. 2012;64(3):676–705. doi: 10.1124/pr.112.005983. [DOI] [PubMed] [Google Scholar]
- 9.Hood JL, Pan H, Lanza GM, Wickline SA. Paracrine induction of endothelium by tumor exosomes. Lab Investig; J Technical Methods and Pathology. 2009;89(11):1317–1328. doi: 10.1038/labinvest.2009.94. [DOI] [PMC free article] [PubMed] [Google Scholar]
- 10.Weitz DA. [Accessed 24 Apr 2014];Dynamic Light Scattering (QLS, PCS) http://weitzlab.seas.harvard.edu/links/tutorials/dynamiclightscattering.pdf.
- 11.Bobrie A, Colombo M, Raposo G, Thery C. Exosome secretion: molecular mechanisms and roles in immune responses. Traffic (Copenhagen, Denmark) 2011;12(12):1659–1668. doi: 10.1111/j.1600-0854.2011.01225.x. [DOI] [PubMed] [Google Scholar]
- 12.van der Pol E, Hoekstra AG, Sturk A, Otto C, van Leeuwen TG, Nieuwland R. Optical and non-optical methods for detection and characterization of microparticles and exosomes. J Thromb Haemost : JTH. 2010;8(12):2596–2607. doi: 10.1111/j.1538-7836.2010.04074.x. [DOI] [PubMed] [Google Scholar]
- 13.Hood JL, San RS, Wickline SA. Exosomes released by melanoma cells prepare sentinel lymph nodes for tumor metastasis. Cancer Res. 2011;71(11):3792–3801. doi: 10.1158/0008-5472.can-10-4455. [DOI] [PubMed] [Google Scholar]
- 14.Müller G. Novel tools for the study of cell type-specific exosomes and microvesicles. J Bioanal Biomed. 2012;4(4):46–60. doi: 10.4172/1948-593X.1000063. [DOI] [Google Scholar]
- 15.Hood JL, Scott MJ, Wickline SA. Maximizing exosome colloidal stability following electroporation. Anal Biochem. 2013;448C:41–49. doi: 10.1016/j.ab.2013.12.001. [DOI] [PMC free article] [PubMed] [Google Scholar]
- 16.Pan BT, Johnstone RM. Fate of the transferrin receptor during maturation of sheep reticulocytes in vitro: selective externalization of the receptor. Cell. 1983;33(3):967–978. doi: 10.1016/0092-8674(83)90040-5. [DOI] [PubMed] [Google Scholar]
- 17.Carayon K, Chaoui K, Ronzier E, Lazar I, Bertrand-Michel J, Roques V, Balor S, Terce F, Lopez A, Salome L, Joly E. Proteolipidic composition of exosomes changes during reticulocyte maturation. J Biol Chem. 2011;286(39):34426–34439. doi: 10.1074/jbc.M111.257444. [DOI] [PMC free article] [PubMed] [Google Scholar]
- 18.Al-Nedawi K, Meehan B, Micallef J, Lhotak V, May L, Guha A, Rak J. Intercellular transfer of the oncogenic receptor EGFRvIII by microvesicles derived from tumour cells. Nat Cell Biol. 2008;10(5):619–624. doi: 10.1038/ncb1725. [DOI] [PubMed] [Google Scholar]
- 19.Skog J, Wurdinger T, van Rijn S, Meijer DH, Gainche L, Sena-Esteves M, Curry WT, Jr, Carter BS, Krichevsky AM, Breakefield XO. Glioblastoma microvesicles transport RNA and proteins that promote tumour growth and provide diagnostic biomarkers. Nat Cell Biol. 2008;10(12):1470–1476. doi: 10.1038/ncb1800. [DOI] [PMC free article] [PubMed] [Google Scholar]
- 20.Safaei R, Larson BJ, Cheng TC, Gibson MA, Otani S, Naerdemann W, Howell SB. Abnormal lysosomal trafficking and enhanced exosomal export of cisplatin in drug-resistant human ovarian carcinoma cells. Mol Cancer Ther. 2005;4(10):1595–1604. doi: 10.1158/1535-7163.mct-05-0102. [DOI] [PubMed] [Google Scholar]
- 21.Mathivanan S, Simpson RJ. ExoCarta: a compendium of exosomal proteins and RNA. Proteomics. 2009;9(21):4997–5000. doi: 10.1002/pmic.200900351. [DOI] [PubMed] [Google Scholar]
- 22.Mathivanan S, Fahner CJ, Reid GE, Simpson RJ. ExoCarta 2012: database of exosomal proteins, RNA and lipids. Nucleic Acids Res. 2012;40(Database issue):D1241–D1244. doi: 10.1093/nar/gkr828. [DOI] [PMC free article] [PubMed] [Google Scholar]
- 23.Kalra H, Simpson RJ, Ji H, Aikawa E, Altevogt P, Askenase P, Bond VC, Borras FE, Breakefield X, Budnik V, Buzas E, Camussi G, Clayton A, Cocucci E, Falcon-Perez JM, Gabrielsson S, Gho YS, Gupta D, Harsha HC, Hendrix A, Hill AF, Inal JM, Jenster G, Kramer-Albers EM, Lim SK, Llorente A, Lotvall J, Marcilla A, Mincheva-Nilsson L, Nazarenko I, Nieuwland R, Nolte-’t Hoen EN, Pandey A, Patel T, Piper MG, Pluchino S, Prasad TS, Rajendran L, Raposo G, Record M, Reid GE, Sanchez-Madrid F, Schiffelers RM, Siljander P, Stensballe A, Stoorvogel W, Taylor D, Thery C, Valadi H, van Balkom BW, Vazquez J, Vidal M, Wauben MH, Yanez-Mo M, Zoeller M, Mathivanan S. Vesiclepedia: a compendium for extracellular vesicles with continuous community annotation. PLoS Biol. 2012;10(12):e1001450. doi: 10.1371/journal.pbio.1001450. [DOI] [PMC free article] [PubMed] [Google Scholar]
- 24.Thery C, Amigorena S, Raposo G, Clayton A. Isolation and characterization of exosomes from cell culture supernatants and biological fluids. In: Bonifacino Juan S, et al., editors. Current protocols in cell biology. Unit 3.22. Chapter 3. 2006. [DOI] [PubMed] [Google Scholar]
- 25.Taylor D, Zacharias W, Gercel-Taylor C. Exosome Isolation for Proteomic Analyses and RNA Profiling. In: Simpson RJ, Greening DW (eds) Serum/Plasma Proteomics, vol 728. Methods in Molecular Biology. Humana. 2011:235–246. doi: 10.1007/978-1-61779-068-3_15. [DOI] [PubMed] [Google Scholar]
- 26.Chen C, Skog J, Hsu CH, Lessard RT, Balaj L, Wurdinger T, Carter BS, Breakefield XO, Toner M, Irimia D. Microfluidic isolation and transcriptome analysis of serum microvesicles. Lab Chip. 2010;10(4):505–511. doi: 10.1039/b916199f. [DOI] [PMC free article] [PubMed] [Google Scholar]
- 27.Raj DAA, Fiume I, Capasso G, Pocsfalvi G. Urinary exosomes for protein biomarker research. In: Man TK Prof, editor. Proteomics—human diseases and protein functions. In Tech; 2012. pp. 49–64. [Google Scholar]
- 28.Lesieur S, Grabielle-Madelmont C, Paternostre M, Ollivon M. Study of size distribution and stability of liposomes by high performance gel exclusion chromatography. Chem Phys Lipids. 1993;64(1):57–82. [Google Scholar]
- 29.Ruysschaert T, Marque A, Duteyrat JL, Lesieur S, Winterhalter M, Fournier D. Liposome retention in size exclusion chromatography. BMC Biotechnol. 2005;5:11. doi: 10.1186/1472-6750-5-11. [DOI] [PMC free article] [PubMed] [Google Scholar]
- 30.Ingebrigtsen L, Brandl M. Determination of the size distribution of liposomes by SEC fractionation, and PCS analysis and enzymatic assay of lipid content. AAPS PharmSciTech. 2002;3(2):E7. doi: 10.1208/pt030207. [DOI] [PMC free article] [PubMed] [Google Scholar]
- 31.Lai RC, Arslan F, Lee MM, Sze NS, Choo A, Chen TS, Salto-Tellez M, Timmers L, Lee CN, El Oakley RM, Pasterkamp G, de Kleijn DP, Lim SK. Exosome secreted by MSC reduces myocardial ischemia/reperfusion injury. Stem Cell Res. 2010;4(3):214–222. doi: 10.1016/j.scr.2009.12.003. [DOI] [PubMed] [Google Scholar]
- 32.Oshima K, Aoki N, Kato T, Kitajima K, Matsuda T. Secretion of a peripheral membrane protein, MFG-E8, as a complex with membrane vesicles. Eur J Biochem FEBS. 2002;269(4):1209–1218. doi: 10.1046/j.1432-1033.2002.02758.x. [DOI] [PubMed] [Google Scholar]
- 33.Chen TS, Arslan F, Yin Y, Tan SS, Lai RC, Choo AB, Padmanabhan J, Lee CN, de Kleijn DP, Lim SK. Enabling a robust scalable manufacturing process for therapeutic exosomes through oncogenic immortalization of human ESC-derived MSCs. J Transl Med. 2011;9:47. doi: 10.1186/1479-5876-9-47. [DOI] [PMC free article] [PubMed] [Google Scholar]
- 34.Rekker K, Saare M, Roost AM, Kubo AL, Zarovni N, Chiesi A, Salumets A, Peters M. Comparison of serum exosome isolation methods for microRNA profiling. Clin Biochem. 2014;47(1–2):135–138. doi: 10.1016/j.clinbiochem.2013.10.020. [DOI] [PubMed] [Google Scholar]
- 35.Yamada T, Inoshima Y, Matsuda T, Ishiguro N. Comparison of methods for isolating exosomes from bovine milk. J Vet Med Sci/// Japanese Society of Veterinary Science. 2012;74(11):1523–1525. doi: 10.1292/jvms.12-0032. [DOI] [PubMed] [Google Scholar]
- 36.Cheruvanky A, Zhou H, Pisitkun T, Kopp JB, Knepper MA, Yuen PS, Star RA. Rapid isolation of urinary exosomal biomarkers using a nanomembrane ultrafiltration concentrator. Am J Physiol Renal Physiol. 2007;292(5):F1657–F1661. doi: 10.1152/ajprenal.00434.2006. [DOI] [PMC free article] [PubMed] [Google Scholar]
- 37.Merchant ML, Powell DW, Wilkey DW, Cummins TD, Deegens JK, Rood IM, McAfee KJ, Fleischer C, Klein E, Klein JB. Microfiltration isolation of human urinary exosomes for characterization by MS. Proteomics Clin Appl. 2010;4(1):84–96. doi: 10.1002/prca.200800093. [DOI] [PubMed] [Google Scholar]
- 38.Oh S, Kang D, Ahn SM, Simpson RJ, Lee BH, Moon MH. Miniaturized asymmetrical flow field-flow fractionation: application to biological vesicles. J Sep Sci. 2007;30(7):1082–1087. doi: 10.1002/jssc.200600394. [DOI] [PubMed] [Google Scholar]
- 39.Kang D, Oh S, Ahn S-M, Lee B-H, Moon MH. Proteomic analysis of exosomes from human neural stem cells by flow field-flow fractionation and nanoflow liquid chromatography-tandem mass spectrometry. J Proteome Res. 2008;7(8):3475–3480. doi: 10.1021/pr800225z. [DOI] [PubMed] [Google Scholar]
- 40.Lasser C, Eldh M, Lotvall J. Isolation and characterization of RNA-containing exosomes. J Visualized Experiments : JoVE. 2012;59:e3037. doi: 10.3791/3037. [DOI] [PMC free article] [PubMed] [Google Scholar]
- 41.Valadi H, Ekstrom K, Bossios A, Sjostrand M, Lee JJ, Lotvall JO. Exosome-mediated transfer of mRNAs and microRNAs is a novel mechanism of genetic exchange between cells. Nat Cell Biol. 2007;9(6):654–659. doi: 10.1038/ncb1596. [DOI] [PubMed] [Google Scholar]
- 42.Jorgensen M, Baek R, Pedersen S, Sondergaard EK, Kristensen SR, Varming K. Extracellular Vesicle (EV) Array: microarray capturing of exosomes and other extracellular vesicles for multiplexed phenotyping. J Extracellular Vesicles. 2013;2 doi: 10.3402/jev.v2i0.20920. [DOI] [PMC free article] [PubMed] [Google Scholar]
- 43.Tauro BJ, Greening DW, Mathias RA, Ji H, Mathivanan S, Scott AM, Simpson RJ. Comparison of ultracentrifugation, density gradient separation, and immunoaffinity capture methods for isolating human colon cancer cell line LIM1863-derived exosomes. Methods (San Diego, Calif) 2012;56(2):293–304. doi: 10.1016/j.ymeth.2012.01.002. [DOI] [PubMed] [Google Scholar]
- 44.Wahlund KG, Giddings JC. Properties of an asymmetrical flow field-flow fractionation channel having one permeable wall. Anal Chem. 1987;59(9):1332–1339. doi: 10.1021/ac00136a016. [DOI] [PubMed] [Google Scholar]
- 45.Qureshi RN, Kok WT. Application of flow field-flow fractionation for the characterization of macromolecules of biological interest: a review. Anal Bioanal Chem. 2011;399(4):1401–1411. doi: 10.1007/s00216-010-4278-3. [DOI] [PMC free article] [PubMed] [Google Scholar]
- 46.Korgel BA, van Zanten JH, Monbouquette HG. Vesicle size distributions measured by flow field-flow fractionation coupled with multiangle light scattering. Biophys J. 1998;74(6):3264–3272. doi: 10.1016/s0006-3495(98)78033-6. [DOI] [PMC free article] [PubMed] [Google Scholar]
- 47.Paulaitis M, Guzman N, Agarwal K, Saji M. Poster Session 3—tumor cell and molecular biology: MicroRNAs Abstract P3-09-04: exosome-specific microRNA signatures in combination with characteristic surface markers on the circulating exosomes themselves provide new insights in the EMT. Cancer Res. 2010;70(24) doi: 10.1158/0008-5472.SABCS10-P3-09-04. [DOI] [Google Scholar]
- 48.Roda B, Zattoni A, Reschiglian P, Moon MH, Mirasoli M, Michelini E, Roda A. Field-flow fractionation in bioanalysis: a review of recent trends. Anal Chim Acta. 2009;635(2):132–143. doi: 10.1016/j.aca.2009.01.015. [DOI] [PubMed] [Google Scholar]
- 49.Mitrus I, Bryndza E, Kazura M, Smagur A, Sochanik A, Cichon T, Szala S. Properties of B16-F10 murine melanoma cells subjected to metabolic stress conditions. Acta Biochim Pol. 2012;59(3):363–366. [PubMed] [Google Scholar]
- 50.Wyatt Technology Corporation. DYNAMICS User’s Guide Version 7.1 (M1400 Rev. K) 2010. p. Ch8-8. Appendix A. [Google Scholar]
- 51.Wyatt Technology Corporation. Astra V User’s Guide. 2008. Version 5.3.4 (M1000 Rev. H) Appendix D-F. [Google Scholar]
- 52.Belnap D. [Accessed 13 Nov 2013];Negative Stain Procedure. 2013 http://www.cores.utah.edu/wp-content/uploads/2013/06/negative-stain.pdf.
- 53.Wyatt Technology Corporation. Introduction to light scattering. Light Scattering University; Santa Barbara California: 2011. [Google Scholar]
- 54.Pencer J, White GF, Hallett FR. Osmotically induced shape changes of large unilamellar vesicles measured by dynamic light scattering. Biophys J. 2001;81(5):2716–2728. doi: 10.1016/s0006-3495(01)75914-0. [DOI] [PMC free article] [PubMed] [Google Scholar]
- 55.Pencer J, Hallett FR. Effects of vesicle size and shape on static and dynamic light scattering measurements. Langmuir. 2003;19(18):7488–7497. doi: 10.1021/la0345439. [DOI] [Google Scholar]