

Abstract
Purpose
To investigate the utility of diffusion tensor tractography at 1mm slice thickness to map and quantify the whole trajectory of different cortico-ponto-cerebellar pathways of the healthy adult human brain.
Materials and Methods
This work was approved by the local Institutional Review Board, and was Health Insurance Portability and Accountability Act (HIPAA) compliant. Five healthy right-handed men (age range, 24–37 years) were studied and written informed consent was obtained. Diffusion tensor imaging data acquired with 1-mm slice thickness at a 3.0 Tesla (T) clinical MRI scanner were prepared and analyzed using tractography methods to reconstruct the cortico-ponto-cerebellar pathways which included the fronto-ponto-cerebellar, parieto-ponto-cerebellar, occipitoponto- cerebellar, and temporo-ponto-cerebellar tracts.
Results
We demonstrate the feasibility of tractographic mapping and quantification of the four cortico-ponto-cerebellar system components based on their cortical connections in the healthy human brain using DTI data with thin 1-mm sections.
Conclusion
In vivo quantification of different corticoponto-cerebellar pathways based on cortical connection is feasible, using 1-mm slices at 3.0T.
Keywords: diffusion tensor imaging, tractography, thin slices, cortico-ponto-cerebellar pathways
THE CORTICO-PONTO-CEREBELLAR (CPC) white matter fibers are the largest component of the corticofugal fiber system of the human brain central nervous system and form the largest group of fibers in the basis pontis (1). The CPC fibers consist of two neuron chains: cortico-pontine fibers which project to the pontine nuclei and ponto-cerebellar fibers which cross the midline to enter the cerebellum by means of the middle cerebellar peduncle (2). The CPC pathways are the major input of the cerebellum from the cerebral cortex that link different cortical areas with the cerebellum for the coordination and regulation of movement (1). These fibers originate from motor and nonmotor (associative and limbic) areas of the cerebral cortex (1). Almost all of these fibers cross the midline in the basal pons and terminate in the contralateral half of the cerebellum (2).
Several previous diffusion tensor imaging (DTI) studies used voxel-based morphometry or two-dimensional (2D) region-of-interest (ROI) analyses to study ponto-cerebellar tract in patients with adult-onset ataxic neurodegenerative diseases (3,4), multiple system atrophy (5,6), pure cerebellar syndrome (7), Parkinsonian syndromes (8), attention-deficit hyperactivity disorder (9), and traumatic brain injury (10). The location and size of ROIs were not clearly defined in some of the previous studies (6,7).
One advantage of three-dimensional (3D) fiber tract reconstruction over 2D-ROI placement in DTI studies is the ability to show better the integrity of the fiber tract trajectory or interruption by lesions (11). Challenges of ROI-based diffusion tensor imaging studies also include partial volume contamination with adjacent pathways due to the selection of size and location of ROIs (12). One way of raising the confidence level of validity is by using multiple ROIs based on anatomical landmarks using 3D DTI-based fiber tractography (11). The availability of high spatial resolution (in-plane and throughplane) 3D tractography combined with using clear anatomical landmarks would help resolve these problems.
The purpose of the current study is to demonstrate the feasibility of parcellation of the whole trajectories as well as showing the crossings of four different CPC pathways as well as the ability to quantify the diffusion tensor metrics and volume of these fibers using fiber tractography and DTI data acquired with thin 1mm slices at 3.0 Tesla (T).
MATERIALS AND METHODS
Study Subjects
This prospective study was approved by our Institutional Review Board (IRB) and was Health Insurance Portability and Accountability Act (HIPAA) compliant. Five right-handed healthy men (age range, 24–37 years) were included in this study and written informed consent was obtained from all the subjects.
Conventional MRI Data Acquisition
All MRI studies were performed at a 3.0T Philips Intera scanner with a dual quasar gradient system with a maximum gradient amplitude of 80 mT m−1, maximum slew rate 200 mT ms−1 m−1, and an eight channel SENSE-compatible head coil (Philips Medical Systems, Best, Netherlands). The conventional MRI (cMRI) protocol included axially prescribed 3D spoiled gradient (repetition time /echo time/ flip angle = TR / TE / α = 8ms / 4 ms/6°), 3D proton density-weighted (TR/TE/α = 10,000 ms/10 ms/90° and 3-D T2-weighted (TR/TE/α = 10,000 ms/60 ms/90°), with a square field-of-view (FOV) = 256 mm × 256 mm and a matrix of 256 × 256 pixels. The slice thickness for the cMRI sequences was 1.0 mm with 120 contiguous axial slices covering the entire brain (foramen magnum to vertex).
DTI Data Acquisition
Diffusion-weighted image (DWI) data were acquired axially from the same graphically prescribed cMRI volumes using a single-shot multi-slice 2D spin-echo diffusion sensitized and fat-suppressed echo planar imaging (EPI) sequence, with the balanced Icosa21 tensor encoding scheme (13,14). The high resolution DTI acquisition protocol properties and applications are detailed elsewhere (15). The spatial coverage for DTI data matched the 3D cMRI spatial coverage (FOV = 256 mm × 256 mm and slice thickness / gap / #slices = 1 mm / 0 mm / 120). The EPI phase encoding used a SENSE k-space undersampling factor of two, with an effective k-space matrix of 112 × 112 and an image matrix after zero-filling in k-space of 256 × 256. The acquisition spatial resolution for DTI data was ~2.29 mm × 2.29 mm × 1 mm, and the nominal resolution after k-space image construction was 1mm × 1 mm × 1 mm.
The number of b-factor ~0 (b0) magnitude image averages was four. The total DTI acquisition time was ~7 min for the diffusion-weighted acquisition. The DTI acquisition was repeated three times to enhance signal-to-noise ratio (SNR). The selection of acquisition parameters such as b-factor (500 s mm−2), parallel imaging (R = 2.0), TR (~14.5 s) and TE (~60 ms) enabled entire brain coverage (120 axial 1-mm sections) using single-shot and interleaved EPI. The thin slice acquisition in space and replication of data in time combined with the DTI encoding provided several quality control options to study signal-to-noise ratio and partial volume effects on the DTI tracking results (15).
White Matter Fiber Tracking
After data preparation and quality assessment, compact fiber tracking was performed using DTI Studio software (Johns Hopkins University, Baltimore, MD; http://cmrm.med.jhmi.edu/). Fiber tracking was based on the fiber assignment by continuous tracking (FACT) algorithm with a fractional anisotropy (FA) threshold of 0.22 and angle threshold of 60 degrees (16). Reproducibility of the fiber construction in both hemispheres was tested by two experienced raters (first and last authors) on all subjects. Multiple ROIs were used to track the white matter pathways of interest. Once a fiber tract was reconstructed, the entire trajectory was verified on a slice-by-slice basis to compare with established anatomical landmarks described in atlases of human brain neuroanatomy (17).
White Matter Fiber Tracts
Cortico-Ponto-Cerebellar Tract
The cortico-ponto-cerebellar (CPC) tract arises from a wide area of the cerebral cortex. On DTI images, the CPCT was divided into four portions which were tracked based on cortical connection as fronto-ponto-cerebellar (FPC) tract, parieto-ponto-cerebellar (PPC) tract, occipitoponto-cerebellar (OPC) tract, and temporo-pontocerebellar (TPC) tract. The corticospinal tract (CST) was also tracked to show the position of different CPC pathways in relation to the CST in axial brain sections. Three axial ROIs were selected to obtain CST (Fig. 1e). Two ROIs (two axial levels or one axial and one coronal slices) were applied to obtain CPC pathways and an “AND” operation was performed to include the fibers passing through the two ROIs. The exact locations of the ROIs selected for each pathway are shown in Figure 1.
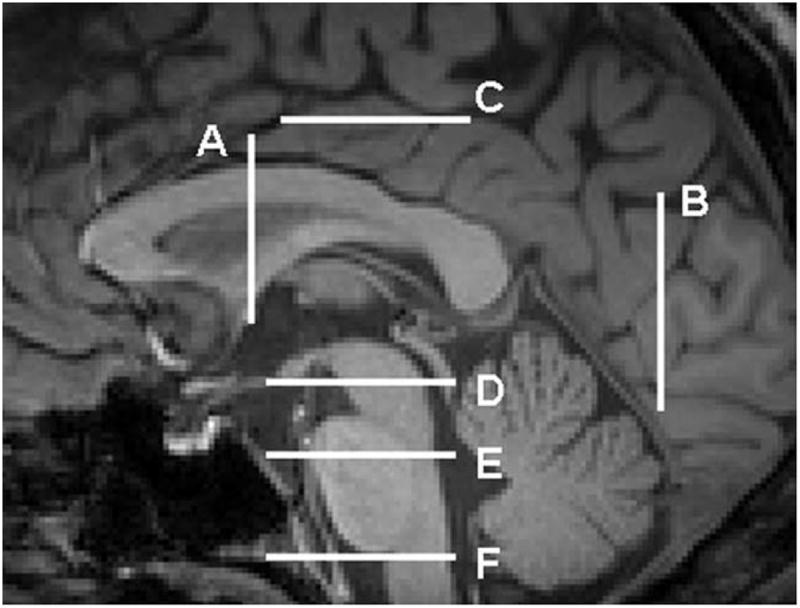
Figure 1.

ROI locations (ROI 1 and 2) used for reconstructions of the four cortico-ponto-cerebellar and corticospinal tracts. a: Fronto-ponto-cerebellar tract. b: Parieto-ponto-cerebellar tract. c: Occipito-ponto-cerebellar tract. d: Temporo-ponto-cerebellar tract. e: Corticospinal tract. The ROIs are depicted by shapes outlined in pink, which yielded a tract reconstruction in yellow color on a DTI principal vector coded map (red = right–left; green = anterior–posterior; blue = superior–inferior). In a, the ROI 1 was placed on the whole lateral segment of the crus cerebri at the lowest axial level in which the red nuclei are visible on the T2-weighted map (level D in Fig. 2) and ROI 2 was seeded on the fibers generated in the whole anterior limb of internal capsule (level A in Fig. 2). In b, ROI 1 was used on the cortical areas posterior to the precentral sulcus and anterior to the parieto-occipital sulcus (level C in Fig. 2), and ROI 2 was placed on the fibers generated in the lateral portion of the crus cerebri at the level D in Figure 2. A not operation was also done to remove part of the CST whichmay have been included with the PPC. In c, ROI 1 was used on the posterior one-third portion (dorso-lateral portion) of the cerebral peduncle (level D in Fig. 2) and ROI 2 was selected on the fibers generated in the occipital cortex at the axial level which is passing through the posteriormost of the cerebellum (level B in Fig. 2). A not operation was also done to remove part of the CST which might have been included with the OPC. In d, ROI 1 was seeded on the posterior one-third portion (dorso-lateral portion) of the cerebral peduncle (the same as ROI1 in Fig. 1c) and ROI 2 was placed at the same axial level on the fibers generated posterior to the uncinate fasciculus. In e, ROI locations (ROI 1 and 2 and 3) used for reconstruction of corticospinal tract. ROI 1 was located on the entire upper Medulla Oblongata (level F in Fig. 2), The second ROI was seeded on the basis pontis (level E in Fig. 2), and the third ROI was placed on the trajectories generated in the primary motor cortex ventral to the central sulcus. Anatomical landmarks are labeled as follows: AC = anterior commissure; UF = uncinate fasciculus. [Color figure can be viewed in the online issue, which is available at wileyonlinelibrary.com.]
Some “NOT” operations were also used (Fig. 1b,c) to exclude fibers on the axial slice corresponding to the level F in Figure 2. The corresponding axial and coronal levels on a midsagittal T1-weighted image for different ROIs are also illustrated in Figure 2. Some trajectories outside the two ROIs may cross themidline by means of the pontine crossing fibers and re-enter the contralateral hemisphere. These fibers were removed by using the “NOT” operation across the other side on the axial slices.
Figure 2.
Structural (T1-weighted) MRI of the sagittal midline plane showing the different coronal and axial sections which was used for ROI placement in Figure 1. A: The coronal slice in which anterior commissure is visible. B: The coronal slice which passes through the most posterior portion of the cerebellum in the midsagittal slice. C: The axial level corresponding to the cingulate sulcus in the midsagittal cut. D: The lowest axial level in which the red nuclei are visible on the T2-weighted map. E: The intersection of superior and middle one-third portions of the pons. F: The axial level passing through the upper medulla oblongata.
In our segmentation, we included the CPC fibers originating from parts of the frontal cortex such as premotor and primary motor areas with the CPC pathways originating from the parietal cortex. The reason for this is that the CPC pathways initiating from the premotor and primary motor areas (blue fibers in Fig. 3b) are descending side by side with the parietal CPC fibers passing through the posterior limb of internal capsule. However, the CPC pathways originating from the prefrontal cortex (frontal cortices anterior to the precentral sulcus; the red fibers in Fig. 3a) are descending through the genu and the anterior limb of internal capsule (ALIC) (18). Thus, we applied an ROI on the ALIC to obtain the FPC and an ROI on the cortical areas between the precentral sulcus and parietooccipital sulcus to obtain the PPC fibers (Fig. 1a,b).
Figure 3.

The reconstructed tracts, overlaid on a 3D T1- weighted lateral (left images) and postero-lateral view (right images). a: Fronto-ponto-cerebellar tract. b: Parieto-pontocerebellar tract. Blue fibers are originating from the more anterior portions of the parietal cortex and cross at upper axial levels of the pons in comparison to yellow fibers which are originating from the more posterior parietal cortex and cross in lower pontine levels. c: Occipito-ponto-cerebellar tract. d: Temporo-ponto-cerebellar tract.
RESULTS
Tractogram
The tractograms of fronto-ponto-cerebellar, parietoponto-cerebellar, occipito-ponto-cerebellar, and temporo-ponto-cerebellar tracts in the five subjects studied had comparable architecture. All tracts were defined on axial sections at the levels illustrated in Figure 4. The anatomical parcellation of the four groups of the CPC pathways are shown in multiple axial cuts (Figs. 5-7) along the long axis of the brain indicated in Figure 4.
Figure 4.
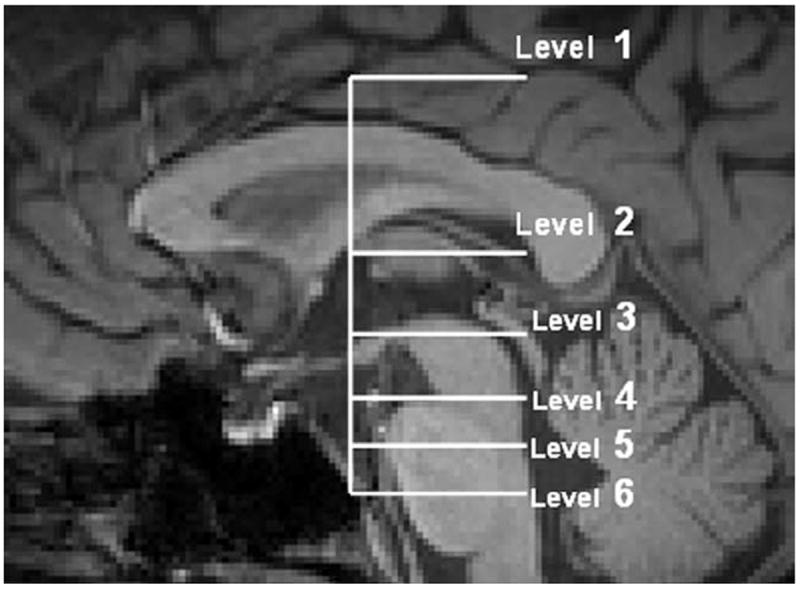
Structural (T1-weighted) MRI of the sagittal midline plane showing the different axial sections of the brain which CPC pathways are mapped in the following images. Telencephalon (level 1) at the axial level corresponding to the cingulate sulcus. Diencephalon (level 2) at the axial level which the maximum length of putamen is visible. Mesencephalon (level 3) at mesencephalo-diencephalic level which corresponds to the axial level that is passing through the superior margin of mamillary body on midsagittal plane. Mesencephalon (level 4) at the lowest mesencephalon. Pons (levels 5, 6) at the intersection of superior and middle one third (level 5) and middle and inferior one-third (level 6) portions of the pons at the midsagittal plane.
Figure 5.

Transverse DTI color-coded map and concordant T2-weighted MR images for mapping the fronto-ponto-cerebellar (red), parieto-ponto-cerebellar (yellow), occipito-ponto-cerebellar (Green), temporo-ponto-cerebellar (orange), and corticospinal tract (pink). a: View at the axial level corresponding to the cingulate sulcus (Corresponds to the level 1 in Fig. 4). b: View at the diencephalon at the axial level which the most length of putamen is visible (corresponds to the level 2 in Fig. 4). The white arrow shows the prefrontal cortical connections of FP tract (c) view at the mesencephalo-diencephalic level (Corresponds to the level 3 in Fig. 4). The lateral portion of orange fibers are the ascending part of temporo-pontine tract which turns to the descending branch at this level and descend in dorsal cerebral peduncle (the medial portion of orange fibers). Well delineated anatomic landmarks are labeled as follows: CST = Corticospinal tract; LN = lentiform nucleus; RN = red nucleus; SN = substantia nigra; Th = thalamus; V = vermis of cerebellum. [Color figure can be viewed in the online issue, which is available at wileyonlinelibrary.com.]
Figure 7.
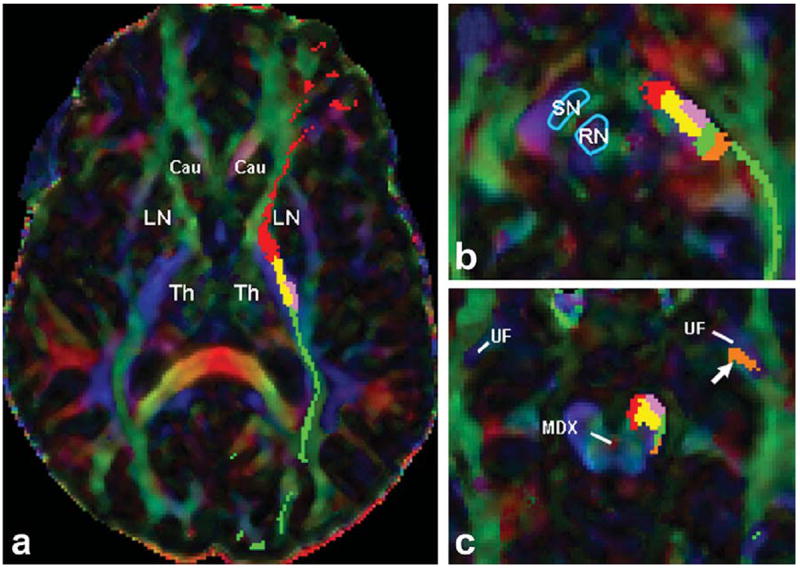
Transverse DTI color-coded map images for mapping the fronto-ponto-cerebellar (red), parieto-ponto-cerebellar (yellow), occipito-ponto-cerebellar (green), temporo-ponto-cerebellar (orange), and the corticospinal tract (pink) in one of the subjects which the CST is passing from the lateral side of the parieto-ponto-cerebellar tract. a: View at the diencephalon at the axial level which the most length of putamen is visible (corresponds to the level 2 in Fig. 4). b: View at the mesencephalodiencephalic level (Corresponds to the level 3 in Fig. 4). c: View at the axial level of mesencephalic decussation (MDX) at lowest mesencephalon (corresponds to the level 4 in Fig. 4). The white arrow is pointing at the ascending fibers of the TPC which are passing dorsally to the uncinate fasciculus (UF) fibers. Well delineated anatomic landmarks are labeled as follows: LN = lentiform nucleus; MDX = mesencephalic decussation; RN = red nucleus; SN = substantia nigra; Th = thalamus; UF = uncinate fasciculus. [Color figure can be viewed in the online issue, which is available at wileyonlinelibrary.com.]
Fronto-Ponto-Cerebellar Tract
The FPC tract (see red fibers in Figs. 5b, 7a) that we define arises from the orbitofrontal and prefrontal cortical areas (the frontal areas anterior to the precentral sulcus). The FPC fibers descend through the ALIC, genu, and the anterior one-third portion of the posterior limb of internal capsule (PLIC) (Figs. 5b, 7a). The FPC fibers continue through the ventro-medial part of the cerebral peduncle (Fig. 5c) caudally to the level of the pons where they decussate (Figs. 3a, 6b) and travel through the contralateral middle cerebellar peduncle (MCP) into the cerebellum (Fig. 6c, corresponds to level 6 in Fig. 4).
Figure 6.

Transverse principal eignvector modulated by FA map fused with the corresponding T2-weighted MR images to illustrate the fronto-ponto-cerebellar (red), parieto-ponto-cerebellar (yellow), occipito-ponto-cerebellar (green), temporo-pontocerebellar (orange), and corticospinal tract (pink) in multiple axial cuts along the long axis of the brainstem indicated in Figure 4. a: View at the axial level of mesencephalic decussation (central red area on DTI color-coded map) at lowest mesencephalon (corresponds to the level 4 in Fig. 4). The white arrow is pointing at the ascending fibers of TPC which are originating from anterior temporal lobe and ascending ventrally to the temporal horn of lateral ventricle (THLV) and dorsally to the uncinate fasciculus fibers. b: View at the axial level of the intersection of superior and middle one-third portions of the pons in the midsagittal plane (corresponds to the level 5 in Fig. 4). c: View at the axial level of the intersection of middle and inferior one-third portions of the pons in the midsagittal plane (corresponds to the level 6 in Fig. 4). Well delineated anatomic landmarks are labeled as follows: Cing = Cingulum (inferior horn); DN = dentate nucleus; DTF = dorsal transverse fibers; ICP = inferior cerebellar peduncle; IV = fourth ventricle; MDX = mesencephalic decussation; MCP = middle cerebellar peduncle; SCP = superior cerebellar peduncle; THLV = temporal horn of lateral ventricle; VTF = ventral transverse fibers; V = vermis of cerebellum; UF = uncinate fasciculus. [Color figure can be viewed in the online issue, which is available at wiley onlinelibrary.com.]
Parieto-Ponto-Cerebellar Tract
The PPC fibers that we define originate from the cortical areas posterior to the precentral sulcus and anterior to the parieto-occipital sulcus including premotor, primary motor (precentral gyrus), primary sensory (post central gyrus), and posterior parietal cortices. The PPC fibers descend side by side with the CST in the centrum semiovale (yellow fibers in Fig. 5a), and then within the posterior two-third portion of the PLIC and the most anterior portion of the retrolenticular portion of the internal capsule (Figs. 5b, 7a). These fibers pass through the lateral segment of the middle portion of cerebral peduncle laterally to the CST (Fig. 5c) or medially to the CST (Fig. 7b,c) and descend to the basis pontis, where they cross through the laterolateral fibers (H-shape red transverse area on DTI color-coded map) (Fig. 6b). We assigned two different colors in 3D reconstruction view (Fig. 3b) for the premotor and the primary motor portion (blue) and parietal portion (yellow) just to show that by moving from the anterior to the posterior areas, these fibers descend to the lower level of the anterior pontis. Hence, even the most forward parietal fibers cross at the upper level of the basis pontis than the posterior parietal fibers which cross at the lower levels (Fig. 3b).
Occipito-Ponto-Cerebellar Tract
This pathway originates from the occipital cortex posterior to the parieto-occipital sulcus (green fibers in Fig. 5a). While descending through the most posterior portion of the PLIC and through the retrolenticular part of the internal capsule (Figs. 5b, 7a), these fibers continue their course caudally through the dorso-lateral portion of the crus cerebri surrounded by the CST ventrally and by the TPC dorsally (Figs. 5c, 6a, 7b,c). The OPC fibers keep this position all the way down to the basis pontis, where they cross to the other side of the pons and go through the contralateral MCP into the cerebellum (Fig. 6b).
Temporo-Ponto-Cerebellar Tract
The TPC tract arises from the tip of the anterior-inferior temporal lobe and ascends dorsally to the inferior branch of the uncinate fasciculus and ventrally to the temporal horn of the lateral ventricle (orange fibers pointed by the white arrow in Figs. 6a, 7c). It continues to ascend further in the temporal lobe to the highest axial level of the mesencephalon (Figs. 3c, 5, 7b). The TPC tract then descends in the posterior margin of the crus cerebri surrounded ventrally by the OPC tract (Figs. 5c, 6a, 6b,c), to the level of the pons, locating dorso-laterally to the OPC and the CST (Fig. 6b). At this level, it crosses to the other side and goes through the contralateral MCP into the cerebellum.
Corticospinal Tract
The CST originates from the precentral motor cortex and descends through the corona radiata and posterior one-third portion of the PLIC side by side to the PPC tract (Figs. 5a,b, 7a). The CST continues to descend in the cerebral peduncle surrounded side by side with the PPC and dorso-laterally by the OPC and TPC tracts (Figs. 5c, 7b) down to the level of the pons where the CPC pathways cross to the other side (Fig. 6b). The CST tract continues its course caudally to the medulla and spinal cord where the CPC fibers do not exist anymore.
In four of our five subjects (80%) we observed that the PPC tract passes through the most lateral portion of the crus cerebri (lateral to the CST) and the CST passes through the more medial and dorsal areas than the PPC in the crus cerebri (Figs. 5c, 6a). Thus, the CST is surrounded by the PPC laterally in the crus cerebri, PLIC, and centrum semiovale (Fig. 5a). In one subject (20%) the CST passes through the most lateral segment of the middle one-third portion of the crus cerebri (Fig. 7b,c) thus, the PPC tract passes medially to the CST in the crus cerebri (Fig. 7b,c) and upper levels such as the PLIC (Fig. 7a) and the centrum semiovale.
Quantitative Analysis
A quantitative summary of the group means and standard deviations of the bilateral FPC, PPC, TPC, and OPC fiber tract volume and their corresponding fractional anisotropy (FA) and mean diffusivity results on the five healthy adults is provided in Table 1. These results were highly reproducible compared with measurements obtained by a second rater (e.g., coefficient of variation < 1%). Note that the tract volume of PPC > FPC > OPC > TPC bilaterally. The volume of the tracts is not significantly different between the two hemispheres (P > 0.05). The fractional anisotropy trend of PPC > FPC ~ OPC > TPC, while the mean diffusivity seems to be largest for TPC > OPC > FPC > PPC.
Table 1.
Summary and Comparison of Reconstructed Group Mean and Standard Deviation of the Tract Volume, Corresponding Fractional Anisotropy (FA), and Average Diffusivity (Dav) for Different CPC Pathways (FPC, PPC, TPC, OPC) in Both Hemispheres
| Right | Left | P | |
|---|---|---|---|
| FPC | |||
| Tract volume (mL) | 4.759 ± 0.567 | 4.684 ± 0.682 | 0.11 |
| FA | 0.566 ± 0.016 | 0.560 ± 0.016 | 0.79 |
| Dav (×10−3 mm2 s−1) | 0.820 ± 0.038 | 0.810 ± 0.03 | 0.62 |
| PPC | |||
| Tract volume | 7.246 ± 0.648 | 7.311 ± 0.686 | 0.662 |
| FA | 0.578 ± 0.028 | 0.590 ± 0.029 | 0.10 |
| Dav (×10−3 mm2 s−1) | 0.800 ± 0.024 | 0.800 ± 0.024 | 1.0 |
| TPC | |||
| Tract volume (mL) | 1.177 ± 0.258 | 1.421 ± 0.315 | 0.06 |
| FA | 0.476 ± 0.046 | 0.472 ± 0.040 | 0.74 |
| Dav (×10−3 mm2 s−1) | 0.920 ± 0.073 | 0.910 ± 0.870 | 0.85 |
| OPC | |||
| Tract volume (mL) | 4.550 ± 0.242 | 4.901 ± 0.300 | 0.54 |
| FA | 0.554 ± 0.034 | 0.542 ± 0.022 | 0.02 |
| Dav (×10−3 mm2 s −1) | 0.847 ± 0.018 | 0.867 ± 0.236 | 0.21 |
Our quantitative findings show that the relative contributions from parietal cortex (including the premotor and the primary motor cortices) to the whole CPC pathways are larger than projections from other cortical areas followed in this order by the prefrontal, occipital and temporal cortical areas. Our quantitative results on the contribution proportion of CPC fibers in the cerebral peduncle are consistent with the results of a recent probabilistic study (18). A representative tractogram of FPC, PPC, OPC, and TPC pathways from one subject is shown in Figure 3.
DISCUSSION
A few previous studies have successfully used probabilistic tractography methods to show the topography of CPC system in the cerebral peduncle (18,19). To the best of our knowledge, the current study is the first to present the whole trajectory and crossings of different CPC pathways especially the TPC tract as well as their position related to the CST at multiple axial brain levels using DTI data with 1-mm sections on healthy human adults.
The tracking of the CPC pathways have been challenging because of the sharp turning angle of their course from the vertical to the horizontal orientation as these pathways cross at the level of the pons. There is another sharp turning angle in their course from the latero-lateral to the antero-posterior orientation as these fibers turn from the basis pontis into the middle cerebellar peduncles after crossing. Therefore, many descending fibers from both hemispheres cross in the brainstem at the basis pontis.
In our experience using thin slices (e.g., 1 mm) reduced the partial volume averaging effects as well as the incoherency due to fiber intercrossings within the voxel (15,20) which enabled the mapping of the whole trajectory and even crossing of the CPC pathways. Using thin slices also enabled us to separate the different CPC fibers from each other and from the CST at multiple axial brain levels (Figs. 5-7). The TPC pathway is clearly delineated and is distinguishable from OPC tract which lies more ventro-laterally within the dorsal part of the crus cerebri (Fig. 5c, 6a). The TPC tract is known from rat studies to carry the auditory information to the cerebellum where visual (by CPC fibers originating from the occipital lobe) and auditory information are integrated for the cerebellar motor control (21).
The current study presented in detail the ROIs used to obtain the different pathways of the CPC system and to parcellate them within the human brain. Our findings on the topography of the TPC and other CPC tracts in the brainstem are consistent with previous human and primate studies as well as the anatomical descriptions in the atlas of anatomy (2,17,22-24).
Some previous DTI studies used two ROIs for delineating the CST (25). The first ROI was placed on the crus cerebri or on the PLIC, and the second ROI was seeded on the motor cortex (25). As we showed due to the close proximity of the CST and CPC tracts in the pons, cerebral peduncle (Figs. 5c, 6b, 7b,c), PLIC (Figs. 5b, 7a), centrum semiovale, and the motor cortex (Fig. 5a) and because the PPC tract is also traversing through all of these structures side-by-side with the CST, seeding two ROIs on these areas would not be a correct method to obtain the CST. Therefore, in addition to the two ROIs that we used for tracking the CST at the level of the pons and motor cortex (Fig. 1e, ROI 2 and 3), we needed to add the third ROI at the level of the medulla (Fig. 1e, ROI 1), where the CPC fibers are not found, to make sure we are not mixing parts of the CPC tracts specially the PPC with the CST pathway.
The advancement of knowledge pertaining to the CPC pathways mapping and quantification in healthy controls will benefit future radiological evaluation of the impairment of CPC pathways in ataxic-dysarthria disorders associated with many types of white matter injuries, such as strokes, trauma, neoplasms and demyelinating diseases. This study can be useful for future investigation of ataxic-dysarthria disorders associated with the CPC pathways involvement in the cortical areas (26), corona radiata (27), internal capsule (28), the brainstem (29), or in pathologies such as ataxic neurodegenerative diseases, including spinocerebellar atrophy (30), olivopontocerebellar and multiple system atrophy (31). Because knowledge of the course of fibers is essential in recognizing Wallerian degeneration (22,32,33), this study is also valuable for studies of degeneration of the CPC pathways due to strokes (22,32), spinal cord injury (33), developmental conditions (34), and other pathologies.
The number of subjects used in the current report is small for a more comprehensive quantitative assessment of side, gender and age effects. Our primary goal was to demonstrate feasibility of tracing the CPC fibers as has been reported previously with a small number of subjects (16,18). The current study demonstrated the ability to delineate and quantify the volume of the CPC tracts and their corresponding diffusion tensor metrics. Our preliminary results might be helpful for future studies to combine anatomical and physiological information to unravel the principles of organization and functional role of the overall CPC system in both health (35-37) and disease (32-34,38).
In the current feasibility study, we used 1-mm sections to reduce the partial volume effects to some extent, but residual artifacts due to complex anatomical structures may still lead to false positive results. In our experience, this is the case in the pontocerebellar region due to the high density of fiber bundles such as ipsilateral transverse pontocerebellar fibers. The use of higher spatial resolution in combination with high diffusion-weighting and angular sampling methods such as diffusion spectrum imaging (39) may help overcome these limitations in the near future.
In summary, this study investigated the tracking and parcellation of different CPC pathways and especially the TPC tract in the healthy human brain at 3.0T. Our technique enabled quantification of four major white matter tracts of the CPC system based on their cortical connections as well as mapping the position of each tract in relation to the CST. Technical advancements in high resolution DTI will permit the generation of detailed white matter maps of the brainstem that may advance our understanding of disease processes affecting the CPC pathways.
Acknowledgments
We thank Vipul Kumar Patel for helping in data acquisition. K.M.H. is funded by the NIH-NINDS “Diffusion Tensor Imaging of Wallerian Degeneration in Multiple Sclerosis”.
Footnotes
Presented in Abstract Form at the RSNA 2008 Meeting (Educational Exhibit # 6010781)
References
- 1.Afifi AK, Bergman RA. Text and atlas. New York: McGraw-Hill; 1998. Functional neuroanatomy; p. 730. [Google Scholar]
- 2.Nolte J. An introduction to its functional anatomy. 5. St. Louis: MO: Mosby; 2002. The human brain; p. 650. [Google Scholar]
- 3.Kitamura K, Nakayama K, Kosaka S, et al. Diffusion tensor imaging of the cortico-ponto-cerebellar pathway in patients with adult-onset ataxic neurodegenerative disease. Neuroradiology. 2008;50:285–292. doi: 10.1007/s00234-007-0351-9. [DOI] [PubMed] [Google Scholar]
- 4.Adachi M, Hosoya T, Yamaguchi K, et al. Diffusion- and T2- weighted MRI of the transverse pontine fibers in spinocerebellar degeneration. Neuroradiology. 2000;42:803–809. doi: 10.1007/s002340000336. [DOI] [PubMed] [Google Scholar]
- 5.Blain CR, Barker GJ, Jarosz JM, et al. Measuring brain stem and cerebellar damage in parkinsonian syndromes using diffusion tensor MRI. Neurology. 2006;67:2199–2205. doi: 10.1212/01.wnl.0000249307.59950.f8. [DOI] [PubMed] [Google Scholar]
- 6.Shiga K, Yamada K, Yoshikawa K, et al. Local tissue anisotropy decreases in cerebellopetal fibers and pyramidal tract in multiple system atrophy. J Neurol. 2005;252:589–596. doi: 10.1007/s00415-005-0708-0. [DOI] [PubMed] [Google Scholar]
- 7.Yoon B, Kim SJ, Lee SK, et al. Early pathological changes in the cerebellum of patients with pure cerebellar syndrome demonstrated by diffusion-tensor imaging. Eur Neurol. 2006;56:166–171. doi: 10.1159/000096181. [DOI] [PubMed] [Google Scholar]
- 8.Nicoletti G, Lodi R, Condino F, et al. Apparent diffusion coefficient measurements of the middle cerebellar peduncle differentiate the Parkinson variant of MSA from Parkinson’s disease and progressive supranuclear palsy. Brain. 2006;129:2679–2687. doi: 10.1093/brain/awl166. [DOI] [PubMed] [Google Scholar]
- 9.Ashtari M, Kumra S, Bhaskar SL, et al. Attention-deficit/hyperactivity disorder: a preliminary diffusion tensor imaging study. Biol Psychiatry. 2005;57:448–455. doi: 10.1016/j.biopsych.2004.11.047. [DOI] [PubMed] [Google Scholar]
- 10.Spanos GK, Wilde EA, Bigler ED, et al. Cerebellar atrophy after moderate-to-severe pediatric traumatic brain injury. AJNR Am J Neuroradiol. 2007;28:537–542. [PMC free article] [PubMed] [Google Scholar]
- 11.Conturo TE, Lori NF, Cull TS, et al. Tracking neuronal fiber pathways in the living human brain. Proc Natl Acad Sci U S A. 1999;96:10422–10427. doi: 10.1073/pnas.96.18.10422. [DOI] [PMC free article] [PubMed] [Google Scholar]
- 12.Stieltjes B, Kaufmann WE, van Zijl PC, et al. Diffusion tensor imaging and axonal tracking in the human brainstem. Neuroimage. 2001;14:723–735. doi: 10.1006/nimg.2001.0861. [DOI] [PubMed] [Google Scholar]
- 13.Hasan KM, Narayana PA. Computation of the fractional anisotropy and mean diffusivity maps without tensor decoding and diagonalization: theoretical analysis and validation. Magn Reson Med. 2003;50:589–598. doi: 10.1002/mrm.10552. [DOI] [PubMed] [Google Scholar]
- 14.Hasan KM. A framework for quality control and parameter optimization in diffusion tensor imaging: theoretical analysis and validation. Magn Reson Imaging. 2007;25:1196–1202. doi: 10.1016/j.mri.2007.02.011. [DOI] [PMC free article] [PubMed] [Google Scholar]
- 15.Hasan KM, Kamali A, Kramer L. Mapping the human brain white matter tracts relative to cortical and deep gray matter using diffusion tensor imaging at high spatial resolution. Magn Reson Imaging. 2009;27:631–636. doi: 10.1016/j.mri.2008.10.007. [DOI] [PubMed] [Google Scholar]
- 16.Wakana S, Jiang H, Nagae-Poetscher LM, et al. Fiber tract-based atlas of human white matter anatomy. Radiology. 2004;230:77–87. doi: 10.1148/radiol.2301021640. [DOI] [PubMed] [Google Scholar]
- 17.Hains DE. An atlas of structures, sections and systems. 7. New York: Lippincott Williams & Wilkins; 2007. Neuroanatomy; p. 341. [Google Scholar]
- 18.Ramnani N, Behrens TE, Johansen-Berg H, et al. The evolution of prefrontal inputs to the cortico-pontine system: diffusion imaging evidence from Macaque monkeys and humans. Cereb Cortex. 2006;16:811–818. doi: 10.1093/cercor/bhj024. [DOI] [PubMed] [Google Scholar]
- 19.Habas C, Cabanis EA. Anatomical parcellation of the brainstem and cerebellar white matter: a preliminary probabilistic tractography study at 3 T. Neuroradiology. 2007;49:849–863. doi: 10.1007/s00234-007-0267-4. [DOI] [PubMed] [Google Scholar]
- 20.Barrick TR, Clark CA. Singularities in diffusion tensor fields and their relevance in white matter fiber tractography. Neuroimage. 2004;22:481–491. doi: 10.1016/j.neuroimage.2004.02.001. [DOI] [PubMed] [Google Scholar]
- 21.Azizi SA, Woodward DJ. Interactions of visual and auditory mossy fiber inputs in the paraflocculus of the rat: a gating action of multimodal inputs. Brain Res. 1990;533:255–262. doi: 10.1016/0006-8993(90)91347-j. [DOI] [PubMed] [Google Scholar]
- 22.Waragai M, Watanabe H, Iwabuchi S. The somatotopic localisation of the descending cortical tract in the cerebral peduncle: a study using MRI of changes following Wallerian degeneration in the cerebral peduncle after a supratentorial vascular lesion. Neuroradiology. 1994;36:402–404. doi: 10.1007/BF00612128. [DOI] [PubMed] [Google Scholar]
- 23.Marin OS, Angevine JB, Jr, Locke S. Topographical organization of the lateral segment of the basis pedunculi in man. J Comp Neurol. 1962;118:165–183. doi: 10.1002/cne.901180204. [DOI] [PubMed] [Google Scholar]
- 24.Schmahmann JD. From movement to thought: anatomic substrates of the cerebellar contribution to cognitive processing. Hum Brain Mapp. 1996;4:174–198. doi: 10.1002/(SICI)1097-0193(1996)4:3<174::AID-HBM3>3.0.CO;2-0. [DOI] [PubMed] [Google Scholar]
- 25.Hua K, Zhang J, Wakana S, et al. Tract probability maps in stereotaxic spaces: analyses of white matter anatomy and tract-specific quantification. Neuroimage. 2008;39:336–347. doi: 10.1016/j.neuroimage.2007.07.053. [DOI] [PMC free article] [PubMed] [Google Scholar]
- 26.Magrotti E, Borutti G, Mariani G, et al. Ataxic hemiparesis syndrome clinical and CT study of 20 new cases. Funct Neurol. 1990;5:65–71. [PubMed] [Google Scholar]
- 27.Sage JI, Lepore FE. Ataxic hemiparesis from lesions of the corona radiata. Arch Neurol. 1983;40:449–450. doi: 10.1001/archneur.1983.04050070079023. [DOI] [PubMed] [Google Scholar]
- 28.Saitoh T, Kamiya H, Mizuno Y, et al. Neurophysiological analysis of ataxia in capsular ataxic hemiparesis. J Neurol Sci. 1987;79:221–228. doi: 10.1016/0022-510x(87)90274-7. [DOI] [PubMed] [Google Scholar]
- 29.Schmahmann JD, Ko R, MacMore J. The human basis pontis: motor syndromes and topographic organization. Brain. 2004;127:1269–1291. doi: 10.1093/brain/awh138. [DOI] [PubMed] [Google Scholar]
- 30.Iwabuchi K, Tsuchiya K, Uchihara T, et al. Autosomal dominant spinocerebellar degenerations. Clinical, pathological, and genetic correlations. Rev Neurol (Paris) 1999;155:255–270. [PubMed] [Google Scholar]
- 31.Yagishita S, Yokoi S, Iwabuchi K, et al. Degeneration of the corticopontine tract in olivopontocerebellar atrophy. Virchows Arch A Pathol Anat Histopathol. 1991;418:99–103. doi: 10.1007/BF01600284. [DOI] [PubMed] [Google Scholar]
- 32.De Simone T, Regna-Gladin C, Carriero MR, et al. Wallerian degeneration of the pontocerebellar fibers. AJNR Am J Neuroradiol. 2005;26:1062–1065. [PMC free article] [PubMed] [Google Scholar]
- 33.Wrigley PJ, Gustin SM, Macey PM, et al. Anatomical changes in human motor cortex and motor pathways following complete thoracic spinal cord injury. Cereb Cortex. 2009;19:224–232. doi: 10.1093/cercor/bhn072. [DOI] [PubMed] [Google Scholar]
- 34.Steinlin M. Cerebellar disorders in childhood: cognitive problems. Cerebellum. 2008;7:607–610. doi: 10.1007/s12311-008-0083-3. [DOI] [PubMed] [Google Scholar]
- 35.Salamon N, Sicotte N, Drain A, et al. White matter fiber tractography and color mapping of the normal human cerebellum with diffusion tensor imaging. J Neuroradiol. 2007;34:115–128. doi: 10.1016/j.neurad.2007.03.002. [DOI] [PubMed] [Google Scholar]
- 36.Jissendi P, Baudry S, Balériaux D. Diffusion tensor imaging (DTI) and tractography of the cerebellar projections to prefrontal and posterior parietal cortices: a study at 3T. J Neuroradiol. 2008;35:42–50. doi: 10.1016/j.neurad.2007.11.001. [DOI] [PubMed] [Google Scholar]
- 37.Ito M. Control of mental activities by internal models in the cerebellum. Nat Rev Neurosci. 2008;9:304–313. doi: 10.1038/nrn2332. [DOI] [PubMed] [Google Scholar]
- 38.Catani M, Jones DK, Daly E, et al. Altered cerebellar feedback projections in Asperger syndrome. Neuroimage. 2008;41:1184–1191. doi: 10.1016/j.neuroimage.2008.03.041. [DOI] [PubMed] [Google Scholar]
- 39.Granziera C, Schmahmann JD, Hadjikhani N, et al. Diffusion spectrum imaging shows the structural basis of functional cerebellar circuits in the human cerebellum in vivo. PLoS One. 2009;4:e5101. doi: 10.1371/journal.pone.0005101. [DOI] [PMC free article] [PubMed] [Google Scholar]