

Abstract
Cancer cells typically demonstrate altered morphology during the various stages of disease progression as well as metastasis. While much is known about how altered cell morphology in cancer is a result of genetic regulation, less is known about how changes in cell morphology affect cell function by influencing gene expression. In this study, we altered cell morphology in different types of cancer cells by disrupting the actin cytoskeleton or by modulating attachment and observed a rapid up-regulation of growth differentiation factor 15 (GDF15), a member of the transforming growth factor-beta (TGF-β) super-family. Strikingly, this up-regulation was sustained as long as the cell morphology remained altered but was reversed upon allowing cell morphology to return to its typical configuration. The potential significance of these findings was examined in vivo using a mouse model: a small number of cancer cells grown in diffusion chambers that altered morphology increased mouse serum GDF15. Taken together, we propose that during the process of metastasis, cancer cells experience changes in cell morphology, resulting in the increased production and secretion of GDF15 into the surrounding environment. This indicates a possible relationship between serum GDF15 levels and circulating tumor cells may exist. Further investigation into the exact nature of this relationship is warranted.
Altered cell morphology is a hallmark of cancer but its influence on the cancer phenotype is not well described. Typically, the further away cancer cells appear morphologically from their normal counterparts, the more malignant the cancer becomes. Despite advances in identifying genetic markers that help diagnose cancer, cell morphology remains as one of the most common traits pathologists use routinely to differentiate between a malignant and normal cell (Gleason and Mellinger, 1974; DeMarzo et al., 2003). Key morphological differences between a cancer and normal cell include but are not limited to altered cell shape, a larger nucleus and prominent nucleoli.
Further alterations to cancer cell morphology occur during metastasis under conditions that either retain or lose attachment to the extracellular environment. During invasion through the extracellular matrix, cancer cells undergo remodeling of the actin cytoskeleton resulting in either an amoeboid or mesenchymal configuration, while maintaining attachment with the extracellular environment via adhesion molecules such as integrins (Friedl and Wolf, 2003; Friedl and Alexander, 2011). Once these cells intravasate into the circulation as circulating tumor cells (CTCs), they lose attachment to the extracellular matrix and as a result, appear morphologically different, characterized by a rounded cell body (Marrinucci et al., 2010; Stott et al., 2010).
While known oncogenes can drive changes to cell morphology (Russo et al., 1991; Fincham et al., 1999), there is also evidence that affecting cell morphology can also determine cell function. For example, cell shape regulation by affecting attachment to a growth surface had the potential to induce stem cells to differentiate into different cell types by activating signal transduction pathways such as RhoA/ROCK (McBeath et al., 2004; Zare-Mehrjardi et al., 2011). In addition, fibroblasts grown in a synthetic three-dimensional matrix had different gene expression profiles when compared to the same fibroblasts grown on a two-dimensional platform made of the same material (Hillmann et al., 1999; Webb et al., 2003). It was also demonstrated that activation of ROCK when cells were subjected to physical forces such as shear stress can affect physical parameters of the cells such as stiffness of the cytoplasm (Lee et al., 2006). This is indicative that alterations to cell shape brought about by changes in the physical environment of the cell have the potential to activate signal transduction pathways that affect cell function at both the gene expression and the physical level (Liu et al., 2006). The importance of extracellular environment is also well studied in diseases such as breast cancer, where malignant breast cancer cells grown ex vivo in tissue culture can be driven to differentiate into normal duct forming structures by growing the cells in a different physical environment containing three-dimensional extracellular matrix components (Weaver et al., 1997; Schedin and Keely, 2011). There is also growing evidence that the physical microenvironment can promote drug resistance in cancer (Desoize et al., 1998; Ghods et al., 2007). The physical environment is clearly important not only in facilitating cancer progression; but also as an obstacle to effective cancer therapy.
Thus, the physical environment is capable of affecting cell morphology and function by regulating gene expression. Identifying which genes in cancer respond to alterations in morphology may help us better understand cancer biology. In this study, we employed three different strategies to alter cell morphology. The first strategy consisted of remodeling the actin cytoskeleton while allowing attachment to a growth substrate, while the second strategy involved loss of adhesion. The third strategy grew cells in a three-dimensional matrix of different collagen I concentration. We further describe a target gene, GDF15, whose expression closely follows changes to cell morphology. This gene is implicated in multiple cancer types and may reflect a common response mounted by cells in the face of altered morphology.
Materials and Methods
Cell culture
All cell lines were purchased from American Type Culture Collection and authentication was done by provider using short tandem repeat profiling. LNCaP, PC3, and DU145 prostate carcinoma cell lines were cultured in 1 × RPMI-1640 media (Invitrogen, Grand Island, NY) supplemented with 10% fetal bovine serum (FBS) (Gemini Bio-Products, West Sacaramento, CA) and 50 μg/ml of penicillin/streptomycin (Corning, Cellgro, Manassas, VA). HCT-116 colon cancer cell line was grown in McCoy's Media (Invitrogen) supplemented with 10% FBS and 50 μg/ml penicillin/streptomycin.
Altering morphology with latrunculin B or jasplakinolide
Cells were treated with either 500 nM latrunculin B (Lat B) (Enzo Life Sciences, Farmingdale, NY) or 100 nM jasplakinolide (Jpk) (Life Technologies, Grand Island, NY) drug for 8 h. To allow cell morphology to recover, medium containing drug was removed after 8 h and fresh media added. Phase images were acquired using a Zeiss Cell Observer Imaging system (Carl Zeiss, Inc., Germany) at 20× magnification.
Altering morphology by preventing attachment to tissue culture dish
Tissue culture dishes were coated with poly(2-hydroxyethyl methacrylate) (PHEMA) (Sigma-Aldrich, St. Louis, MO) at a concentration of 0.8 mg/cm2. Coated dishes were rinsed twice with sterile 1× PBS before seeding cells in growth medium. To assay conditioned media for measuring GDF15 by ELISA, growth media was changed 24 h before harvesting. Harvested cell suspensions were centrifuged at 300g for 5 min and supernatant was collected for ELISA.
Altering morphology by growing cells in collagen I matrix
Human collagen type I (BD Bioscience, San Jose, CA) was diluted to the appropriate concentration using sterile 4 mM HCl and 10× RPMI was added to neutralize pH. Freshly trypsinized cells re-suspended in FBS were added to the neutralized collagen I. The collagen gel was then allowed to polymerize at 37°C, 5% CO2, 90% humidity overnight. To harvest the cells from collagen gels, collagenase (Sigma-Aldrich) was added and incubated at 37°C for 15 min. Cell pellet was harvested from gel by centrifuge at 300g for 5 min.
Signal transduction pathway inhibitors
Twenty micromolars of PKC inhibitor H7 and 2 μM of p38MAPK inhibitor SB203580 (Enzo Life Science, Farmingdale, NY) were added in combination with Lat B, Jpk, or cells grown on PHEMA-coated dishes and incubated for 8 h before harvesting cell lysates. These inhibitors were chosen based on previously observed findings that activation of protein kinase C (PKC) or p38 mitogen-activated protein kinase (p38MAPK) through the addition of phorbol 12-myristate 13-acetate (PMA) or vitamin E respectively up-regulates GDF15 expression (Shim and Eling, 2005, 2008).
RNA isolation and quantitative reverse transcription PCR
RNA was isolated from cells using RNeasy spin column mini kit (Qiagen, Germany) and 1 μg of RNA was converted to cDNA using the iSCRIPT cDNA synthesis kit (BioRad, Hercules, CA). Quantitative PCR was performed using SYBR green master mix (BioRad) and ran on a BioRad CFX-96 Real-time system. Primers were designed using Vector NTI. Sequence of GDF15 forward primer 5′-TCAAGGTCGTGGGACGTGACA-3′. Sequence of GDF15 reverse primer 5′-GCCGTGCGGACGAAGATTCT-3′. TATA-binding protein (TBP) was used as internal reference. Sequence of TBP forward primer 5′-GAATATAATCCCAAGC-GGTTTG-3′. Sequence of TBP reverse primers 5′-ACTTCA-CATCACAGCTCCCC-3′. ΔCT was calculated by subtracting TBP CT values from GDF15 CT values and ratio of GDF15 to TBP was calculated subsequently using 2−ΔCT.
Immunostaining for cell morphology analysis
Cells were washed with 1 × PBS and then fixed with 3.7% paraformaldehyde for 10 min. Fixed cells were rinsed twice with 1 × PBS and permeabilized with 1 × PBS/0.1% Triton X-100 for 5 min. After permeabilization, rhodamine phalloidin was added to stain cellular actin and nuclear DNA counterstain was done with DAPI (Invitrogen) in 1 × PBS/1% BSA and incubated at room temperature for 30 min. Cells were then rinsed twice with 1 × PBS and mounted in VectaShield mounting media.
Automated quantification of cellular morphology
Quantification of cellular morphology properties from low magnification (10×) fluorescent images was done using custom software written in MatLab (Chen et al., 2013). Briefly, non-uniformities in the intensity field of the fluorescent images were corrected, and precise segmentation of cellular and nuclear boundaries were conducted using the corresponding stains of actin and DAPI channels. These segmented regions were then used for quantification of cellular and nuclear parameters.
WST-1 assay
Premixed WST-1 cell proliferation assay kit (Clontech, Mountain View, CA) was used to measure cell proliferation. 5 × 10³ cells were grown in 96-well plate (BD Falcon, San Jose, CA) on either PHEMA-coated or uncoated conditions in quadruplicates. WST-1 reagent was added in a 1:10 dilution at 0, 8, 24, or 72 h and incubated for 2 h before absorbance was measured using a FLUOStar Omega microplate reader from BMG Labtech, Germany. Absorbance was read at440 nm, with wavelength correction done against 650 nm. Background correction was also performed for both wavelengths.
SDS-PAGE and immunoblot
Cell lysates were mixed with Laemmli buffer (BioRad) with β-mercaptoethanol in a 1:1 volume ratio. Samples were then boiled for 10 min before cooling on ice. Samples were then transferred to a 4–20% Mini PTOTEAN TGX gradient gel (BioRad) and subjected to electrophoresis. Semi-dry transfer of protein to nitrocellulose membrane was done using the Trans-Blot Turbo system from BioRad. After transfer, blots were stored in 1 × PBS, 0.1% Tween-20 wash buffer overnight at 4°C Blots were then blocked in 5% milk dissolved in 1 × PBS, 0.1% Tween-20, for 1 h at room temperature. Rabbit polyclonal antibody to human GDF15 (Santa Cruz Biotechnology, Inc., Dallas, Texas) was used at a 1:500 dilution and incubated for 1 h at room temperature. Lamin A/C (Santa Cruz Biotechnology, Inc.) was used as loading control and rabbit polyclonal antibody against lamin A/C was used at a 1:2,000 dilution. After primary antibody incubation, blots were washed for 5 min using wash buffer five times with agitation. A HRP conjugated goat anti-rabbit secondary antibody was applied to the membrane in a 1:20,000 dilution and incubated for 1 h at room temperature followed by 5 min wash repeated five times. Membranes were incubated with Supersignal West Dura extended duration substrate (Thermo Scientific, Waltham, MA) and the blot was exposed to Amersham Hyperfilm ECL chemiluminescence film (GE, Pittsburgh, PA).
High throughput fluorescence microscopy
Fluorescent images of stained cells were acquired using a Nikon TE300 epifluorescence microscope (Nikon, Melville, NY). A 9-by-9 scanning grid comprising of 81 image fields (with a ∼ 10% overlap with adjacent fields to reduce artificial fragmentation of cell and nucleus) were generated using the NIS Elements software. The size of each image field (based on the Nikon QMiMc camera sensor) was 1280 × 1024 pixels, and the pixel size using the 10× objective was 0.57 μm, respectively. Two channels (UV, RFP) were acquired for each image field, followed by a calibration image of both channels respectively for use in computationally reducing the non-uniformity of the illumination field (Chen et al., 2013).
Enzyme linked immunosorbent assay (ELISA) for GDF15
A commercial sandwich ELISA kit (R&D Systems, Minneapolis, MN) was used to detect human GDF15 in conditioned media and serum and performed according to manufacturer's protocol. Absorbance was read using a FLUOStar Omega microplate reader (BMG Labtech). Absorbance readings were taken at 450 nm and wavelength correction was done against 540 nm. Blank corrections were done for both wavelengths. A standard curve using recombinant GDF15 was run concurrently in every plate using dilution buffer provided by manufacturer and sample concentration was calculated based on standard curve and dilution factor.
Construction of PTFE chamber
Chambers were constructed from PTFE tubing (Zeus, Inc., Orangeburg, SC) by cutting into rings 5 mm in length. One PTFE membrane filter of 0.2 μm pore size (Millipore, Billerica, MA) each was used to cover the top and bottom of the chamber using silicone adhesive (NuSil, Carpinteria, CA). A drop of silicone adhesive was also applied to the side of the chamber wall to serve as an injection plug septum. The silicone adhesive was allowed to cure for 48 h followed by gamma irradiation sterilization.
Growing LNCaP or PC3 cells in PTFE chamber
Cells were introduced into PTFE chamber using a 26G needle through the injection plug septum. Chambers were then submerged in RPMI supplemented with 5% FBS and 1% penicillin/streptomycin. To demonstrate that cells introduced into the chamber could continuously secrete GDF15, 2 × 10⁵ LNCaP or PC3 were injected into these chambers and then submerged into 6 ml of growth media. Media was changed weekly and 1 ml aliquots were harvested 24 h after addition of fresh media. Collected media was centrifuged at 300g for 5 min to separate any debris and measured for GDF15 as picogram GDF15 secreted per one million cells over 24 h. To measure cell count, chambers were disassembled by removing PTFE filter membrane and cells were harvested by gentle aliquoting without the use of trypsin. Suspended cells could be harvested from the chambers by gentle aspiration with no washing or addition of trypsin.
Subcutaneous implantation of PTFE chamber in athymic nude mice
All animal treatment protocols were approved by the animal care and use committee of The Johns Hopkins University. Chambers containing LNCaP or PC3 were implanted subcutaneously into athymic nude mice, FIVE per group, to see how the chambers will affect serum GDF15. Athymic nude mice (Harlan Laboratories, Indianapolis, IN) were first anesthesized using 100 mg/kg of ketamine and 10 mg/kg of xylazine administered intraperitoneally and the site of incision was sterilized with Wescodyne and 70% ethanol. A 15 mm incision was introduced near the right scapulae and a space was formed underneath the subcutaneous layer using a hemostat to dissociate connective tissue, forming a space underneath the subcutaneous layer. The diffusion chamber containing either 2 × 10⁵ PC3 or LNCaP cells was inserted into the space 5 mm away from the incision site. The incision site was then closed using sterile surgical clips. Mice were observed until they regained consciousness and checked daily for discomfort or inflammation at site of the implantation.
Measurement of subcutaneous tumor xenograft volume in athymic nude mice
A separate group of athymic mice were used for this experiment. For the PC3 subcutaneous xenograft, 2 × 10⁵ PC3 cells were injected into the dorsal flank of athymic nude mice. For LNCaP subcutaneous xenograft, 2 × 10⁵ LNCaP mixed with 200 μl Matrigel (BD Bioscience) were injected into the dorsal flank of athymic nude mice. Fifteen mice were used per group. Each mouse was weighed and tumor volume was measured weekly. Calculation of tumor volume was achieved using the following equation: π/6 × length × width × height.
Immunohistochemistry in tumor xenografts
Animals were euthanized by CO2 asphyxiation and xenograft tumors were excised from euthanized animals and placed in formalin fixative followed by embedding in paraffin. Fixed tissues were sent to Tissue Microarray Lab core facility at the Sidney Kimmel Comprehensive Cancer Center at Johns Hopkins for paraffin embedding, sectioning and H&E staining. Immunohistochemistry was done using the EnVision G|2 Doublestain System from DAKO. Formalin fixed paraffin embedded xenografts were first deparaffinized in xylene, two times, 10 min each, followed by rehydration in 100% ethanol, 95% ethanol, and 70% ethanol, 5 min each. Specimens were then further rehydrated in deionized H2O twice for 5 min each and heat-mediated antigen unmasking was performed using 10 mM sodium citrate buffer pH 6.0 for 20 min. After antigen unmasking, endogenous enzyme activity was blocked using the dual endogeneous enzyme block provided and a second blocking step was done by incubating specimens using 5% milk, 0.05% Tween-20 in 1 × TBS for 1 h at room temperature. After blocking, primary antibody was added at the appropriate concentration (20 mg/ml mouse anti-human GDF15 monoclonal antibody (R&D Systems); 1 mg/ml rabbit anti-human VEGF polyclonal antibody (Millipore) for 1 h, followed by three washes with 0.05% Tween-20 in 1 × TBS wash solution. A mixture containing HRP-conjugated dextran beads that contain antibodies to either mouse or rabbit immunoglobulins was added to bind to the primary antibody. Substrate solution was added and color was allowed to develop for up to 15 min. Specimens were counterstained with hematoxylin and permanently mounted using Cytoseal from Thermo Scientific.
Statistical analysis
Statistical analysis was performed with GraphPad PRISM (GraphPad Software, Inc., La Jolla, CA). Two-tailed unpaired t-test was used to analyze q-RT-PCR results of GDF15 expression as well as morphological changes. Bonferroni's multiple comparison test was used to compare GDF15 expression between growth in different collagen concentrations as well as secreted GDF15 from different cell lines. P-values less than 0.05 are considered statistically significant.
Results
Identification of growth differentiation factor 15 (GD15) as target gene candidate following disruption of cell morphology
To identify a target gene that changed in expression following manipulation of cell morphology, LNCaP prostate carcinoma cells were treated with 500 nM of latrunculin B (Lat B), a drug that specifically disrupts the actin cytoskeleton (Morton et al., 2000) for 8 h and gene expression compared between Lat B or carrier treatments using an Agilent 4 × 44 k gene expression microarray. Seven potentially up-regulated target genes were first selected using the following criteria: a P-value of less than 0.001, signal intensities above background for both red and green channels, and using a cutoff of 1.5-fold up-regulation. These seven target genes also demonstrated either the highest fold up-regulation or had known involvement with prostate cancer. These seven potential target genes were then further verified using quantitative reverse transcription PCR comparing between Lat B and carrier treated LNCaP or PC3 cells. Growth differentiation factor 15 (GDF15) was one of the target genes that was consistently up-regulated in both Lat B treated LNCaP and PC3 (Supplementary Fig. 1).
GDF15 does not affect cell attachment or proliferation under non-attachment conditions
To clarify the causal relationship between morphology and GDF15, cells were grown in different amounts of GDF15 to determine the effects on cellular morphology. LNCaP, PC3, and DU145 cells all produce different amounts of GDF15 while grown on a tissue culture dish. LNCaP produces the most GDF15, followed by PC3 and DU145 (Liu et al., 2003). Neither PC3 nor DU145 cells grown in LNCaP conditioned media exhibited any noticeable alterations to attachment or morphology within 24 h (Supplementary Fig. 2). In addition, neither transient nor long-term knockdown of GDF15 in PC3 or LNCaP altered morphology (Supplementary Fig. 2).
Rapid, reversible induction of GDF15 up-regulation accompanied disruption of actin cytoskeleton
Jasplakinolide (Jpk) is another drug that disrupts cell shape by targeting the actin cytoskeleton (Bubb et al., 2000). PC3 prostate carcinoma cells treated with either 500 nM Lat B or 100 nM Jpk displayed altered morphology as evidenced by the rounding up of cell body within 8 h of drug exposure (Fig. 1i). Increase in GDF15 mRNA and protein levels accompanied this change in morphology (Fig. 1ii, iii), confirming microarray results. Cells treated with Jpk or Lat B remained attached to the tissue culture dish despite the morphological change. Cell morphology recovered within 24 h following removal of drug (Fig. 1i) and corresponded to significant decreases in GDF15 mRNA and protein levels (Fig. 1ii, iii). No significant toxicity was associated with 8-h exposure to either drug (Fig. 1iv).
Fig. 1.

Disruption of cell morphology using drugs that target the actin cytoskeleton up-regulate GDF15 expression. (i) Images of PC3 cells treated with carrier (ethanol), latrunculin B (Lat B) or jasplakinolide (Jpk) within 8 h of treatment (top row) and after 24-h recovery following removal of drug by changing media (bottom row). White bar=50 μm. (ii) Quantitative real-time PCR (Q-PCR) showing elevated GDF15 mRNA transcript levels within 8 h of either Lat B or Jpk treatment relative to vehicle treated cells. Levels of GDF15 transcript decreased 24 h after removal of drug (P < 0.05). (iii) Immunoblot of PC3 cell lysate of different treatments probing for intracellular GDF15 protein levels and lamin A/C as loading control. (iv) WST-1 assay of PC3 cells treated with carrier, Lat B or Jpk for 8 h. (v) Immunoblot for GDF15 in PC3 cells following 8-h treatment using carrier, 300 nM PMA, 500 nM Lat B, or 100 nM Jpk with or without combination of 2 μM SB203580 and 20 μM PKC inhibitors.
There is evidence that treating cells with actin perturbing agents such as latrunculin or cytochalasins can activate PKC or p38MAPK signal transduction (Lim et al., 2000, 2003). To examine if these pathways were also responsible for GDF15 up-regulation observed in Jpk treated PC3 cells, we first tested a panel of inhibitors in an attempt to suppress GDF15 up-regulation by Jpk. Of the inhibitors tested, those targeting p38MAPK (SB203580) or PKC (H7) could partially suppress GDF15 up-regulation by Jpk in a dose-dependent manner (Supplementary Fig. 3), verifying previously reported findings of the involvement of PKC or p38MAPK in regulating GDF15 expression. As a control, PMA was used to activate PKC signaling transduction pathway. PMA was also known to be capable of increasing GDF15 expression through the activation of PKC in prostate cancer cells (Shim and Eling, 2005, 2008). Treating PC3 cells with 300 nM PMA increased GDF15 protein levels within 8 h (Fig. 1v). Adding 2 μM p38MAPK (SB203580) and 20 μM PKC (H7) inhibitors in combination prevented GDF15 up-regulation induced by PMA as well as Lat B and Jpk in PC3 (Fig. 1v). Similar results were observed in two other prostate carcinoma cell lines, LNCaP and DU145 (Supplementary Fig. 4), although there appear to be additional pathways involved in regulation of GDF15 expression for LNCaP as GDF15 up-regulation was not fully suppressed. This indicates that disruption of cell morphology using Lat B or Jpk activated signal transduction pathways such as the PKC/p38MAPK resulting in GDF15 up-regulation. This up-regulation can be reversed by inhibiting the PKC p38MAPK pathway or allowing cells to recover cell morphology by removing the drug.
GDF15 expression accompanied changes in morphology over time of attachment
To confirm GDF15 up-regulation was not due to Lat B or Jpk directly activating PKC/p38MAPK pathway, we tested alternate approaches to alter cell morphology. The first approach was to follow GDF15 expression and cell morphology as cells were allowed to attach to a normal tissue culture dish in a time dependent manner. Freshly trypsinized PC3 cells were seeded onto a tissue culture dish and harvested 8, 24, and 72 h post-seeding for analysis of GDF15 mRNA and protein levels. Cells harvested by scraping were used as the 0-h time point control. At 8 h post-seeding, a majority of PC3 cells were not fully attached to the tissue culture dish and appeared more circular and smaller morphologically (Fig. 2i). Correspondingly, GDF15 mRNA and protein levels were elevated at 8 h (Fig. 2ii, iii). At 24 h of attachment, PC3 cells had more time to attach and appeared less circular and had a slightly larger cell size. This change in morphology was accompanied by a decrease in both GDF15 mRNA and protein levels (Fig. 2ii, iii). To confirm these qualitative morphological observations quantitatively, we quantified three parameters of cell morphology: circularity, size and perimeter and found that in concordance with qualitative observations, a higher proportion of cells were more circular and smaller at 8 h as compared to 24 h of attachment (Fig. 2iv–vi).
Fig. 2.
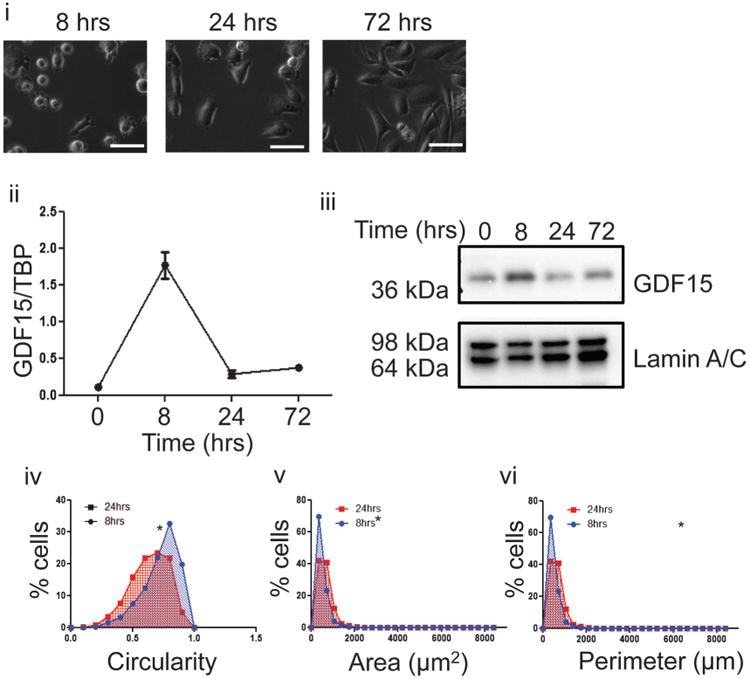
Up-regulation of GDF15 following changes to cell morphology by attachment to a normal tissue culture dish. (i) PC3 cells were seeded on a normal tissue culture dish and images taken at 8, 24, and 72 h after seeding. White bar=50 μm. (ii) Q-PCR of GDF15 mRNA transcript levels from at 0, 8, 24, and 72 h after seeding freshly trypsinized cells on tissue culture dish. Cells previously grown on a regular tissue culture dish for 96 h were harvested by scraping for 0-h time point. (iii) Immunoblot probing for GDF15 with lamin A/C as loading control. Cell lysate was prepared from cells harvested at 0, 8, 24, or 72 h after seeding on uncoated or PHEMA-coated dishes. (iv) Frequency distribution curve of cell circularity comparing between cells at 8 and 24 h of attachment (P < 0.05). (v) Frequency distribution curve of cell area comparing between cells at 8 and 24 h of attachment (P < 0.05). (vi) Frequency distribution curve of cell perimeter comparing between cells at 8 and 24 h of attachment (P < 0.05).
Next, we examined whether maintaining a constant rounded morphology could sustain GDF15 up-regulation. Freshly trypsinized PC3 were seeded on PHEMA-coated dishes and harvested at 8, 24, and 72-h intervals to analyze for GDF15 expression. Cell harvested by scraping were used as the 0-h time point control. Rounded morphology was maintained at all time points of this experiment (Fig. 3i). Correspondingly, GDF15 mRNA and protein levels remained elevated at all time points as well (Fig. 3ii, iii). Cells grown on PHEMA-coated dishes were still viable, although they proliferated slower than cells grown on uncoated tissue culture dishes (Fig. 3vi). Similar results were obtained with LNCaP and DU145 cells, indicating that increasing GDF15 levels is a common response prostate cancer cells exhibit when morphology was altered (Supplementary Fig. 5).
Fig. 3.
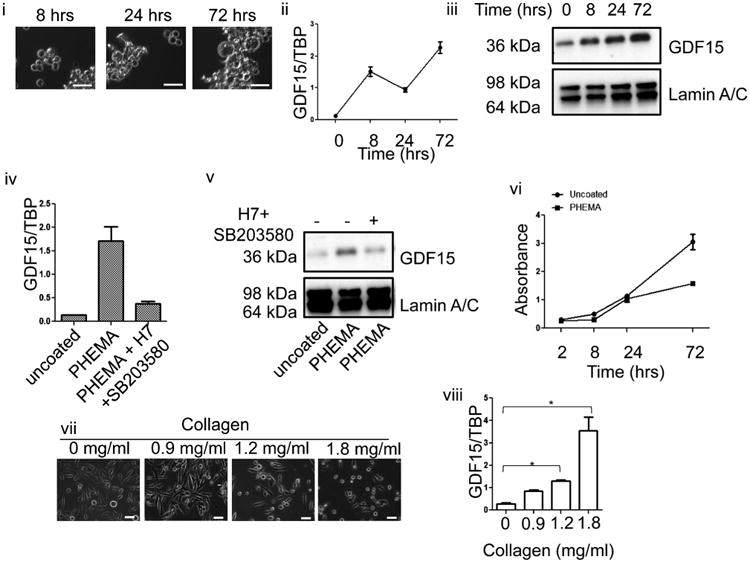
Sustained up-regulation of GDF15 following prolonged changes to cell morphology by growing cells on PHEMA-coated dish. (i) PC3 cells were seeded on a PHEMA culture dish and images taken at 8, 24, and 72 h after seeding. White bar=50 μm. (ii) Q-PCR of GDF15 mRNA transcript levels from at 0, 8, 24, and 72 h after seeding freshly trypsinized cells on PHEMA-coated dish. Cells previously grown on a regular tissue culture dish for 96 h were harvested by scraping for 0-h time point. (iii) Immunoblot probing for GDF15 with lamin A/C as loading control. Cell lysate was prepared from cells harvested at 0, 8, 24, or 72 h after seeding on uncoated or PHEMA-coated dishes. (iv) Q-PCR of GDF15 demonstrating effect of adding p38MAPK and PKC inhibitor combination to cells grown on PHEMA-coated dish (P < 0.05). (v) GDF15 immunoblot demonstrating that effect of p38MAPK and PKC inhibitor combination to GDF15 protein levels. (vi) WST-1 assay demonstrating viability of cells grown on uncoated or PHEMA-coated dish. (vii) Images of PC3 cells grown in increasing collagen I concentration. (viii) Q-PCR analysis of PC3 cells grown in different collagen I concentration matrix (P < 0.05).
To determine if PKC and p38MAPK were also activated when cells lost attachment, we treated cells grown on PHEMA-coated dishes with a combination of SB203580 and H7. Interestingly, inhibiting the PKC p38MAPK signaling pathway suppressed the up-regulation of GDF15 (Fig. 3iv, v). This observation demonstrated that in PC3, the activation of PKC/p38MAPK was induced by altered morphology and not a non-specific effect of Lat B or Jpk. This inhibition was also seen in DU145 but not LNCaP, indicating that other pathways exist that could regulate GDF15 expression (Supplementary Fig. 5).
Another approach to alter cell morphology was to grow the cells in a human collagen I matrix, a major component of the bone matrix. When PC3 cells were grown in a collagen I matrix, the cells again exhibited altered morphology such as rounding of the cell body with increasing density of collagen (Fig. 3vii), similar to that seen by drug treatment or growth on PHEMA-coated plates and GDF15 mRNA levels increased with increasing collagen density (Fig. 3viii). This behavior was also observed in LNCaP and DU145 cells (Supplementary Fig. 5).
Different types of cancer cell lines increase secretion of GDF15 following altered cell morphology
To determine if secreted GDF15 was also increased when cell morphology was altered, conditioned media from cells grown on PHEMA-coated tissue culture dishes and uncoated tissue culture dishes was measured for GDF15 using ELISA. Cells were grown on either uncoated dishes or PHEMA-coated dishes for 48 h. The media was then changed and the conditioned media was harvested 24 h later and secreted GDF15 was measured as picogram of GDF15 secreted per one million cells over 24 h. As expected, PC3, LNCaP and DU145 grown on PHEMA-coated dishes demonstrated altered morphology and secreted higher amounts of GDF15 (Fig. 4 i, ii). When cells grown on PHEMA-coated dishes were cultured back onto normal tissue culture dishes, cell morphology returned and secretion of GDF15 decreased. This result reinforced our findings that GDF15 up-regulation occurred both at the mRNA and intracellular protein levels upon altered morphology, and demonstrates a positive relationship between intracellular protein levels and secreted protein. Similarly, increased secretion of GDF15 was observed in HCT116 cells grown on PHEMA-coated dishes (Fig. 4ii).
Fig. 4.
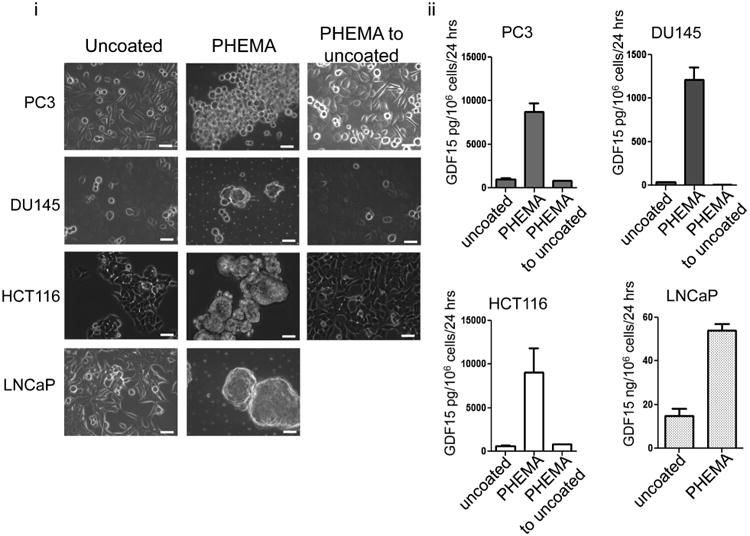
Different cell types increase GDF15 secretion following changes to morphology induced by preventing attachment. (i) Different types of cancer cells demonstrate morphology changes when cells were grown on PHEMA-coated dishes as compared to growth on uncoated normal dishes. This change in morphology is regained when cells on PHEMA-coated dishes were allowed to re-attach to uncoated normal dishes. White bar=50 μm. (ii) Bar graphs depicting the amount of GDF15 secreted per cell type. Amount of GDF15 secreted increased when cells were grown on PHEMA-coated dishes and decreased back to normal when cells were allowed to re-attach to normal dishes (P < 0.05).
Cells grown under conditions preventing attachment in vivo can contribute to overall serum GDF15 levels
It is known that metastatic prostate cancer patients have higher levels of serum GDF15 (Selander et al., 2007; Brown et al., 2009). Our own analysis of GDF15 among 89 patients yielded similar results (Supplementary Fig. 6, Supplementary Table 1). It has also been documented that patients with metastatic disease have higher numbers of CTCs (Allard et al., 2004; de Bono et al., 2008), and these CTCs appear morphologically different from the solid tumor counterparts (Marrinucci et al., 2010). To examine if CTCs could affect serum GDF15 levels, LNCaP or PC3 cells were introduced as a suspension into a diffusion chamber made of polytetrafluoroethylene (PTFE). PTFE was chosen as the material of choice as cells attach poorly to PTFE without prior chemical modifications (Chen et al., 2003; Gabriel et al., 2011). 2 × 10⁵ LNCaP or PC3 cells injected into these chambers secreted GDF15 to a similar level attained by growing on PHEMA-coated dishes (Fig. 5i). Cells harvested from the chambers as a suspension retained ability to re-attach to uncoated tissue culture dishes (Supplementary Fig. 7). Chambers implanted in mice resulted in elevated serum GDF15 (Fig. 5iv) within 10 days as compared to mice with subcutaneously injected cells of similar numbers (Supplementary Fig. 7).
Fig. 5.
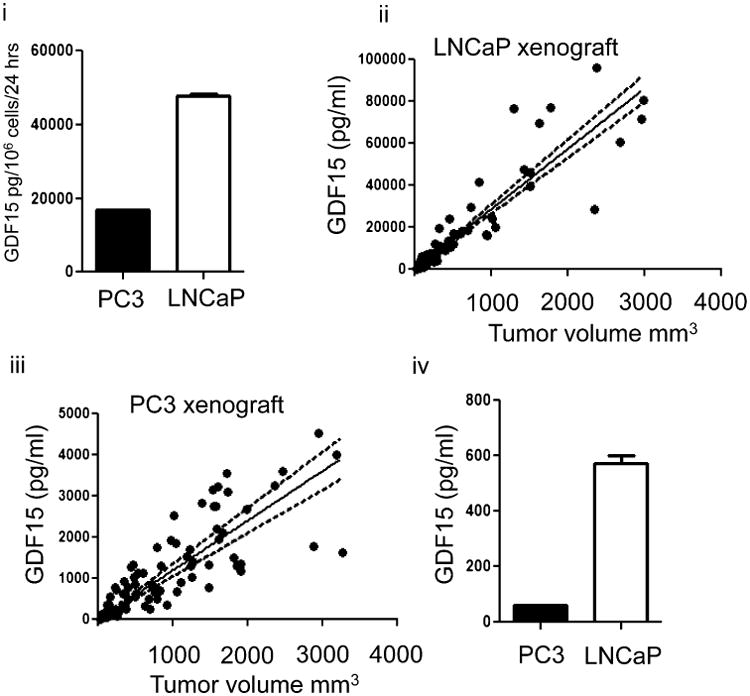
Small number of cells grown under conditions preventing attachment in vivo can result in an increase in serum GDF15. (i) Amount of GDF15 secreted into conditioned media when 2 × 10⁵ PC3 or LNCaP cells introduced into PTFE diffusion chambers were grown in vitro for 3 weeks. (ii) Scatter plot of tumor volume against serum GDF15 concentration in PC3 xenografts (n = 11). Linear regression analysis was performed and a best-fit line drawn as a solid line. Dashed line indicates 95% confidence interval of best-fit line. (iii) Scatter plot of tumor volume against serum GDF15 concentration in LNCaP xenografts (n = 12). Linear regression analysis was performed and best-fit line drawn as solid line. Dashed line indicates 95% confidence interval. (iv) Bar graph of GDF15 in pooled serum of mice implanted with chambers containing 2 × 10⁵ PC3 or LNCaP, n = 5 for each group.
To observe if a tumor xenograft would influence serum GDF15 in a similar fashion, PC3 or LNCaP tumors were incoculated subcutaneously into a separate group of mice. Tumor volume and serum GDF15 were measured weekly. A linear regression and correlation analysis yielded a positive relationship between tumor volume and serum GDF15 levels (Fig. 5ii, iii). For LNCaP xenograft tumors, linear regression analysis yielded a slope of 28.8 ±1.1 (95% confidence interval, P-value less than 0.001); the Pearson correlation coefficient was 0.9087 while the r2 value was 0.8258 (P-value less than 0.001). For PC3 xenograft tumors, linear regression analysis yielded a slope of 1.21 ± 0.058 (95% confidence interval, P-value less than 0.001); the Pearson correlation coefficient was 0.8145 while the r2 value was 0.6634 (P-value less than 0.001). Using the linear regression model analysis, it was estimated that 2 × 10⁵ LNCaP cells grown in the chamber and implanted into mice resulted in serum GDF15 levels corresponding to that of a tumor mass of 19.9 mm3. For PC3 cells, 2 × 10⁵ cells in the PTFE chamber implanted subcutaneously into mice resulted in serum GDF15 levels corresponding to that of a tumor mass of 51.2 mm3 (Fig. 5iv).
Heterogeneous expression of GDF15 in xenograft tumors
To understand why xenograft tumors affected serum GDF15 levels to a lesser degree than cells grown in diffusion chambers, immunohistochemical (IHC) staining for GDF15 was performed on xenografts tumor sections. Visible staining was only observed in LNCaP and none observed in PC3 xenografts (Fig. 6). In LNCaP xenografts, little or no staining was observed in the majority of the tumor with stronger staining for GDF15 observed in regions where cancer cells appear to be palisading towards necrotic regions. This signal is specific to GDF15 as no staining was observed using negative IgG controls. As a positive control, xenografts were stained for VEGF, another cytokine important for remodeling the extracellular environment that is also controlled by environmental factors (Namiki et al., 1995). VEGF staining within the xenograft was homogeneous with slightly stronger staining noted near regions of necrosis (Fig. 6).
Fig. 6.
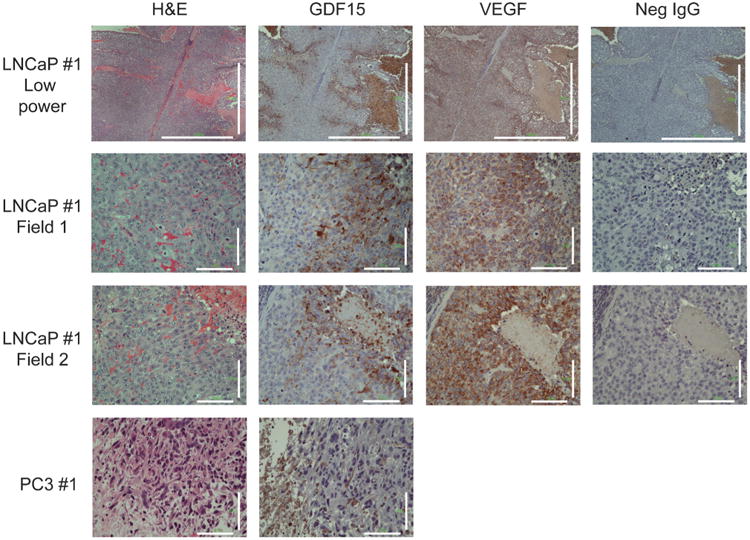
Histological staining of LNCaP and PC3 xenografts. H&E and Immunohistochemistry staining for GDF15, VEGF, and IgG negative control, respectively. Large regions of tumor do not stain for GDF15. Strong staining for GDF15 was observed near regions where cells were palisading towards necrotic regions. Little staining for GDF15 was observed anywhere else in the xenograft. Strong VEGF staining was observed throughout the xenograft, but was stronger near regions that corresponded to strong GDF15 staining. Scale bar=1,000 μm (low magnification), 100 μm.
Discussion
Our results demonstrate a new unique mechanism by which the levels of GDF15 expression in cancer cells can be affected through changes to cell morphology. There are multiple mechanisms by which morphology can be altered and three different strategies were employed in this study that altered morphology while allowing cells to retain or lose cell adhesion. Cell morphology was first affected by altering the actin cytoskeleton through the use of drugs that target the actin cytoskeleton, Lat B, and Jpk. This resulted in changes to morphology with minimal impact on attachment. A second method was to physically prevent attachment to a growth substrate through the use of PHEMA. The third method was to grow cells in a three-dimensional collagen I matrix gel. Cells grown in this three-dimensional gel adopted a different morphology but were still attached to the collagen I matrix. While these strategies are artificial and may not mimic in vivo environment conditions, they are nevertheless effective mechanisms of modulating cell morphology and allowed us to study the consequences of altering cancer cell morphology.
We further demonstrated that such changes in morphology most likely resulted in the activation of signal transduction pathways such as PKC/p38MAPK and a resulting increase in GDF15 production and secretion. GDF15 up-regulation in this manner could be independent of p53, as observed in PC3 and DU145, which have mutated p53 (Isaacs et al., 1991). This up-regulation was sustained as long as cell morphology remained altered, yet reversible when cell morphology was allowed to return. This observation can also be extended to different types of cancer cells and indicates GDF15 up-regulation is a common response that cancer cells mount under conditions that affect morphology. Little is known regarding the direct relationship between changes in morphology and PKC/p38MAPK activation, but there have been reports that the disruption of the actin cytoskeleton or applying a mechanical force can activate PKC/p38MAPK activity (Geng et al., 2001; D'Addario et al., 2002; Wang et al., 2005). It is plausible a change in morphology would equate to a change in mechanical forces applied on a cell that remodels the actin cytoskseleton and the activation of PKC or p38MAPK signaling. Mechanical forces are also known to activate Rho signaling (McBeath et al., 2004; Zare-Mehrjardi et al., 2011), raising the possibility that PKC/p38MAPK and possibly other signal transduction pathways responsive to changes in cell morphology may exist. More work is needed to determine the exact nature of how changes in morphology can activate signal transduction pathways. It is also possible that changes in morphology can induce a shift in integrin binding sites that may influence signal transduction pathway activation.
Given that treating cells with PKC/p38MAPK inhibitors reduced intracellular protein levels, and intracellular protein levels are positively correlated with secreted GDF15, we believe that p38MAPK inhibitors may be useful in reducing serum GDF15 in patients. This is important because in recent years, GDF15 has been increasingly associated as being a potential marker for many metastatic cancers (Selander et al., 2007; Brown et al., 2009; Kluger et al., 2011; Wallin et al., 2011).
We also demonstrated that small number of cancer cells maintained in vivo in an unattached condition could contribute to overall serum GDF15 levels comparable to that of a tumor mass. While the conditions in our experiment may not truly mimic the physiological conditions CTCs experience in vivo, we believe these results still support the possibility that CTCs could contribute to overall serum GDF15 concentration. We believe that this would justify future work proposing to study the relationship between serum GDF15 and CTCs in cancer patients.
Strong GDF15 staining within xenograft tumors was observed in regions where cells were palisading, which indicates the possibility that cells could be in the process of migration or invasion. We cannot conclude definitively that the cells are actively invading as IHC only allows us to study cells in a static state but the appearance of the cells do indicate the possibility of some cellular movement. Interestingly, cells in GDF15 positive regions also appear morphologically different from the GDF15 negative cells from visual examination. This staining was observed specifically in these regions and a vast majority of the tumor was negative for GDF15 staining. There is a significant portion of the tumor that is negative for GDF15 staining. While this did not demonstrate changes in cell morphology driving GDF15 expression in vivo, it reinforces the dynamic nature of GDF15 expression when compared to VEGF, another growth factor that can be influenced by the environment. Importantly, in vitro, VEGF up-regulation was not induced by changes to morphology brought about by loss of attachment (Supplementary Fig. 8). This difference further highlights the unique mechanism by which GDF15 expression is regulated through cell morphology, and is evidence that cells display different phenotypes in response to different changes to the external environment.
GDF15, also known as macrophage inhibitory cytokine-1 (MIC-1), is a member of the tumor growth factor beta (TGF-β) super-family and is expressed at low levels in normal tissue except placenta and seminal fluids (Hromas et al., 1997; Soucek et al., 2010). Early reports suggest that GDF15 plays a role in regulating immune response by inhibiting macrophage activation by TNF-α (Bootcov et al., 1997). In animal models of heart ischemia, GDF15 demonstrated a cardio-protective role after ischemia induction by regulating the recruitment and response of neutrophils to the site of injury (Khan et al., 2009; Kempf et al., 2011). This finding was extended to cancer as GDF15 could also contribute to the evasion of glioma cells from the immune system (Roth et al., 2010). It was also demonstrated that GDF15 has a role in inducing cachexia, another common symptom seen in late stage cancer patients (Johnen et al., 2007; Wakchoure et al., 2009). GDF15 could also regulate osteoclast formation demonstrating its importance in bone metastases, a common site of cancer metastatic lesions (Coleman, 2001; Mundy, 2002; Wakchoure et al., 2009). Recently, elevated serum GDF15 has been increasingly associated as a potential marker for many metastatic cancers, including but not limited to colon, melanoma and prostate cancer (Selander et al., 2007; Brown et al., 2009; Kluger et al., 2011; Wallin et al., 2011). This commonality among different cancer types highlights the importance of GDF15 in the field of cancer. In addition, a common complication cancer patients encounter when undergoing chemotherapy is the emergence of chemoresistant cancer cells. Interestingly, GDF15 has also been suggested to be responsible for conferring drug resistance to cancer cells (Proutski et al., 2009; Zhao et al., 2009). Not surprisingly then, elevated serum GDF15 has also been associated with a higher overall mortality risk which is indicative of the growing importance of GDF15 (Wiklund et al., 2010).
Given the potential roles of GDF15 in cancer and the ability to cancer cells to up-regulate expression of this gene upon encountering changes to morphology may explain how tumor cells escape the host immune response until successful colonization of a secondary site. Once metastases occur, cancer cells may continue to secrete GDF15 depending on the physical microenvironment, such as bone, which comprises of collagen I (Viguet-Carrin et al., 2006). Since GDF15 has also been reported to be involved in bone remodeling and cachexia, it may explain why metastatic prostate cancer patients experience loss of bone density and body weight (Wakchoure et al., 2009). Finally, the role of GDF15 in chemoresistance (Proutski et al., 2009; Zhao et al., 2009) could mean that chemoresistance is an inevitable outcome of any chemotherapy regimen that induces altered cell morphology. It may also mean that CTCs could be intrinsically chemoresistant. More work is needed to examine this relationship in detail.
We would like to propose the following model based on three observations: (1) CTCs exist within the circulatory system of cancer patient and there appears to be a positive relationship between the number of CTCs observed and the presence of metastatic disease (Allard et al., 2004; de Bono et al., 2008). (2) Patients with metastatic cancers have higher serum GDF15 levels. (3) As we observed in our work, cancer cells that experience a change in morphology up-regulate GDF15 expression as a consequence. Therefore, we propose that increased serum GDF15 in cancer patients is possibly a consequence of ongoing metastasis. As cancer cells start to intravasate into the circulatory system, they inevitably experience changes to cell morphology. This change in morphology activates signal transduction pathways that may result in GDF15 up-regulation. Furthermore, morphologically different circulatory tumor cells may also secrete GDF15 directly into the circulation that may possibly influence serum GDF15 levels directly, indicating that GDF15 could be used as a signature of invasive cells during metastasis or CTCs. Therefore, serum GDF15 could be used to identify cancer patients who require more aggressive treatment from those that do not. More work is needed to elucidate the exact nature of the relationship between serum GDF15 and CTCs.
We believe that GDF15 is but one of the many genes that exhibit altered expression in the face of changes in cell morphology. Identifying which other genes respond in the same way is important and will help us better understand cancer biology, particularly the onset of metastasis.
Supplementary Material
Acknowledgments
We would like to thank Dr. Donald S. Coffey and Dr. William B. Isaacs for their invaluable comments and Dr. Tamara Lotan for her help in interpreting immunohistochemistry results. This work was funded by NIH grants U54CA143803 (to RHG), R01GM075305 and U54CA143868 (to DW). The content is solely the responsibility of the authors and does not necessarily represent the official views of the National Cancer Institute or the National Institutes of Health.
Contract grant sponsor: NIH;
Contract grant numbers: U54CA143803, R01GM075305, U54CA143868.
Footnotes
Disclosure of potential conflict of interests: The authors declare that there are no potential conflicts of interest.
Author contributions: K.A. designed and performed experiments as well as analyzed and interpreted results, wrote manuscript. R.H.G. helped design experiments, interpreted results, and edited manuscript. Y.Z. provided technical assistance with animal experiments and immunohistochemistry and edited manuscript. D.V. assisted with performing animal experiments and edited manuscript. J.M.P. performed cell morphology analysis experiment, helped write, and edited manuscript. P.W. wrote Matlab code for automated cell morphological analysis and edited manuscript. D.W. helped design cell morphology analysis experiments and edited manuscript.
Supporting Information: Additional supporting information may be found in the online version of this article at the publisher's web-site.
Literature Cited
- Allard WJ, Matera J, Miller MC, Repollet M, Connelly MC, Rao C, Tibbe AG, Uhr JW, Terstappen LW. Tumor cells circulate in the peripheral blood of all major carcinomas but not in healthy subjects or patients with nonmalignant diseases. Clin Cancer Res. 2004;10:6897–6904. doi: 10.1158/1078-0432.CCR-04-0378. [DOI] [PubMed] [Google Scholar]
- Bootcov MR, Bauskin AR, Valenzuela SM, Moore AG, Bansal M, He XY, Zhang HP, Donnellan M, Mahler S, Pryor K, Walsh BJ, Nicholson RC, Fairlie WD, Por SB, Robbins JM, Breit SN. MIC-1, a novel macrophage inhibitory cytokine, is a divergent member of the TGF-beta superfamily. Proc Natl Acad Sci USA. 1997;94:11514–11519. doi: 10.1073/pnas.94.21.11514. [DOI] [PMC free article] [PubMed] [Google Scholar]
- Brown DA, Lindmark F, Stattin P, Balter K, Adami HO, Zheng SL, Xu J, Isaacs WB, Gronberg H, Breit SN, Wiklund FE. Macrophage inhibitory cytokine 1: A new prognostic marker in prostate cancer. Clin Cancer Res. 2009;15:6658–6664. doi: 10.1158/1078-0432.CCR-08-3126. [DOI] [PMC free article] [PubMed] [Google Scholar]
- Bubb MR, Spector I, Beyer BB, Fosen KM. Effects of jasplakinolide on the kinetics of actin polymerization. An explanation for certain in vivo observations. J Biol Chem. 2000;275:5163–5170. doi: 10.1074/jbc.275.7.5163. [DOI] [PubMed] [Google Scholar]
- Chen M, Zamora PO, Som P, Pena LA, Osaki S. Cell attachment and biocompatibility of polytetrafluoroethylene (PTFE) treated with glow-discharge plasma of mixed ammonia and oxygen. J Biomater Sci Polym Ed. 2003;14:917–935. doi: 10.1163/156856203322381410. [DOI] [PubMed] [Google Scholar]
- Chen WC, Wu PH, Phillip JM, Khatau SB, Choi JM, Dallas MR, Konstantopoulos K, Sun SX, Lee JS, Hodzic D, Wirtz D. Functional interplay between the cell cycle and cell phenotypes. Integr Biol (Camb) 2013;5:523–534. doi: 10.1039/c2ib20246h. [DOI] [PMC free article] [PubMed] [Google Scholar]
- Coleman RE. Metastatic bone disease: Clinical features, pathophysiology and treatment strategies. Cancer Treat Rev. 2001;27:165–176. doi: 10.1053/ctrv.2000.0210. [DOI] [PubMed] [Google Scholar]
- D'Addario M, Arora PD, Ellen RP, McCulloch CA. Interaction of p38 and Sp1 in a mechanical force-induced, beta 1 integrin-mediated transcriptional circuit that regulates the actin-binding protein filamin-A. J Biol Chem. 2002;277:47541–47550. doi: 10.1074/jbc.M207681200. [DOI] [PubMed] [Google Scholar]
- de Bono JS, Scher HI, Montgomery RB, Parker C, Miller MC, Tissing H, Doyle GV, Terstappen LW, Pienta KJ, Raghavan D. Circulating tumor cells predict survival benefit from treatment in metastatic castration-resistant prostate cancer. Clin Cancer Res. 2008;14:6302–6309. doi: 10.1158/1078-0432.CCR-08-0872. [DOI] [PubMed] [Google Scholar]
- DeMarzo AM, Nelson WG, Isaacs WB, Epstein JI. Pathological and molecular aspects of prostate cancer. Lancet. 2003;361:955–964. doi: 10.1016/S0140-6736(03)12779-1. [DOI] [PubMed] [Google Scholar]
- Desoize B, Gimonet D, Jardiller JC. Cell culture as spheroids: An approach to multicellular resistance. Anticancer Res. 1998;18:4147–4158. [PubMed] [Google Scholar]
- Fincham VJ, Chudleigh A, Frame MC. Regulation of p190 Rho-GAP by v-Src is linked to cytoskelet al disruption during transformation. J Cell Sci. 1999;112:947–956. doi: 10.1242/jcs.112.6.947. [DOI] [PubMed] [Google Scholar]
- Friedl P, Alexander S. Cancer invasion and the microenvironment: Plasticity and reciprocity. Cell. 2011;147:992–1009. doi: 10.1016/j.cell.2011.11.016. [DOI] [PubMed] [Google Scholar]
- Friedl P, Wolf K. Tumour-cell invasion and migration: Diversity and escape mechanisms. Nat Rev Cancer. 2003;3:362–374. doi: 10.1038/nrc1075. [DOI] [PubMed] [Google Scholar]
- Gabriel M, Dahm M, Vahl CF. Wet-chemical approach for the cell-adhesive modification of polytetrafluoroethylene. Biomed Mater. 2011;6:035007. doi: 10.1088/1748-6041/6/3/035007. [DOI] [PubMed] [Google Scholar]
- Geng WD, Boskovic G, Fultz ME, Li C, Niles RM, Ohno S, Wright GL. Regulation of expression and activity of four PKC isozymes in confluent and mechanically stimulated UMR-108 osteoblastic cells. J Cell Physiol. 2001;189:216–228. doi: 10.1002/jcp.10019. [DOI] [PubMed] [Google Scholar]
- Ghods AJ, Irvin D, Liu G, Yuan X, Abdulkadir IR, Tunici P, Konda B, Wachsmann-Hogiu S, Black KL, Yu JS. Spheres isolated from 9L gliosarcoma rat cell line possess chemoresistant and aggressive cancer stem-like cells. Stem Cells. 2007;25:1645–1653. doi: 10.1634/stemcells.2006-0624. [DOI] [PubMed] [Google Scholar]
- Gleason DF, Mellinger GT. Prediction of prognosis for prostatic adenocarcinoma by combined histological grading and clinical staging. J Urol. 1974;111:58–64. doi: 10.1016/s0022-5347(17)59889-4. [DOI] [PubMed] [Google Scholar]
- Hillmann G, Gebert A, Geurtsen W. Matrix expression and proliferation of primary gingival fibroblasts in a three-dimensional cell culture model. J Cell Sci. 1999;112:2823–2832. doi: 10.1242/jcs.112.17.2823. [DOI] [PubMed] [Google Scholar]
- Hromas R, Hufford M, Sutton J, Xu D, Li Y, Lu L. PLAB, a novel placental bone morphogenetic protein. Biochim Biophys Acta. 1997;1354:40–44. doi: 10.1016/s0167-4781(97)00122-x. [DOI] [PubMed] [Google Scholar]
- Isaacs WB, Carter BS, Ewing CM. Wild-type p53 suppresses growth of human prostate cancer cells containing mutant p53 alleles. Cancer Res. 1991;51:4716–4720. [PubMed] [Google Scholar]
- Johnen H, Lin S, Kuffner T, Brown DA, Tsai VW, Bauskin AR, Wu L, Pankhurst G, Jiang L, Junankar S, Hunter M, Fairlie WD, Lee NJ, Enriquez RF, Baldock PA, Corey E, Apple FS, Murakami MM, Lin EJ, Wang C, During MJ, Sainsbury A, Herzog H, Breit SN. Tumor-induced anorexia and weight loss are mediated by the TGF-beta superfamily cytokine MIC-1. Nat Med. 2007;13:1333–1340. doi: 10.1038/nm1677. [DOI] [PubMed] [Google Scholar]
- Kempf T, Zarbock A, Widera C, Butz S, Stadtmann A, Rossaint J, Bolomini-Vittori M, Korf-Klingebiel M, Napp LC, Hansen B, Kanwischer A, Bavendiek U, Beutel G, Hapke M, Sauer MG, Laudanna C, Hogg N, Vestweber D, Wollert KC. GDF-15 is an inhibitor of leukocyte integrin activation required for survival after myocardial infarction in mice. Nat Med. 2011;17:581–588. doi: 10.1038/nm.2354. [DOI] [PubMed] [Google Scholar]
- Khan SQ, Ng K, Dhillon O, Kelly D, Quinn P, Squire IB, Davies JE, Ng LL. Growth differentiation factor-15 as a prognostic marker in patients with acute myocardial infarction. Eur Heart J. 2009;30:1057–1065. doi: 10.1093/eurheartj/ehn600. [DOI] [PubMed] [Google Scholar]
- Kluger HM, Hoyt K, Bacchiocchi A, Mayer T, Kirsch J, Kluger Y, Sznol M, Ariyan S, Molinaro A, Halaban R. Plasma markers for identifying patients with metastatic melanoma. Clin Cancer Res. 2011;17:2417–2425. doi: 10.1158/1078-0432.CCR-10-2402. [DOI] [PMC free article] [PubMed] [Google Scholar]
- Lee JS, Panorchan P, Hale CM, Khatau SB, Kole TP, Tseng Y, Wirtz D. Ballistic intracellular nanorheology reveals ROCK-hard cytoplasmic stiffening response to fluid flow. J Cell Sci. 2006;119:1760–1768. doi: 10.1242/jcs.02899. [DOI] [PubMed] [Google Scholar]
- Lim YB, Kang SS, Park TK, Lee YS, Chun JS, Sonn JK. Disruption of actin cytoskeleton induces chondrogenesis of mesenchymal cells by activating protein kinase C-alpha signaling. Biochem Biophys Res Commun. 2000;273:609–613. doi: 10.1006/bbrc.2000.2987. [DOI] [PubMed] [Google Scholar]
- Lim YB, Kang SS, An WG, Lee YS, Chun JS, Sonn JK. Chondrogenesis induced by actin cytoskeleton disruption is regulated via protein kinase C-dependent p38 mitogen-activated protein kinase signaling. J Cell Biochem. 2003;88:713–718. doi: 10.1002/jcb.10389. [DOI] [PubMed] [Google Scholar]
- Liu T, Bauskin AR, Zaunders J, Brown DA, Pankhurst S, Russell PJ, Breit SN. Macrophage inhibitory cytokine 1 reduces cell adhesion and induces apoptosis in prostate cancer cells. Cancer Res. 2003;63:5034–5040. [PubMed] [Google Scholar]
- Liu H, Lin J, Roy K. Effect of 3D scaffold and dynamic culture condition on the global gene expression profile of mouse embryonic stem cells. Biomaterials. 2006;27:5978–5989. doi: 10.1016/j.biomaterials.2006.05.053. [DOI] [PubMed] [Google Scholar]
- Marrinucci D, Bethel K, Lazar D, Fisher J, Huynh E, Clark P, Bruce R, Nieva J, Kuhn P. Cytomorphology of circulating colorectal tumor cells: A small case series. J Oncol. 2010;2010:861341. doi: 10.1155/2010/861341. [DOI] [PMC free article] [PubMed] [Google Scholar]
- McBeath R, Pirone DM, Nelson CM, Bhadriraju K, Chen CS. Cell shape, cytoskeletal tension, and RhoA regulate stem cell lineage commitment. Dev Cell. 2004;6:483–495. doi: 10.1016/s1534-5807(04)00075-9. [DOI] [PubMed] [Google Scholar]
- Morton WM, Ayscough KR, McLaughlin PJ. Latrunculin alters the actin-monomer subunit interface to prevent polymerization. Nat Cell Biol. 2000;2:376–378. doi: 10.1038/35014075. [DOI] [PubMed] [Google Scholar]
- Mundy GR. Metastasis to bone: Causes, consequences and therapeutic opportunities. Nat Rev Cancer. 2002;2:584–593. doi: 10.1038/nrc867. [DOI] [PubMed] [Google Scholar]
- Namiki A, Brogi E, Kearney M, Kim EA, Wu T, Couffinhal T, Varticovski L, Isner JM. Hypoxia induces vascular endothelial growth factor in cultured human endothelial cells. J Biol Chem. 1995;270:31189–31195. doi: 10.1074/jbc.270.52.31189. [DOI] [PubMed] [Google Scholar]
- Proutski I, Stevenson L, Allen WL, McCulla A, Boyer J, McLean EG, Longley DB, Johnston PG. Prostate-derived factor—A novel inhibitor of drug-induced cell death in colon cancer cells. Mol Cancer Ther. 2009;8:2566–2574. doi: 10.1158/1535-7163.MCT-09-0158. [DOI] [PubMed] [Google Scholar]
- Roth P, Junker M, Tritschler I, Mittelbronn M, Dombrowski Y, Breit SN, Tabatabai G, Wick W, Weller M, Wischhusen J. GDF-15 contributes to proliferation and immune escape of malignant gliomas. Clin Cancer Res. 2010;16:3851–3859. doi: 10.1158/1078-0432.CCR-10-0705. [DOI] [PubMed] [Google Scholar]
- Russo J, Tait L, Russo IH. Morphological expression of cell transformation induced by c-Ha-ras oncogene in human breast epithelial cells. J Cell Sci. 1991;99:453–463. doi: 10.1242/jcs.99.2.453. [DOI] [PubMed] [Google Scholar]
- Schedin P, Keely PJ. Mammary gland ECM remodeling, stiffness, and mechanosignaling in normal development and tumor progression. Cold Spring Harb Perspect Biol. 2011;3:a003228. doi: 10.1101/cshperspect.a003228. [DOI] [PMC free article] [PubMed] [Google Scholar]
- Selander KS, Brown DA, Sequeiros GB, Hunter M, Desmond R, Parpala T, Risteli J, Breit SN, Jukkola-Vuorinen A. Serum macrophage inhibitory cytokine-1 concentrations correlate with the presence of prostate cancer bone metastases. Cancer Epidemiol Biomarkers Prev. 2007;16:532–537. doi: 10.1158/1055-9965.EPI-06-0841. [DOI] [PubMed] [Google Scholar]
- Shim M, Eling TE. Protein kinase C-dependent regulation of NAG-1/placental bone morphogenic protein/MIC-1 expression in LNCaP prostate carcinoma cells. J Biol Chem. 2005;280:18636–18642. doi: 10.1074/jbc.M414613200. [DOI] [PubMed] [Google Scholar]
- Shim M, Eling TE. Vitamin E succinate induces NAG-1 expression in a p38 kinase-dependent mechanism. Mol Cancer Ther. 2008;7:961–971. doi: 10.1158/1535-7163.MCT-07-0470. [DOI] [PMC free article] [PubMed] [Google Scholar]
- Soucek K, Slabakova E, Ovesna P, Malenovska A, Kozubik A, Hampl A. Growth/differentiation factor-15 is an abundant cytokine in human seminal plasma. Hum Reprod. 2010;25:2962–2971. doi: 10.1093/humrep/deq264. [DOI] [PubMed] [Google Scholar]
- Stott SL, Hsu CH, Tsukrov DI, Yu M, Miyamoto DT, Waltman BA, Rothenberg SM, Shah AM, Smas ME, Korir GK, Floyd FP, Jr, Gilman AJ, Lord JB, Winokur D, Springer S, Irimia D, Nagrath S, Sequist LV, Lee RJ, Isselbacher KJ, Maheswaran S, Haber DA, Toner M. Isolation of circulating tumor cells using a microvortex-generating herringbone-chip. Proc Natl Acad Sci USA. 2010;107:18392–18397. doi: 10.1073/pnas.1012539107. [DOI] [PMC free article] [PubMed] [Google Scholar]
- Viguet-Carrin S, Garnero P, Delmas PD. The role of collagen in bone strength. Osteoporos Int. 2006;17:319–336. doi: 10.1007/s00198-005-2035-9. [DOI] [PubMed] [Google Scholar]
- Wakchoure S, Swain TM, Hentunen TA, Bauskin AR, Brown DA, Breit SN, Vuopala KS, Harris KW, Selander KS. Expression of macrophage inhibitory cytokine-1 in prostate cancer bone metastases induces osteoclast activation and weight loss. Prostate. 2009;69:652–661. doi: 10.1002/pros.20913. [DOI] [PubMed] [Google Scholar]
- Wallin U, Glimelius B, Jirstrom K, Darmanis S, Nong RY, Ponten F, Johansson C, Pahlman L, Birgisson H. Growth differentiation factor 15: A prognostic marker for recurrence in colorectal cancer. Br J Cancer. 2011;104:1619–1627. doi: 10.1038/bjc.2011.112. [DOI] [PMC free article] [PubMed] [Google Scholar]
- Wang J, Fan J, Laschinger C, Arora PD, Kapus A, Seth A, McCulloch CA. Smooth muscle actin determines mechanical force-induced p38 activation. J Biol Chem. 2005;280:7273–7284. doi: 10.1074/jbc.M410819200. [DOI] [PubMed] [Google Scholar]
- Weaver VM, Petersen OW, Wang F, Larabell CA, Briand P, Damsky C, Bissell MJ. Reversion of the malignant phenotype of human breast cells in three-dimensional culture and in vivo by integrin blocking antibodies. J Cell Biol. 1997;137:231–245. doi: 10.1083/jcb.137.1.231. [DOI] [PMC free article] [PubMed] [Google Scholar]
- Webb K, Li W, Hitchcock RW, Smeal RM, Gray SD, Tresco PA. Comparison of human fibroblast ECM-related gene expression on elastic three-dimensional substrates relative to two-dimensional films of the same material. Biomaterials. 2003;24:4681–4690. doi: 10.1016/s0142-9612(03)00368-5. [DOI] [PubMed] [Google Scholar]
- Wiklund FE, Bennet AM, Magnusson PK, Eriksson UK, Lindmark F, Wu L, Yaghoutyfam N, Marquis CP, Stattin P, Pedersen NL, Adami HO, Gronberg H, Breit SN, Brown DA. Macrophage inhibitory cytokine-1 (MIC-1/GDF15): A new marker of all-cause mortality. Aging Cell. 2010;9:1057–1064. doi: 10.1111/j.1474-9726.2010.00629.x. [DOI] [PMC free article] [PubMed] [Google Scholar]
- Zare-Mehrjardi N, Khorasani MT, Hemmesi K, Mirzadeh H, Azizi H, Sadatnia B, Hatami M, Kiani S, Barzin J, Baharvand H. Differentiation of embryonic stem cells into neural cells on 3D poly (d, l-lactic acid) scaffolds versus 2D cultures. Int J Artif Organs. 2011;34:1012–1023. doi: 10.5301/ijao.5000002. [DOI] [PubMed] [Google Scholar]
- Zhao L, Lee BY, Brown DA, Molloy MP, Marx GM, Pavlakis N, Boyer MJ, Stockler MR, Kaplan W, Breit SN, Sutherland RL, Henshall SM, Horvath LG. Identification of candidate biomarkers of therapeutic response to docetaxel by proteomic profiling. Cancer Res. 2009;69:7696–7703. doi: 10.1158/0008-5472.CAN-08-4901. [DOI] [PubMed] [Google Scholar]
Associated Data
This section collects any data citations, data availability statements, or supplementary materials included in this article.