

Abstract
Adeno-associated viral (AAV) vectors show great promise for gene therapy because of their excellent safety profile; however, development of robust dose-determining assays for AAV has presented a significant challenge. With the ultimate goal of future harmonization and standardization of AAV dose determination assays, we systematically analyzed the influence of key variables, including sample preparation procedure, the choice of primers, and real-time quantitative PCR (qPCR) target sequences and calibration DNA conformation on the qPCR quantitation of AAV products. Our results emphasize the importance of designing qPCR primers and conducting sample preparation and demonstrate the need for extensive characterization, vigorous control, and use of reference materials in clinical dose determination.
Introduction
Adeno-associated viral (AAV) vectors show great promise for gene therapy because of their excellent safety profile; however, development of robust dose-determining assays for AAV has presented a significant challenge. The conventional transduction assays, which quantify transgene expression directly in target cells and have been widely used in most gene therapy vector quantitation, are not applicable to AAV vectors. This is because AAV vectors encapsidate transcriptionally inactive single-stranded DNA genomes that fail to undergo viral second-strand DNA synthesis and DNA strand annealing. They thus become helper dependent and show low and unquantifiable efficiency of transgene expression in the absence of a helper function.1 Available AAV transduction assays thus far have been dependent on helper functions that are provided by either helper plasmids or one of many potential helper viruses, for example, adenovirus, herpes simplex virus, or papilloma virus; in addition, a wide range of target cell lines can be used in AAV transduction assays, including HeLa,2–5 C12,6 COS-7,7 and 293T cells.8–10 The potential diversity in the choice of helper viruses and the combinations of target cell and helper virus significantly increase assay variation and limit the comparability among data generated. Furthermore, the majority of helper-dependent assays developed thus far have a specific and distinct readout, for example, the number of plaques or vector genome copies, level of protein, or mRNA expression,2–10 which further compromises the interpretation and comparability of results obtained in various laboratories. As a result, helper-dependent transduction assays have been reported to have 1000- to 20-fold lower transduction titers relative to physical genome titers using dot-blot, optical density, or real-time quantitative PCR (qPCR) methods, indicating a potential 1000-fold discrepancy between transduction units and physical titers.2,4–6,9 AAV dose determination is becoming ever-increasingly critical to ensure product potency and safety and to enable valid comparison of results among various laboratories.
The encapsidated AAV vector genome is a key mediator and indicator of therapeutic effect. The closest representation of AAV titers after transgene expression, that is, the measurement of vector genomes by quantitative real-time PCR (qPCR), often referred to as physical genome titration of AAV vectors, has been the preferred and widely accepted method for the quantitation and frequently the clinical dose determination of AAV products.11–14 AAV physical genome titration by qPCR is AAV serotype, helper virus, and cell system independent, bypassing the complexity, variation, and inconsistency associated with helper-dependent transduction assays; however, a significant number of issues still remain for current qPCR quantitation of AAV vectors. For example, because of inefficient primer binding to DNA, compared with dot-blotting with an isotope-labeled ∼500-bp DNA fragment, qPCR can underestimate AAV genome titers by 5- to 10-fold.15 The use of different forms of plasmid DNA as a calibration standard can significantly impact on AAV genome quantitation. It has been reported that the use of circular or supercoiled forms of plasmid DNA as a quantitation standard can lead to the overestimation of AAV titers by 7-fold compared with quantitation based on a linear plasmid DNA standard.6,15,16 A potential 10-fold underestimation of self-complementary AAV (scAAV) vectors by qPCR has also been reported, due to the presence of a closed ITR hairpin.17,18 Interassay variation in qPCR may also result from sample preparation involving a multistep procedure of capsid protein digestion, encapsidated DNA extraction, and purification. All these factors lead to variability in assessed vector titers both within a single laboratory and more widely, among different laboratories. Considerable effort has been made to improve available qPCR methods and to investigate alternative methods for dose determination.19,20 These include the development of a universal qPCR method based on amplifying an AAV2 ITR-specific sequence,17 particle titration by optical density,21 ion-exchange chromatography,20 or infrared fluorescence scanning.22
With the aim of standardizing future AAV dose determination assays, we systematically analyzed the influence of sample preparation, amplicon sequences, and standard templates on the quantitation of AAV vector genome copies. Our results show that primer design and the choice of qPCR target sequences had a profound influence on AAV quantitation. Standard DNA conformation influences qPCR quantitation; this is target sequence dependent and can be optimized by qPCR primer design.
Materials and Methods
Vector production
AAV vectors were produced from three plasmids: pHelper (Stratagene/Agilent, La Jolla, CA), pAAV-RC encoding AAV Rep-Cap, and pAAV2-hrGFP (Stratagene/Agilent). Plasmid pAAV-2/8-RC was kindly provided by J. Wilson (University of Pennsylvania, Philadelphia, PA). All vectors were produced by transient transfection of human embryonic kidney 293T cells (Stratagene/Agilent), using the calcium phosphate HEPES-buffered saline (HBS) method.23 Vector producer cells were harvested and subjected to five freeze–thaw cycles to release vector particles, and cellular debris was removed by centrifugation at 2000×g for 15 min. The vector-containing supernatant was then filtered through 0.45-μm (pore size) filters (Merck Millipore, Nottingham, UK), incubated with 0.5% sodium deoxycholate (Sigma-Aldrich, Poole, UK) and Benzonase nuclease (50 units/ml) for 30 min at 37°C, and diluted with 20 mM Bis-Tris propane buffer before chromatography.
Anion-exchange chromatography
A Gilson high-performance liquid chromatography (HPLC) system (Anachem, Luton, UK) was used for chromatography, and was equipped with an ultraviolet detector (Gilson model 119), pump (Gilson model 306), autosampler (Gilson model 231XL), and fraction collector (Gilson model FC203B), both fitted with temperature-controlled racks connected to a refrigerated recirculating water bath (Grant Instruments, Cambridge, UK; from Scientific Laboratory Supplies, Wilford, UK), which also cooled the water-jacketed column. The system was controlled with Gilson UniPoint software. An XK 16/26 column (Amersham/GE Healthcare, Little Chalfont, UK) was packed to contain a bed volume of 5 ml of AVB Sepharose high-performance medium (GE Healthcare, Uppsala, Sweden), and used according to the manufacturer's protocol. Purified vector particle samples were pooled and dialyzed to equilibrate into phosphate-buffered saline (PBS) in a 10K MWCO (molecular weight cutoff) Slide-A-Lyzer dialysis cassette (Life Technologies/Thermo Fisher Scientific, Carlsbad, CA) and concentrated to 1:20 of the initial volume, using Ultra 5K MWCO centrifugal filter devices (Merck Millipore) before being subjected to vector quantitation.
Total protein was measured with a Pierce bicinchoninic acid (BCA) protein assay kit (Pierce Biotechnology/Thermo Fisher Scientific, Rockford, IL). The identity and the predicted amount of capsid proteins were visualized with a SilverXpress staining kit (Life Technologies/Thermo Fisher Scientific) according to the manufacturer's protocol.
Viral genome extraction
Two methods were used to extract AAV vector DNA from purified AAV vectors. Method A used a treatment protocol incorporating incubation with DNase I and proteinase K, that is, 5 μl of vector was treated with 50 units of DNase I (Life Technologies/Thermo Fisher Scientific) at 37°C for 1 hr to remove residual plasmid DNA in vector samples. After the inactivation of DNase I at 65°C for 10 min, proteinase K (0.4 unit) was then added and incubated at 50°C for 1 hr to release vector DNA from AAV capsids before being inactivated at 95°C for 20 min. Method B consisted of the removal of residual plasmid DNA with DNase I and proteinase K, followed by the extraction of vector DNA using a spin column (DNeasy blood and tissue kit; Qiagen, Manchester, UK).
To test the efficiency of DNase I and proteinase K treatments, replicates of a crude sample (before HPLC) and HPLC-purified AAV sample were spiked with 1.25×10¹⁰ copies of the AAV-independent plasmid pRRLSIN.cPPT.PGK-GFP.WPRE (plasmid 12252; Addgene, Cambridge, MA) encoding lentiviral vector sequences. The spiked AAV samples were prepared by method A. Half the sample was retained after DNase I treatment and half was further treated with proteinase K as described previously.
Primers, probes, and plasmids
All DNA oligonucleotides were purchased from Sigma-Aldrich. All hydrolysis probes were dual labeled with 6-FAM on the 5′ end and TAMRA on the 3′ end and were purchased from Sigma-Aldrich. All oligonucleotides and probes were reconstituted in PCR-grade water (Sigma-Aldrich) to stock solution at the concentration of 100 μM and diluted to a 10 μM working solution before use. The sequences of primers and probes are given in Table 1. Primers were initially tested by end point PCR with an Eppendorf Mastercycler pro S (Eppendorf, Stevenage, UK), using the gradient function. Briefly, 50-ng plasmid DNAs used to generate standard curves were incubated with a 200 nM concentration of each primer, 400 μM dNTPs (Promega, Southampton, UK), 2 mM MgCl2 (Promega), and 2.5 units of GoTaq DNA polymerase (Promega). Cycling conditions were 94°C for 3 min followed by 30 cycles of 94°C for 30 sec, annealing between 55 and 65°C for 30 sec, and 72°C for 1 min. DNA amplicons were visualized by agarose gel electrophoresis.
Table 1.
Real-Time Quantitative PCR Primer and Probe Sequences
| Target | ID | Sequence (5′→3′)a | Tm (°C) | Amplicon (bp) |
|---|---|---|---|---|
| CMV promoter | CMV-F | TTC CTA CTT GGC AGT ACA TCT ACG | 70 | 129 |
| CMV-R | GTC AAT GGG GTG GAG ACT TGG | 66 | ||
| CMV-P | TGA GTC AAA CCG CTA TCC ACG CCC A | 78 | ||
| AAV2 ITRb | ITR-F | GGA ACC CCT AGT GAT GGA GTT | 64 | 62 |
| ITR-R | CGG CCT CAG TGA GCG A | 54 | ||
| ITR-P | CAC TCC CTC TCT GCG CGC TCG | 72 | ||
| Humanized Renilla green fluorescent proteinc | hrGFP-F | GAT CCG CAG CGA CAT CAA CC | 64 | 136 |
| hrGFP-R | GTA CAC CAC CTC GAA GCT GG | 64 | ||
| hrGFP-P | GAG GAG ATG TTC GTG TAC CGC GTG G | 80 | ||
| SV40 polyadenylation signal | SV40-F | AGC AAT AGC ATC ACA AAT TTC ACA A | 70 | 96 |
| SV40-R | CCA GAC ATG ATA AGA TAC ATT GA | 62 | ||
| SV40-P | AGC ATT TTT TTC ACT GCA TTC TAG TTG TGG TTT GTC | 98 |
AAV2, adeno-associated virus serotype 2; CMV, cytomegalovirus; F, forward; ITR, inverted terminal repeat; P, probe; R, reverse; SV40, simian virus 40; Tm, annealing temperature.
Hydrolysis probes were dual-labeled with 6-FAM at the 5′ end and TAMRA at the 3′ end.
From Aurnhammer and colleagues.16
Designed to EF186083.1.
The plasmid DNA pAAV2-hrGFP was used to generate a standard curve for qPCRs targeting ITR, GFP, or CMV sequences; plasmid pAAV-RC2/8 was used for qPCR targeting of the AAV replicase and capsid sequences and plasmid pRRLSIN.cPPT.PGK-GFP.WPRE was used for targeting simian virus 40 (SV40). All plasmids were purified with a plasmid giga kit (Qiagen) and characterized by restriction endonuclease digestion. The concentration and purity of the plasmid DNAs were determined by spectrophotometric analysis with a NanoDrop 1000 (Thermo Fisher Scientific, Waltham, MA). The linear form of plasmid DNA pAAV2-hrGFP was also used as a standard in qPCRs. Briefly, circular plasmid pAAV2-hrGFP was digested with ScaI restriction enzyme in accordance with the manufacturer's protocol (New England BioLabs, Ipswich, MA). Linear plasmid was further purified with a QIAquick PCR purification kit (Qiagen) according to the manufacturer's recommendations.
Quantitative real-time PCR analysis
Quantitative real-time PCR (qPCR) was performed with a Roche LightCycler 480 real-time PCR system (Roche, Mannheim, Germany). All PCRs were performed in a 20-μl final volume with PCR primers (300 nM each) and 200 nM probe, and using a LightCycler 480 probes master kit (Roche), 2 μl of template DNA (plasmid standard, or sample DNA extracted by method A), or 8 μl of template DNA (sample DNA extracted by method B). The volumes used ensured the same volume of starting sample was present in each PCR regardless of extraction method. qPCR was carried out with an initial denaturation step at 95°C for 10 min, followed by 45 cycles of denaturation at 95°C for 15 sec and annealing/extension at 60°C for 30 sec. All samples were tested in triplicate and a “no template DNA” negative control was included to monitor sample cross-contamination. Seven serial dilutions of a plasmid standard (containing 108, 107, 106, 105, 104, 103, and 102 copies of plasmid DNA) were used to generate a standard curve for absolute quantification of vector samples. Analysis of qPCR results was carried out with LightCycler 480 software 1.5.0 version 1.5.0.39 (Roche). A cutoff Cq (quantification cycles) was determined for each assay, whereby any well with a Cq value greater than the mean Cq of the 102 standard was omitted from analysis, due to being out of the linear range of the assay. The fit points method for absolute quantification was used for analysis and the noise band and threshold were set to Auto. A correction factor of 2 was used for calculation of the ITR genome copy number to account for the presence of four copies of ITR in the plasmid standard, that is, 5′ and 3′ ITRs on both plus and minus DNA strands; whereas only two copies of ITR, that is, 5′ and 3′ ITRs, were in the single-stranded DNA vector particles.
Statistical analysis
Statistical analysis was carried out with GraphPad Prism 5 (GraphPad Software, La Jolla, CA). Data were tested for normality using the Kolmogorov–Smirnov test and then analyzed by one-way analysis of variance followed by Bonferroni's multiple comparison tests or a Kruskal–Wallis test followed by Dunn's multiple comparison tests. Differences were accepted to be statistically significant at p<0.05.
Results and Discussion
Optimization and validation of qPCR assay
To optimize conditions for real-time qPCR, end-point PCR was carried out for each pair of primers used (Table 1) to confirm the PCR products by agarose gel electrophoresis (data not shown) and to ensure that the annealing temperature used in qPCR was as high as possible to minimize nonspecific PCR amplification and at the same time without compromising amplification efficiency. As a result, an annealing temperature (Tm) of 60°C for ITR, GFP, and CMV primers and a Tm of 58°C for SV40 primers were selected for subsequent qPCR analyses.
The quantitative PCR assay was validated using a serial dilution of circular plasmid DNA to generate calibration curves for each primer set, that is, (1) plasmid pAAV2-hrGFP for ITR (Fig. 1A), GFP (Fig. 1B), and CMV (Fig. 1C) primers and (2) plasmid pRRLSIN.cPPT.PGK-GFP.WPRE for SV40 primers (Fig. 1D). Control samples of PBS and a blank well were also included in all qPCR analyses to monitor potential cross-contamination. The symbol Cq is used throughout the text as recommended by the MIQE (Minimum Information for Publication of Quantitative Real-Time PCR Experiments; www.rdml.org/miqe.php) guideline.24 The Cq values for all controls were greater than the cutoff Cq, that is, greater than the mean Cq of the 102 standard; therefore, the data for control samples are not shown. Only data sets with a control sample Cq greater than the cutoff Cq were considered valid and included in subsequent analyses. The amplification efficiency of qPCR was calculated using the equation: PCR efficiency (E)=10–1/slope – 1.24 Efficiency within the range of 0.9–1.1 was considered valid, where a value of 1 indicates 100% amplification efficiency (Table 2). The linear dynamic range for each experiment was also determined and confirmed to be 1×10⁸ to 1×10² copies for each target sequence. All r2 values were greater than 0.99 for each experiment (Fig. 1A–D), demonstrating the fidelity of sample dilutions and assay performance and the robustness of the results presented in this study.
Fig. 1.

Validation of calibration curves generated from circular pAAV2-hrGFP plasmid DNA standards with (A) ITR, (B) GFP, (C) CMV, and (D) SV40 primers. Efficiency (E) confirms that each calibration curve is within the acceptable range of 0.9–1.1. The correlation coefficient (r2) confirms that each curve has correlation greater than 0.99. Data shown represent the mean quantification cycle (Cq)±standard deviation.
Table 2.
PCR Amplification Efficiencies of Calibration Curves
| Plasmid | Target | PCR efficiencya | Confidence interval |
|---|---|---|---|
| pAAV2-hrGFP | CMV | 1.069 | 0.024 |
| ITR | 1.007 | 0.089 | |
| hrGFP | 0.982 | 0.017 |
hrGFP, humanized Renilla green fluorescent protein.
Data shown represent mean data calculated from all calibration curves used in the assays.
Influence of standard DNA conformation and target sequence on qPCR quantitation
Suppression of real-time PCR by uncut circular plasmid DNA has been previously reported by several groups,25,26 indicating a low amplification efficiency of a circular DNA compared with that of a linearized DNA plasmid under identical qPCR conditions. For a direct comparison, two AAV standard calibration curves were generated for each of the three qPCR target sequences ITR (Fig. 2A), GFP (Fig. 2B), and CMV (Fig. 2C), using uncut circular (dotted line) or ScaI-linearized (solid line) DNA plasmids. Figure 2 shows that the amplification efficiency (E), which is primarily governed by the annealing efficiency of primers to a target sequence and represents the quantitation accuracy, was within the designated range of 0.9–1.1 for all circular plasmid calibration curves (dotted lines; Fig. 2A–C) regardless of the PCR target sequences; however, E was greater than 1.1 for linear ITR (solid line; Fig. 2A) and GFP (solid line; Fig. 2B) plasmids, indicating a potentially lower amplification efficiency for circular DNA standards than for linear ITR and GFP plasmids. These results is in contrast to the early findings that circular plasmids suppressed qPCR amplification.15,16,25,26 Aurnhammer and colleagues16 have developed a universal qPCR method based on an AAV2 ITR-specific sequence, which has become widely used for AAV dose determination and allows a direct comparison of AAV titration results between laboratories. The observed difference in E between linear and circular ITR standard should be taken into account when using ITR qPCR quantitation. In contrast, the amplification efficiency of CMV target sequences was comparable between linear and circular plasmids (Fig. 2C), indicating that the influence of DNA conformation on qPCR quantitation may be target sequence dependent and may be optimized by qPCR primer design.
Fig. 2.
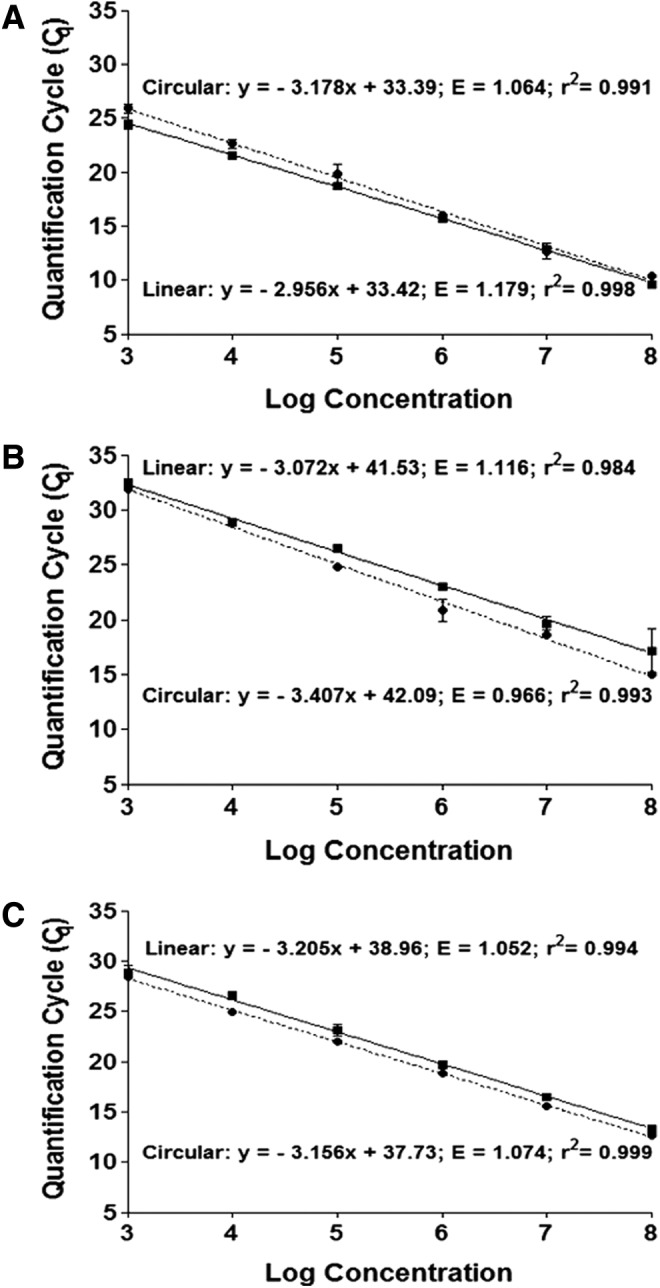
Comparison of calibration curves generated from circular (dotted lines) and ScaI-linearized (solid lines) pAAV2-hrGFP plasmid DNA standards with (A) ITR primers, (B) hrGFP primers, and (C) CMV primers. Data shown represent the mean quantification cycle (Cq)±standard deviation (n=3).
To further evaluate the influence of plasmid DNA conformation on AAV vector quantitation, three batches of AAV8 samples were subjected to qPCR targeting ITR, GFP, or CMV sequences and vector genome titers (VG/ml) were subsequently calculated on the basis of uncut circular or linear DNA calibration curves (Table 3). Although the amplification efficiency (E) in ITR and GFP qPCR was different between circular and linear plasmids (Fig. 2A and B), there was no significant difference in vector genome titers (p>0.05) between the quantitation based on circular and linear calibration curves for the same target sequences. On the basis of our data, circular plasmid DNA is adequate or may be a preferred standard for AAV8 vector quantitation, because when using linear DNA plasmid as a standard, the amplification efficiency in ITR and GFP qPCR (Fig. 3A and B) was out of the desired range (0.9–1.1) and may increase the risk of underestimating actual titers. There was no significant difference in vector genome titers among qPCRs targeting ITR, GFP, and CMV sequences (Table 3), indicating a nominal influence of qPCR target sequences on vector genome quantitation.
Table 3.
Effect of Standard DNA Conformation on AAV8 Titer Quantitation
| Titer (VG/ml) (n=9) | Target sequence | Titer (VG/ml) circular standards | Titer (VG/ml) linear standards |
|---|---|---|---|
| Batch 1 | ITR | 2.48±1.26×10⁹ | 2.81±1.53×10⁹ |
| GFP | 4.80±0.74×10⁹ | 2.15±0.35×10⁹ | |
| CMV | 2.35±1.03×10⁹ | 2.96±1.48×10⁹ | |
| Batch 2 | ITR | 1.41±0.33×10⁸ | 1.41±0.39×10⁸ |
| GFP | 1.14±0.59×10⁸ | 4.19±2.33×10⁸ | |
| CMV | 7.43±0.54×10⁸ | 1.10±0.79×10⁸ | |
| Batch 3 | ITR | 4.08±2.57×10⁷ | 3.45±2.16×10⁷ |
| GFP | 3.08±2.83×10⁷ | 8.41±0.76×10⁶ | |
| CMV | 2.48±1.28×10⁷ | 4.18±0.40×10⁷ |
GFP, green fluorescent protein; VG, vector genomes.
Fig. 3.

Effects of enzymatic treatments on qPCR analysis. A lentiviral vector plasmid carrying the SV40 sequence was used to spike crude (left) and HPLC-purified (middle) AAV8 samples and AAV2 (right) samples before HPLC purification at a vector concentration of 6.25×10¹³ copies/ml; qPCR analysis was performed, targeting spike-specific SV40 (hatched columns) and vector-specific sequences in AAV8 (gray columns) and AAV2 (cross-hatched columns); DNA copy number was determined on the basis of calibration curves generated from circular plasmid DNA standards. NT, no treatment; DT, treatment with Benzonase and DNase I; DT/PK, treatment with Benzonase and DNase I followed by proteinase K. Mean data are shown (n=3). Asterisks indicate statistical significance between crude and purified samples, where *p<0.05.
Hou and colleagues15 systematically analyzed the effect of standard DNA conformation on qPCR quantitation of four different target sequences and reported a greater than 7-fold overestimation of microalgal genome copies when using a circular compared with a linear pcna gene as a standard. The observed overestimation of genome copies was qPCR target sequence independent and was observed for four different target sequences tested. In contrast, our results (Fig. 3) showed that neither the standard DNA conformation (circular or linear) nor the qPCR target sequences (ITR, GFP, or CMV) had a significant effect on the final genome vector quantitation. The disagreement between our data and the findings of Hou and colleagues may be due to the difference in qPCR conditions adopted. The PCR conditions in the Hou and colleagues15 study included a single denaturation cycle of 95°C for only 3 min, whereas the qPCR conditions used in our study included an extended denaturation cycle of 95°C for 10 min for target sequences GFP and CMV, and 15 min for AAV2 ITR sequence, due to the extensive secondary hairpin structure formation of AAV2 ITR. Our study indicates that an extended denaturation cycle may be sufficient to overcome the qPCR suppression by circular DNA conformation and allow efficient primer binding to target sequences. In addition, the optimization of primer target sequences may minimize the qPCR suppression by DNA conformation, as shown in Fig. 2.
Influence of sample preparation on qPCR results
Transient transfection has been commonly used for the production of AAV vectors. During a transient transfection procedure, excessive amounts of plasmid DNAs are introduced to producer cells; typically 1012 copies of pAAV2-hrGFP, 4×10¹² copies of pAAV rep/cap, and 6×10¹¹ copies of pHelper plasmids are added to a transfection plate of 5×10⁶ cells. In general, a significant amount of plasmid DNA failed to enter cells and thus remained in the medium and subsequent vector harvest; as a result, enzymatic treatments with Benzonase and DNase I to remove untransfected plasmid DNAs in vector samples became a routine procedure in AAV sample preparation for qPCR. To systematically evaluate the effectiveness of the enzymatic treatment in removing excess plasmid DNA in vector harvests, we used an AAV-independent plasmid carrying a unique SV40 sequence to spike vector samples at a vector concentration of 6.25×10¹³ copies/ml. The choice of 6.25×10¹³ copies of SV40 DNA per milliliter to spike one qPCR is based on a typical amount of total input plasmid DNA in a corresponding amount of vector samples prepared. Three groups of vector samples were included in SV40 spike experiments, that is, (1) crude vectors with SV40 spike being directly added (Fig. 3, left), (2) purified vectors with spike DNA added after purification (Fig. 3, middle), and (3) purified vectors with spike DNA being added before purification, that is, the spike DNA had also been through an HPLC column with the vector samples (Fig. 3, right).
The left and middle panels of Fig. 3 show that without any enzymatic treatment (NT), 50.8±7.1 and 15.28±1.1% of the direct input spike SV40 DNA (total, 6.25×10¹³ copies/ml) were detected in crude vector samples (Fig. 3, left, NT hatched column) and prepurified vector samples (Fig. 3, middle, NT hatched column), respectively. The inability to detect the full amount of spike DNA may be due to interference with the qPCR by the excessive amount of spike DNA and the inaccuracy of qPCR quantitation based on the upper limit of qPCR detection (a qPCR standard of 1010–102 copies/well). It is noteworthy that without NT treatment, 15.04±7.3% of input spike DNA in the vector samples was detected after HPLC purification (Fig. 3, right, NT hatched column), indicating the inefficiency of the adopted purification step in removing input plasmid DNA. After Benzonase and DNase I treatment (DT), the spike SV40 signal became undetectable in all three groups of vector samples tested (Fig. 3, DT hatched columns), demonstrating the robustness of Benzonase and DNase I treatment in removing excessive spike DNA from vector samples.
Combined treatment with DT and subsequently with proteinase K (DT/PK), which digests vector capsid protein and allows the amplification of packaged DNA inside vector particles, resulted in the detection of 1.66±0.11×10⁶ and 1.73±0.59×10⁶ copies/ml of SV40 DNA in crude and purified vectors (Fig. 3, left and middle, DT/PK hatched columns), respectively, which is equivalent to 0.1% of crude vector genomes (1.12±0.13×10⁹ VG/ml; Fig. 3, DT/PK gray column) and 0.006% of purified vector genomes (2.24±0.44×10¹⁰ VG/ml; Fig. 3, DT/PK gray column). The detection of spike SV40 DNA may indicate the potential of SV40 DNA from producer cells being packaged inside vector particles. To rule out the possibility that the detection of SV40 inside AAV8 particles was due to nonspecific amplification of homologous vector DNA, we performed sequence analysis and found no sequence homology between the SV40 primers and the entire AAV vector sequences; therefore, the detection of SV40 DNA was SV40 sequence specific. In addition, the lentiviral SV40 plasmid DNA was added directly to the vector samples and was not added to the producer 293T cells that had been transformed after introducing SV40 DNA to the parental HEK293 cells; therefore it is believed that AAV vectors were able to package “cellular” SV40 DNA into the particles. There was no SV40 DNA detected in DT- and DT/PK-treated AAV2 vectors (Fig. 3, right), indicating a potential difference between AAV2 and AAV8 in DNA packaging.
SV40-spiked vector samples were also analyzed for vector-specific sequences for AAV8 vectors (Fig. 3, gray columns) and for AAV2 (Fig. 3, cross-hatched columns) to evaluate the efficiency of enzymatic treatments in removing untransfected AAV plasmids. Figure 3 showed that up to 8×10⁸ and ∼4×10¹⁰ copies of GFP plasmid DNA per milliliter, an equivalent 0.2% of input AAV plasmid DNA, were detected in untreated (NT) crude and purified AAV8 vector samples (Fig. 3, left and middle, NT gray columns), respectively, indicating a trace amount of plasmid DNA being left over in vector samples. AAV8 samples (Fig. 3, left and middle) treated with Benzonase and DNase I (DT) were negative for vector sequence as for the spike SV40 DNA (Fig. 3, left and middle, DT), confirming the robustness of the Benzonase and DNase I treatment (DT) in removing residual AAV plasmids. Although some laboratories have showed that heating at 95°C alone can release vector DNA from AAV particles, our data on AAV8 samples clearly showed that the 95°C step during the qPCR cycle was insufficient to release vector DNA from AAV8 particles, as evidenced by the absence of signal in the DT-only samples (Fig. 3, left and middle, DT), which led us and other groups27 to include PK treatment in sample preparation. After treatment with DT/PK, which allowed the quantitation of packaged vector genome inside the AAV8 capsid, vector samples showed up to 2×10⁹ and 2×10¹⁰ VG/ml in crude and purified samples, respectively, reflecting the PK release of vector DNA from AAV capsids and a 10-fold concentration during the purification procedure.
The right panel of Fig. 3 shows vector DNA analysis for AAV2 vectors after NT, DT, and DT/PK treatments. In contrast to AAV8 vectors, a significant amount of vector DNA sequences, that is, up to 7×10¹² copies/ml, an equivalent of 70% of input plasmid DNA, was detected in untreated (NT) AAV2 samples (Fig. 3, right, NT cross-hatched column), compared with 0.2% of input vector DNA detected in untreated (NT) AAV8 samples (Fig. 3, left and middle, NT solid columns), indicating that heating at 95°C alone during qPCR cycle may have released vector DNA from AAV2 capsids, which was confirmed by the detection of a comparable amount of vector DNA, that is, up to 3×10¹⁰ VG/ml, in DT- and DT/PK-treated AAV2 samples. Lock and colleagues28 have reported a 2.4-fold increase in titer of scAAV (serotype was not indicated) and American Type Culture Collection (ATCC, Manassas, VA)-certified Reference Materials (AAV2) when using DT/PK versus DT alone. Raparolu and colleagues28 reported that the AAV2 vector is the least, and AAV5 the most, thermal-stable vector; in particular, the melting temperatures for AAV5 and AAV8 are about 91 and 79°C, respectively, whereas for AAV2 it is 69°C; which may explain our observed difference in thermal release of vector DNA between AAV2 and AAV8 vectors.
Influence of buffer–protein complex on qPCR quantitation
To investigate the effects of buffer, enzyme, and capsid proteins presented when using method A on qPCR results, we carried out qPCR of 108 to 101 copies of vector plasmid DNA in (1) H2O (Fig. 4A, cross-hatched columns), (2) DT buffer only (open columns), (3) buffer/inactivated DT (hatched columns) and (4) buffer/inactivated DT/PK/heat at 95°C (solid columns). Figure 4 shows that qPCR of plasmid DNA in buffer/inactivated DT/PK (solid columns) gave the closest results to that of plasmid DNA in H2O (Fig. 4A, cross-hatched columns), for example, 1.88±0.3×10 and 1.22±0.22×10⁶ copies of plasmid DNA detected from 108 and 107 copies of plasmid DNA, respectively; whereas both buffer alone (Fig. 4A, open columns) and buffer/inactivated DT (Fig. 4A, hatched columns) showed significantly lower detection of plasmid DNA than that of qPCR in H2O, demonstrating significant buffer effects on qPCR quantitation. When using the qPCR results of qPCR plasmid DNA under different conditions to generate calibration standard curves, qPCR in H2O (Fig. 4B, solid line) showed both R2 and amplification efficiency (E) within the desired range (R2>0.99, E=0.9–1.1) and six data points within a linear range. However, the R2 and E values of plasmid DNA in buffer (R2=0.86, E=1.6), DT (R2=0.82, E=1.8), and DT/PK (R2=0.95, E=1.4) were all out of the desired range, with the qPCR in buffer/DT/PK showing a linear range and R2 and E values closest to qPCR in H2O, demonstrating the importance of using comparable buffer–protein mix to generate a standard curve for titer calculation.
Fig. 4.

Systematic analysis of buffer effects on qPCR quantitation of plasmid DNA. (A) qPCR results of 108 to 101 copies of vector plasmid DNA performed in (1) H2O (cross-hatched columns), (2) DT buffer only (open columns), (3) buffer/inactivated DT (hatched columns), and (4) buffer/inactivated DT/PK/heat at 95°C (solid columns); (B) calibration curves generated from qPCR of plasmid DNA in various buffers, showing data linear range, R2 and amplification E values (n=3).
A column purification step has been added, after enzymatic DT/PK treatment, to AAV sample preparation as described by other laboratories. For the convenience of method comparison, we termed the enzymatic DT/PK treatment as method A and the combined treatment with method A and column purification as method B. Typically, method A would generate unpurified samples containing vector DNA, digested vector capsid, and cellular proteins and inactivated enzymes; in contrast, method B resulted in the preparation of purified vector DNA free from enzymes, capsid, and cellular proteins. Control PBS samples free of AAV vectors were first subjected to the whole process of sample preparation, using methods A or B, to monitor potential method influence and cross-contamination risk during sample preparation. Figure 5 shows that 66% of processed PBS control samples showed copy numbers greater than the set Cq cutoff value (dashed lines), indicating a valid detection value and potentially the cross-contamination of AAV DNA sequence during sample preparation. In particular, control samples prepared by column-based method B showed significantly higher amplification background compared with enzymatic treatment alone (method A) (p<0.05), reflecting an increased likelihood of cross-contamination from multistep processing.
Fig. 5.

Comparison of amplification background signals obtained from PBS control samples after treatment by method A or method B and calculated on the basis of circular [(A), (C), and (E)] or linear [(B), (D), and (F)] plasmid DNA, using ITR primers (A and B), GFP primers (C and D), or CMV primers (E and F). Dashed lines indicate the set Cq cutoff value and a valid detection value, and potentially the cross-contamination of AAV DNA sequence during sample preparation when the copy number is above the dashed lines (n=3). ns, not significantly different.
Four batches of AAV8 vectors, including two high-titer clinical-grade batches (Fig. 6, batches 1 and 2) and two batches of low-titer AAV8 samples (batches 3 and 4; Fig. 6) were prepared by method A (hatched columns; Fig. 6) or method B (gray columns; Fig. 6) and were then qPCR quantified using target sequence ITR (Fig. 6A), GFP (Fig. 6B), or CMV (Fig. 6C). Figure 6 shows that when a statistically significant method variation (p<0.05, indicated by asterisks) was observed, for example, in high-titer clinical-grade samples (batches 1 and 2), the samples treated by method B (Fig. 6A and B, gray columns) showed significantly higher titers than the samples treated by method A, indicating potential interference of capsid proteins in vector quantitation and the importance of sample purity in sample quantitation. It is possible that the method B-associated high titer might partially be due to the increased background detection during the multistep method B (Fig. 6). It is also noteworthy that significant method variation was less apparent in low-titer samples (batches 3 and 4) (<108 VG/ml). This may be due to the loss of the low concentrations of vector DNA during column purification. A typical clinical batch of AAV8 product has a titer exceeding 1012 VG/ml; therefore, on the basis of our results, it is important to include an additional purification step in sample preparation for qPCR quantitation, particularly when using generic ITR qPCR quantitation. Our study also shows that method variations were qPCR target sequence dependent, as no significant variation was observed in qPCR targeting the CMV sequence (Fig. 6E and F), which is in contrast to qPCR targeting ITR (Fig. 6A and B) and GFP (Fig. 6C and D) sequences.
Fig. 6.

Comparison of AAV genome titers in samples prepared by method A (hatched columns) or method B (gray columns). Vector titers (VG/ml) were calculated on the basis of circular plasmid [(A), (C), and (E)] or linear plasmid [(B), (D), and (F)], using ITR primers (A and B), GFP primers (C and D), or CMV primers (E and F). Data shown represent mean data of nine PCRs of the same sample extracted in triplicates and then qPCR in triplicate (n=9). Asterisks indicate statistical significance observed between the two methods, where *p<0.05, **p<0.01, ***p<0.001.
Figure 7 shows qPCR of the validated ATCC AAV2 Reference Materials (rAAV2-RSS, ATCC VR-1616) with a given titer of 3.28×10¹⁰ VG/ml (Fig. 7, solid column), to study the effect of sample preparation, DNA conformation, and qPCR buffer conditions on AAV titer quantitation. It is noteworthy that all our data were significantly different from the given RSS (Reference Standard Stock) titers, regardless of preparation methods, DNA conformation, or standard curves used, demonstrating the intrinsic variation of qPCR quantitation. Three sets/panels of data are presented in Fig. 7, that is, (1) RSS being added to cell lysate to generate artificial crude samples and prepared by method A (Fig. 7, left), (2) pure RSS prepared by method A (Fig. 7, middle), and pure RSS prepared by method B (Fig. 7, right). We also used qPCR of plasmid DNA in H2O (Fig. 7, hatched columns) and in DT/PK buffer mix (Fig. 7, gray columns) to generate standard curves for titer calculation, showing that RSS recovered titers were closer to the RSS given titer when using sample-comparable buffer mix (Fig. 7, gray columns) rather than using H2O (Fig. 7, hatched columns) to generate standard curves for titer calculation. Comparable amounts of vector DNA was detected in both DT- and DT/PK-treated samples (Fig. 7, left and middle, DT and DT/PK), confirming that the qPCR 95°C heating step resulted in the release of vector DNA from AAV2 capsids. The titers of RSS prepared by method B and qPCR conducted by various laboratories (Fig. 7, right, cross-hatched columns) were all significantly higher than the given RSS titer (p<0.05) and that of the RSS samples prepared by method A (Fig. 7, left and middle). The results presented in Fig. 7 were all from qPCR targeting ITR sequences and further confirmed our data (Fig. 6) that the ITR titers of high-titer samples were significantly higher when using method B rather than method A.
Fig. 7.
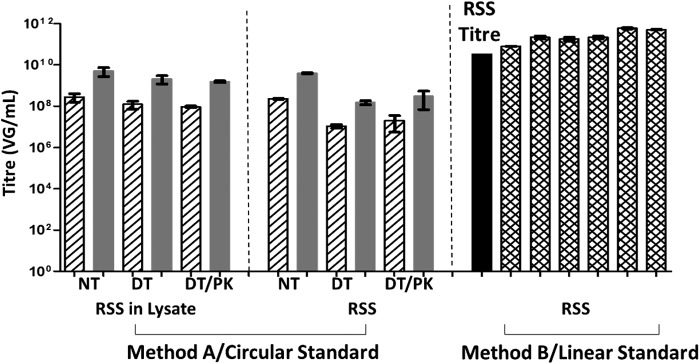
qPCR analysis of artificial crude (left) and pure (middle and right) ATCC reference materials (RSS) prepared by method A (left and middle) or method B (right), quantified on the basis of calibration curves of circular (left and middle) or linearized (right) plasmid DNA in H2O (hatched and cross-hatched columns) or DT/PK mixture (gray columns). The RSS given titer (3.28×10¹⁰ VG/ml) is shown in the solid column. Data for each column represent mean data of nine PCRs of the same sample prepared in triplicate and then qPCR in triplicate (n=9). All study results are significantly different from the RSS given titers of 3.28×10¹⁰ VG/ml, p<0.05.
With the ultimate goal of harmonization and standardization of AAV dose determination assays, we systematically analyzed the influence of key variables, including sample preparation procedure, the choice of amplicon sequences, and calibration template DNA conformation on the qPCR quantitation of AAV vector genome copies. Our results showed that downstream chromatography purification of AAV products is insufficient to remove excess plasmid DNA from vector samples, emphasizing the importance of a built-in step, for example, enzymatic treatment, to remove plasmid DNA. The adopted enzymatic treatment with Benzonase and DNase I was robust in removing excess plasmid DNA (at a concentration of ∼1013 DNA copies/ml). qPCR detection sensitivity of excess plasmid DNA was comparable between crude and purified AAV samples; however, vector DNA extraction methods may have a significant impact on the qPCR results, with significantly lower genome copy numbers being obtained when vector DNA was extracted by method A than when using method B, which has an added DNA purification step, demonstrating potential capsid protein interference with qPCR amplification. On the basis of the results of our study, we recommend inclusion of a DNA purification step in AAV sample preparation to prevent the underestimation of AAV titers. The influence of calibration template DNA conformation on qPCR quantitation shows target sequence dependence and can be optimized by qPCR primer design. The design of primers and the choice of qPCR target sequences show a profound effect on AAV quantitation; in particular, of the three commonly used target sequences, that is, AAV ITR, internal promoter CMV, and transgene GFP, qPCR results from CMV show the least variation and dependency on sample preparation methods and calibration template DNA conformation. Our results reveal the difference between AAV2 and AAV8 in susceptibility to heating at 95°C on the release of vector DNA from capsids, confirming the findings of Raparolu and colleagues29 that AAV8 is more thermostable than AAV2 vectors. Our results reveal the possibility that AAV vectors may be able to “passively” package vector DNA sequences that are not full length and without function as they package rep/cap plasmid DNA29 and “cellular” SV40 DNA inside the capsids, which may significantly compromise the accuracy of AAV vector genome determination; therefore, the use of primer sets targeting different regions of vector sequence may be necessary to increase the accuracy of vector genome determination and to rule out the possible contribution to vector titration of vector plasmid DNA that is incomplete in length and without function. This study underlines the need for care in designing and conducting AAV dose determination assays, particularly when using ITR as the quantitation target sequence. It emphasizes the importance of extensive product characterization and the use of reference materials in clinical dose assessment.
Acknowledgment
This project was funded by the U.K. Department of Health.
Author Disclosure Statement
No competing financial interests exist for all authors.
References
- 1.Zhong L, Zhou X, Li Y, et al. Single-polarity recombinant adeno-associated virus 2 vector-mediated transgene expression in vitro and in vivo: mechanism of transduction. Mol Ther 2008;16:290–295 [DOI] [PubMed] [Google Scholar]
- 2.Salvetti A, Orève S, Chadeuf G, et al. Factors influencing recombinant adeno-associated virus production. Hum Gene Ther 1998;9:695–706 [DOI] [PubMed] [Google Scholar]
- 3.Grimm D, Kern A, Pawlita M, et al. Titration of AAV-2 particles via a novel capsid ELISA: packaging of genomes can limit production of recombinant AAV-2. Gene Ther 1999;6:1322–1330 [DOI] [PubMed] [Google Scholar]
- 4.Brument N, Morenweiser R, Blouin V, et al. A versatile and scalable two-step ion-exchange chromatography process for the purification of recombinant adeno-associated virus serotypes-2 and -5. Mol Ther 2002;6:678–686 [DOI] [PubMed] [Google Scholar]
- 5.Zhen Z, Espinoza Y, Bleu T, et al. Infectious titer assay for adeno-associated virus vectors with sensitivity sufficient to detect single infectious events. Hum Gene Ther 2004;15:709–715 [DOI] [PubMed] [Google Scholar]
- 6.Zolotukhin S, Byrne BJ, Mason E, et al. Recombinant adeno-associated virus purification using novel methods improves infectious titer and yield. Gene Ther 1999;6:973–985 [DOI] [PubMed] [Google Scholar]
- 7.Gerard CJ, Dell'aringa J, Hale KA. A sensitive, real-time, RNA-specific PCR method for the detection of recombinant AAV-CFTR vector expression. Gene Ther 2003;10:1744–1753 [DOI] [PubMed] [Google Scholar]
- 8.Cao L, During M, Xiao W. Replication competent helper functions for recombinant AAV vector generation. Gene Ther 2002;9:1199–1206 [DOI] [PMC free article] [PubMed] [Google Scholar]
- 9.Duffy AM, O'Doherty AM, O'Brien T. Purification of adenovirus and adeno-associated virus: comparison of novel membrane-based technology to conventional techniques. Gene Ther 2005;12 Suppl 1:S62–S72 [DOI] [PubMed] [Google Scholar]
- 10.Shiau AL, Liu PS, Wu CL. Novel strategy for generation and titration of recombinant adeno-associated virus vectors. J Virol 2005;79:193–201 [DOI] [PMC free article] [PubMed] [Google Scholar]
- 11.Halbert CL, Standaert TA, Aitken ML. Transduction by adeno-associated virus vectors in the rabbit airway: efficiency, persistence, and readministration. J Virol 1997;71:5932–5941 [DOI] [PMC free article] [PubMed] [Google Scholar]
- 12.Samulski RJ, Chang LS, Shenk T. Helper-free stocks of recombinant adeno-associated viruses: normal integration does not require viral gene expression. J Virol 1989;63:3822–3828 [DOI] [PMC free article] [PubMed] [Google Scholar]
- 13.Clark KR, Liu X, McGrath JP. Highly purified recombinant adeno-associated virus vectors are biologically active and free of detectable helper and wild-type viruses. Hum Gene Ther 1999;10:1031–1039 [DOI] [PubMed] [Google Scholar]
- 14.Wright JF. New adeno-associated virus strategies to support momentum in the clinic. Hum Gene Ther 2011;22:519–521 [DOI] [PubMed] [Google Scholar]
- 15.Hou Y, Zhang H, Miranda L. Serious overestimation in quantitative PCR by circular (supercoiled) plasmid standard: microalgal pcna as the model gene. PLoS One 2010;5:e9545. [DOI] [PMC free article] [PubMed] [Google Scholar]
- 16.Aurnhammer C, Haase M, Muether N, et al. Universal real-time PCR for the detection and quantification of adeno-associated virus serotype 2-derived inverted terminal repeat sequences. Hum Gene Ther Methods 2012;23:18–28 [DOI] [PubMed] [Google Scholar]
- 17.Fagone P, Wright JF, Nathwani AC, et al. Systemic errors in quantitative polymerase chain reaction titration of self-complementary adeno-associated viral vectors and improved alternative methods. Hum Gene Ther Methods 2012;23:1–7 [DOI] [PMC free article] [PubMed] [Google Scholar]
- 18.Wang Y, Ling C, Song L, et al. Limitations of encapsidation of recombinant self-complementary adeno-associated viral genomes in different serotype capsids and their quantitation. Hum Gene Ther Methods 2012;23:225–233 [DOI] [PMC free article] [PubMed] [Google Scholar]
- 19.Lock M, Alvira MR, Wilson JM. Analysis of particle content of recombinant adeno-associated virus serotype 8 vectors by ion-exchange chromatography. Hum Gene Ther Methods 2012;23:56–64 [DOI] [PMC free article] [PubMed] [Google Scholar]
- 20.Lock M, McGorray S, Auricchio A, et al. Characterization of a recombinant adeno-associated virus type 2 Reference Standard Material. Hum Gene Ther 2010;21:1273–1285 [DOI] [PMC free article] [PubMed] [Google Scholar]
- 21.Sommer JM, Smith PH, Parthasarathy S, et al. Quantification of adeno-associated virus particles and empty capsids by optical density measurement. Mol Ther 2003;7:122–128 [DOI] [PubMed] [Google Scholar]
- 22.Kohlbrenner E, Henckaerts E, Rapti K, et al. Quantification of AAV particle titers by infrared fluorescence scanning of Coomassie-stained sodium dodecyl sulfate–polyacrylamide gels. Hum Gene Ther Methods 2012;23:198–203 [DOI] [PMC free article] [PubMed] [Google Scholar]
- 23.Grieger JC, Choi VW, Samulski RJ. Production and characterization of adeno-associated viral vectors. Nat Protoc 2006;1:1412–1428 [DOI] [PubMed] [Google Scholar]
- 24.Bustin SA, Benes V, Garson JA, et al. The MIQE guidelines: minimum information for publication of quantitative real-time PCR experiments. Clin Chem 2009;55:611–622 [DOI] [PubMed] [Google Scholar]
- 25.Hayes F. The function and organization of plasmids. In: Methods in Molecular Biology, Vol. 235: E. coli plasmid vectors. Casali N. and Preston A, eds. (Humana Press, Totowa, NJ: ). 2003; pp. 1–8 [DOI] [PubMed] [Google Scholar]
- 26.Chen J, Kadlubar FF, Chen JZ. DNA supercoiling suppresses real-time PCR: a new approach to the quantification of mitochondrial DNA damage and repair. Nucleic Acids Res 2007;35:1377–1388 [DOI] [PMC free article] [PubMed] [Google Scholar]
- 27.Lock M, Alvira MR, Chen SJ, et al. Absolute determination of single-stranded and self-complementary adeno-associated viral vector genome titers by droplet digital PCR. Hum Gene Ther Methods 2007;25:115–125 [DOI] [PMC free article] [PubMed] [Google Scholar]
- 28.Raparolu V, Krus S, Kant R, et al. Comparative analysis of adeno-associated virus capsid stability and dynamics. J Virol 2013;87:13150–13160 [DOI] [PMC free article] [PubMed] [Google Scholar]
- 29.Scott LJ. Alipogene tiparvovec: a review of its use in adults with familial lipoprotein lipase deficiency. Drugs 2015;75:175–182 [DOI] [PubMed] [Google Scholar]