

Abstract
Background
This study was designed to quantify torque production at different joint angles in the paretic and non-paretic knee joints of individuals with stroke.
Methods
Extension and flexion torques were measured at 6 angles of the knee joint and normalized to peak torque in 19 subjects with stroke and 19 controls.
Results
Paretic knee extension torque was lower than controls when the knee was positioned near extension. In contrast, nonparetic knee extension and flexion torques were higher than controls when the knee was positioned near full flexion.
Conclusions
The paretic knee extensors demonstrated exaggerated weakness at short muscle lengths and the nonparetic knee extensors and flexors demonstrated selective strength gains. Clinicians should therefore consider paretic knee extensor strengthening near full extension and promote symmetrical use of the legs to prevent compensatory overuse of the non-paretic leg.
Keywords: Knee, Force, Muscle, Torque, Rehabilitation
Introduction
Clinical observations suggest that individuals with stroke demonstrate variable levels of muscle strength depending on the muscle length required for the task. These observations have been supported by experimental evidence demonstrating nonuniform muscle weakness across upper extremity joint range of motion. More specifically, studies have found that isometric torque-angle curves of the paretic elbow flexors and extensors reveal exaggerated weakness at short muscle lengths [1–3].
In the lower extremity, clinical reports suggest that there is excessive weakness and insufficient control of paretic knee extensors when contracting over short muscle lengths during the stance phase of gait and while curb climbing [4]. In addition, excessive weight bearing occurs through the nonparetic leg [5–7]. This compensation may lead to task-specific strength gains in the nonparetic leg muscles, particularly in the chronic stage of recovery. Thus, we hypothesized that, like the upper extremity, weakness over short muscles lengths occurs in the paretic muscles and selective strength gains occurs in the nonparetic muscles of the lower extremity in individuals with stroke.
Knowledge of relative strength changes across joint range of motion in both paretic and nonparetic leg muscles of individuals with stroke may help guide clinicians in selecting appropriate rehabilitation exercises. Thus, the purpose of this study was to determine whether or not alterations of flexion and extension torque-angle curves exist in the paretic and nonparetic knee joints of individuals with chronic stroke when compared to a control group.
Methods
Subjects
Nineteen subjects with hemiparesis following a single stroke were recruited from the community. Subjects were at least 1 year post-stroke, 50 years of age, able to walk independently for 10 m (with or without a device), able to actively achieve full paretic knee extension and 105° of knee flexion in sitting, and able to follow commands. In addition, 19 healthy subjects of similar age were recruited as controls. Approval was obtained from the local university and hospital ethics committees and all subjects provided informed consent. For subjects with stroke, motor recovery of the paretic lower extremity was assessed using the leg and foot portion of the Chedoke-McMaster Stroke Assessment [8] ; stage 1 represents flaccid paralysis and stage 7 represents normal movement. Disability was assessed using the Stroke Functional Classification levels from the American Heart Association Stroke Outcome Classification Score [9] ; level I represents complete independence and level V represents complete dependence. Lower extremity passive muscle tone was assessed using the Modified Ashworth Scale (MAS) [10]; 0 = no increase in tone and 4 = rigid. Activity level was assessed for all subjects using the Physical Activity Scale for Individuals with Physical Disabilities [11]. This self-report questionnaire provides an estimate of how many days per week, and hours per day are spent being active and is multiplied by a metabolic equivalent value (MET hours/day). Subject and control group characteristics are summarized in table 1.
Table 1.
Characteristics of subjects (stroke n = 19, control n = 19)
| Characteristics | Stroke
|
Control
|
||
|---|---|---|---|---|
| mean ± SD or n | range | mean ± SD or n | range | |
| Age, years | 64.9 ± 7.6 | 53–77 | 63.4 ± 7.8 | 52–83 |
| Female/male | 6/13 | 6/13 | ||
| Mass, kg | 75.9 ± 13.1 | 53.0–101.0 | 82.0 ± 12.5 | 63.2–103.0 |
| Height, m | 1.71 ± 0.10 | 1.54–1.90 | 1.77 ± 0.10 | 1.59–1.97 |
| BMI, kg/m2 | 26.2 ± 4.3 | 20.2–35.0 | 26.0 ± 3.4 | 19.7–30.9 |
| Physical activity1, MET h/day | 13.5 ± 9.5 | 2.2–40.3 | 23.1 ± 12.2 | 5.2–53.2 |
| Time since stroke, years | 7.5 ± 7.3 | 1–29 | ||
| Stroke type, ischemic/hemorrhagic | 11/8 | |||
| Stroke type, cortical/subcortical | 7/12 | |||
| Paretic side, right/left | 6/13 | |||
| Functional Classification2,3, class I–V | II | I–IV | ||
| Motor impairment3,4, stage 1–7 | ||||
| Leg | 6 | 4–7 | ||
| Foot | 4 | 2–7 | ||
| Modified Ashworth Scale3 (0–4; flexors/extensors) | ||||
| Ankle | 0/1 | 0–1/0–3 | ||
| Knee | 1/0 | 0–3/0–2 | ||
| Hip | 0/0 | 0–0/0–1+ | ||
BMI = Body mass index; MET = metabolic equivalent value.
Physical Activity Scale for individuals with physical disabilities.
Stroke Functional Classification level (American Heart Association).
Median is reported for the ordinal Modified Ashworth Scale, Functional Classification, and Motor Impairment scores.
Chedoke-McMaster Stroke Assessment Score.
Joint Torque Assessment
The isometric mode of a Kin-Com dynamometer (Chattanooga Group, Tenn., USA) was used to assess extension and flexion maximum voluntary joint torques across six different angles (15, 35, 55, 75, 95, and 105°, where the knee was in full extension at 0°) of the paretic and nonparetic knee of subjects with stroke, and the nondominant knee of control subjects (determined by preference for kicking a ball). Unlike the upper extremity, it has been shown that there is no dominance for maximal muscle strength [12, 13] or power [14] in the lower extremity.
Instrument calibration was tested prior to the study with known weights and was accurate to within 8 1 N. Subjects were positioned at a 90° sitting angle. Three straps stabilized the trunk and pelvis and the subject’s hands rested in their laps. A rigid clamp placed over the distal thigh of the test leg was used for additional stabilization. The dynamometer axis was aligned with the lateral femoral condyle and the cuff was positioned three finger breaths above the medial malleolis. Blood pressure was monitored before, during, and after testing and was required to be at or below 140/90 mm Hg.
Before each trial, subjects were relaxed and instructed ‘At the sound of the click (an auditory cue) push (or pull) as hard and as fast as you can and hold this effort. At the second click, immediately relax’. Each trial lasted 3 s and verbal encouragement was provided to facilitate a maximum effort. Before extension and flexion joint actions, one submaximal trial followed by one maximal trial was performed as practice. Force signals from the dynamometer were fed through an analogue to digital converter (National Instruments) and collected at 100 Hz. During testing, the torque profile of each trial was displayed on a computer screen and visually inspected by the same examiner. Trials with pushing or pulling in the wrong direction or irregular torque profiles were repeated by the subject and subsequently eliminated before analysis (5% of the total number of trials across all subjects needed to be repeated). To avoid a fatigue effect, each trial was separated by 30 s rest and each joint angle was tested one at a time from short to long muscle lengths before being repeated (i.e. knee extension torque testing was as follows: 15, 35, 55, 75, 95, 105, 15, 35, 55, 75, 95, 105°, where 15° is near knee extension). In addition, 5 min rest was provided between extension and flexion joint actions. To reduce a possible order effect, testing began with extension for approximately half of the subjects and flexion for the remainder.
Data Analyses
Data were processed with MATLAB using custom software. All torque measurements were corrected for the effect of gravity on the lower extremity segment and cuff of the dynamometer. Peak torque was measured as the maximum torque maintained over a period of 250 ms divided by body mass and averaged over the two contractions for each angle. Knee extension and flexion torque-angle curves of the mean absolute torques (Nm/kg) were plotted to descriptively illustrate the strength loss or gain of the paretic and nonparetic knees when compared with controls (fig. 1, 3). Due to the variability of muscle strength across subjects, relative torque production (%) across the 6 joint angles was also calculated by expressing each subject’s torque values as a percentage of their own peak torque (each subject’s highest torque value across joint range of motion was designated as 100%). Knee extension and flexion torque-angle curves were again plotted to allow for a comparison of relative strength across joint range of motion between paretic, nonparetic and control subject groups (fig. 2, 4). Lines of fit were added to torque-angle curves to aid visual inspection.
Figure 1.
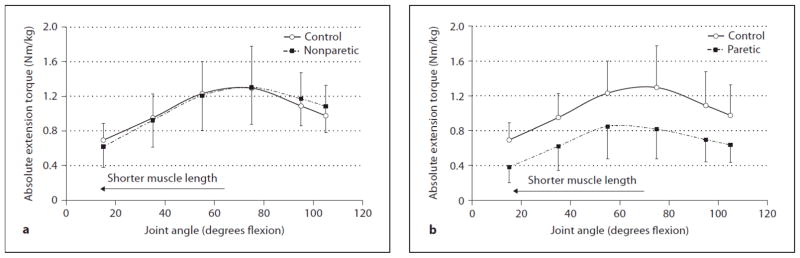
Comparison of absolute knee extension torques (Nm/kg) (a) between the control group and nonparetic stroke side and (b) between the control group and paretic stroke side at 6 different angles. The error bars represent 1 SD.
Figure 3.
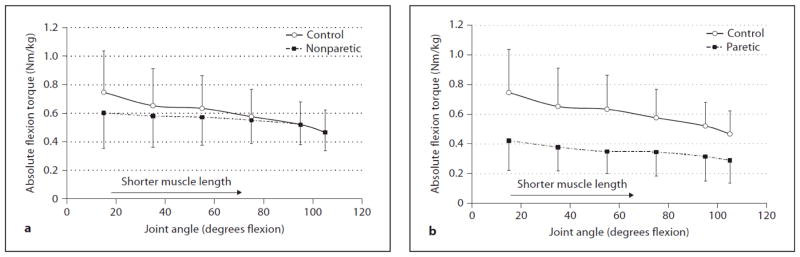
Comparison of absolute knee flexion torques (Nm/kg) between (a) the control group and nonparetic stroke side and (b) control group and paretic stroke side at 6 different angles. The error bars represent 1 SD.
Figure 2.
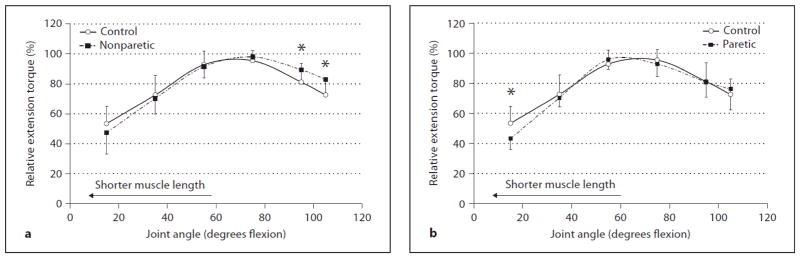
Comparison of relative (%) knee extension torques between (a) the control group and nonparetic stroke side and (b) control group and paretic stroke side at 6 different angles. The error bars represent 1 SD. * Paretic relative torque significantly different than control (p ≤ 0.05).
Figure 4.
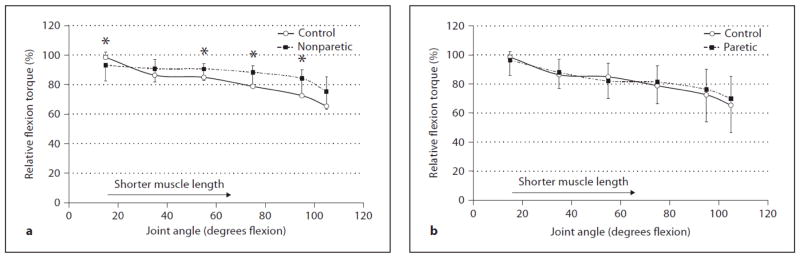
Comparison of relative knee flexion torques (%) between (a) the control group and nonparetic stroke side and (b) control group and paretic stroke side at 6 different angles. The error bars represent 1 SD. * Nonparetic relative torque significantly different than control (p ≤ .05).
Statistical Analyses
Descriptive statistics were calculated to depict subject characteristics, clinical scores, and measured torque values. Relative torque-angle curves of the paretic and nonparetic sides of individuals with stroke were compared with the control group using a 2-factor (Factor 1: group; paretic, nonparetic, control. Factor 2: joint angle; 15, 35, 55, 75, 95, 105°) mixed design analysis of variance (3 × 6 ANOVA). Separate analyses were performed for knee extension and knee flexion torques. If significant interactions (subject group by joint angle) were revealed, post-hoc pairwise comparisons for independent samples were performed for each joint angle tested to determine relative strength differences (1) between the paretic knee joint when compared with control values and (2) between the nonparetic knee joint and control values. All statistical analyses were performed using SPSS 11.5 software with a significance level of p ≤ 0.05.
Results
Knee Extension Torque-Angle Curves
For knee extension, the absolute torque-angle curves (Nm/kg) (fig. 1) produced a mean across all 6 joint angles of 0.67 Nm/kg (SD = 0.27) for the paretic side, 1.05 Nm/kg (SD = 0.33) for the nonparetic side, and 1.04 Nm/kg (SD = 0.21) for the controls. Thus, overall there was an absolute torque reduction across joint range of motion for the paretic extensors and no torque reduction (i.e., preservation of torque) for the nonparetic extensors when compared to controls.
For statistical analysis, the relative extension torques (normalized to each subject’s own peak torque; %) at each joint angle were used (fig. 2) and the ANOVA revealed a significant interaction between group (paretic, nonparetic, and control) and joint angle (6 angles) (p = 0.001). Posthoc t tests for independent samples revealed paretic extensors to be significantly lower than controls at 15° (p = 0.002) (i.e. relatively weaker at short muscle lengths or near full joint extension); no other joint angles were significant (p = 0.224–0.943) (fig. 2 b). Nonparetic extensors were significantly higher than controls at 95 and 105° (p = 0.015, 0.004 respectively) (i.e. relatively stronger at long muscle lengths or near full joint flexion); no other joint angles were significant (p = 0.143–0.633) (fig. 2 a). On average, peak knee extension torque occurred at 55° for the paretic side and 75° for both the nonparetic side and control group.
Knee Flexion Torque-Angle Curves
For knee flexion the absolute torque-angle curves (Nm/kg) of the paretic and nonparetic sides of individuals with stroke and the control subjects are presented in figure 3. The mean absolute torque produced across all 6 joint angles was 0.35 Nm/kg (SD = 0.17) for the paretic side, 0.55 Nm/kg (SD = 0.18) for the nonparetic side, and 0.60 Nm/kg (SD = 0.21) for the controls. Thus, absolute torque was reduced across joint range of motion for the paretic flexors. The nonparetic flexors produced less torque than controls when the knee joint was extended, but torque remained unaffected (i.e., preserved torque) as the knee joint moved towards flexion, therefore producing a flattened torque-angle curve.
For statistical analysis, the relative flexion torques (normalized to each subject’s own peak torque; %) at each joint angle were used (fig. 3) and the ANOVA revealed a significant interaction between group (paretic, nonparetic, and control) and joint angle (6 angles) (p = 0.041). Post-hoc t tests for independent samples revealed no significant differences between paretic flexors and controls for any joint angles tested (p = 0.389–0.641) (fig. 4). Nonparetic flexors were significantly higher than controls at 55, 75, and 95° (p = 0.050, 0.014, 0.016, respectively), and 105° approached significance (p = 0.057) (i.e. relatively stronger as the muscle moved towards shorter lengths or more joint flexion). Due to the flattening of the absolute nonparetic torque-angle curve and the weakness demonstrated near full joint extension, the relative torque-angle curves crossed between 15 and 35° with the nonparetic flexors being significantly lower than controls at 15° (p = 0.044) (fig. 4). On average, peak knee flexion torque occurred at 15° for all three groups.
Discussion
The torque-angle curves from our control subjects had similar shapes as reported previously for healthy adults with a quasi-bell-shaped curve for the knee extensors and torque that increased with longer muscle lengths for the knee flexors [15, 16].
Torque-Angle Relationships of the Paretic Knee
The clinical observation of excessive paretic knee extensor weakness near terminal extension was supported by our findings. When compared to the controls, there was an additional 10% reduction in relative strength of the paretic knee extensors at short muscle lengths (15° from full extension). Thus, weakness existed across joint range of motion, but was exaggerated at short muscle lengths. Our findings concur with the relative weakness found at short muscle lengths of the elbow flexors and extensors [2, 3]. Such nonuniform weakness may be due to the primary cerebral damage that occurs with stroke. In healthy individuals, it has been shown that twitch duration is reduced during voluntary isometric contractions at short muscle lengths in the biceps brachialis [17, 18] and tibialis anterior [17, 19]. Thus to achieve fusion of twitches when contracting at short lengths, a healthy central nervous system will increase motor unit discharge rates. However, in individuals with stroke, there is evidence of reduced motor unit firing rates in paretic muscles [20, 21]. Thus, exaggerated weakness at short muscle lengths in individuals with stroke may be due to an inability to increase motor unit discharge rates to achieve fusion of twitches [2]. Koo et al. [3] reported no significant differences in EMG levels of the brachioradialis muscle of subjects with stroke when tested isometrically across short to long lengths, whereas control subjects demonstrated significantly higher EMG levels at short lengths relative to long. Such findings suggest a reduction in central drive at short lengths in subjects with stroke [3].
The length of the muscle will influence peripheral feedback which in turn can alter the threshold of the motoneurons on a presynaptic level [22]. Patikas et al. [22] found a decreased level of presynaptic inhibition when the soleus of healthy subjects was in a shortened length versus a longer length, thereby facilitating the depolarization of the motor neuron pool to compensate for the biomechanical disadvantaged position. Although modulation of presynaptic inhibition appears impaired during force generation post-stroke [23], the relationship of presynaptic inhibition with muscle length has not been explored in this population.
Renner et al. [24] found that subjects with cortical stroke, but not subcortical stroke, lacked an increase in corticospinal excitability at short muscle lengths of the triceps and biceps brachii as measured by the motorevoked potential (MEP) amplitude using transcranial magnetic stimulation at 40 days post-stroke. They suggested that cortical interneurons may be involved with the MEP-muscle length relation. We did not note torque differences between our cortical and subcortical subjects, however we were likely underpowered to detect such differences as only 7 of 19 subjects had cortical lesions. On the other hand, our sample was substantially more chronic (mean 7 years post-stroke) and perhaps compensations of use or non-use play an increasing role on motor excitability with chronicity.
In addition to neural factors, there is increasing evidence that the mechanical properties of the muscle and tendon complex are altered post-stroke. Muscles affected by upper motor neuron lesions have been found to have reduced resting sarcomere length [25] and increased stiffness [25, 26] which could potentially interfere with cross-bridge formation particularly at short lengths.
Unexpectedly, our results for the paretic knee flexors did not demonstrate any evidence of selective weakness at short lengths. This is in contrast to the paretic elbow where selective weakness at short lengths was demonstrated for both flexor and extensor muscle groups [2, 3].
This negative finding may be due to the differences in architectural and contractile properties between the quadriceps and hamstring muscles. The quadriceps is characterized by higher pennation angles, shorter fibers, and a larger cross-sectional area relative to the hamstrings; thus the knee extensors are designed for high force production, and the knee flexors are designed for large excursions and velocity [27, 28]. As a result there may be substantial differences in the neural control of muscles with vastly different structural properties. For example, Brouwer and Ashby [29] found that cortical magnetic stimulation generated facilitatory or no response in the biceps femoris, while inhibitory responses occurred in the vastus medialis. Furthermore, the distribution of oligosynaptic cortical pathways has been found to vary between the biceps femoris, vastus lateralis and semitendinosus muscles [30, 31].
Lastly, our results for the knee flexors may also be due to the upright test position of the subjects at a 90° sitting angle which may not have shortened the hamstrings sufficiently to demonstrate exaggerated weakness. Each of the hamstring muscles crosses both the hip and the knee joints (with the minor exception of the short head of biceps femoris), thus, when sitting upright, the hamstring muscles remain lengthened over the hip joint. In contrast, for the knee extensors, only the rectus femoris of the quadriceps muscle crosses both the hip and the knee joint (vastus medialis, lateralis and intermedius originate below the hip joint) and a 90° sitting angle, combined with a 15° knee flexion angle, would cause considerable shortening of this muscle group. An upright posture was selected to minimize the transient increase in blood pressure known to occur with isometric exercise [32, 33] in this hypertensive population.
Torque-Angle Relationships of the Nonparetic Knee
The nonparetic knee extensors and flexors were up to 12% stronger than controls when tested over 95–105° of flexion (long lengths for the extensors and short lengths for the flexors). Our subjects were tested, on average, 7.5 years post-stroke and this relative strength gain over a flexed knee joint position may be due to task-specific muscular adaptation. For example, individuals with stroke place more of their weight through their nonparetic leg during sit-to-stand [7, 34]. Furthermore, sit-tostand is performed several times a day and older adults use up to 87% of their available knee torque to rise [35]. With the nonparetic leg performing the majority of effort during this transfer, it is being loaded to near maximal levels repeatedly throughout the day. Interestingly, the quadriceps and hamstring muscle activity in older adults peaks during the critical transition phase of sit-to-stand when the knee is flexed beyond 90° [36]. Thus, such repetitive activity of the nonparetic knee could result in compensatory strength gains over a flexed joint position.
Limitations
These findings may not necessarily extend to concentric or eccentric torque-angle curves. However, there is a relationship between knee flexion and extension isometric strength measures with isokinetic and isotonic measures taken at the same joint angle (mean r = 0.75) [37]. In addition, generalization of these findings can only be made to individuals with chronic stroke.
Clinical Implications and Future Directions
The main finding of exaggerated paretic knee extensor weakness near terminal extension should encourage clinicians to design exercises that strengthen the quadriceps over short muscle lengths. Increasing strength over the last 20° of knee extension may enhance performance during functional activities such as gait and stair climbing. Furthermore, the finding that both nonparetic extensors and flexors tend to be relatively stronger as the knee assumes a more flexed position suggests that individuals with stroke rely heavily on their nonparetic leg during everyday tasks, possibly leading to further strength loss in the paretic leg muscles due to disuse atrophy. Thus, clinicians should encourage symmetrical use of the legs, which may enhance paretic leg strength and improve function. The common practice of examining paretic limb strength with a single isometric midrange contraction may not always reveal the full clinical picture.
Acknowledgments
This study was supported by an operating grant from CIHR (MOP-57862), a career scientist award to JJE from CIHR (MSH-63617) and the Michael Smith Foundation for Health Research, and a summer research scholarship to MJL from the BC Medical Services Foundation. The authors wish to thank Sarah Einarson for her assistance with data collection.
References
- 1.Ada L, Canning C, Dwyer T. Effect of muscle length on strength and dexterity after stroke. Clin Rehabil. 2000;14:55–61. doi: 10.1191/026921500671430626. [DOI] [PubMed] [Google Scholar]
- 2.Ada L, Canning CG, Low SL. Stroke patients have selective muscle weakness in shortened range. Brain. 2003;126:724–731. doi: 10.1093/brain/awg066. [DOI] [PubMed] [Google Scholar]
- 3.Koo TK, Mak AF, Hung L, Dewald JP. Joint position dependence of weakness during maximum isometric voluntary contractions in subjects with hemiparesis. Arch Phys Med Rehabil. 2003;84:1380–1386. doi: 10.1016/s0003-9993(03)00238-7. [DOI] [PubMed] [Google Scholar]
- 4.Carr JH, Shepherd RB. Stroke Rehabilitation: Guidelines for Exercise and Training to Optimize Motor Skill. London: Butterworth Heinemann; 2004. [Google Scholar]
- 5.Winstein CJ, Gardner ER, McNeal DR, Barto PS, Nicholson DE. Standing balance training: effect on balance and locomotion in hemiparetic adults. Arch Phys Med Rehabil. 1989;70:755–762. [PubMed] [Google Scholar]
- 6.Eng JJ, Chu KS. Reliability and comparison of weight-bearing ability during standing tasks for individuals with chronic stroke. Arch Phys Med Rehabil. 2002;83:1138–1144. doi: 10.1053/apmr.2002.33644. [DOI] [PMC free article] [PubMed] [Google Scholar]
- 7.Lomaglio MJ, Eng JJ. Muscle strength and weight-bearing symmetry relate to sit-to-stand performance in individuals with stroke. Gait Posture. 2005;22:126–131. doi: 10.1016/j.gaitpost.2004.08.002. [DOI] [PMC free article] [PubMed] [Google Scholar]
- 8.Gowland C, Stratford P, Ward M, Moreland J, Torresin W, Van Hullenaar S, Sanford J, Barreca S, Vanspall B, Plews N. Measuring physical impairment and disability with the Chedoke-McMaster Stroke Assessment. Stroke. 1993;24:58–63. doi: 10.1161/01.str.24.1.58. [DOI] [PubMed] [Google Scholar]
- 9.Kelly-Hayes M, Robertson JT, Broderick JP, Duncan PW, Hershey LA, Roth EJ, Thies WH, Trombly CA. The American Heart Association Stroke Outcome Classification: executive summary. Circulation. 1998;97:2474–2478. doi: 10.1161/01.cir.97.24.2474. [DOI] [PubMed] [Google Scholar]
- 10.Bohannon RW, Smith MB. Interrater reliability of a Modified Ashworth Scale of muscle spasticity. Phys Ther. 1987;67:206–207. doi: 10.1093/ptj/67.2.206. [DOI] [PubMed] [Google Scholar]
- 11.Washburn RA, Zhu W, McAuley E, Frogley M, Figoni SF. The Physical Activity Scale for individuals with physical disabilities: development and evaluation. Arch Phys Med Rehabil. 2002;83:193–200. doi: 10.1053/apmr.2002.27467. [DOI] [PubMed] [Google Scholar]
- 12.Holder-Powell HM, Rutherford OM. Unilateral lower-limb musculoskeletal injury: its long-term effect on balance. Arch Phys Med Rehabil. 2000;81:265–268. doi: 10.1016/s0003-9993(00)90069-8. [DOI] [PubMed] [Google Scholar]
- 13.Skelton DA, Kennedy J, Rutherford OM. Explosive power and asymmetry in leg muscle function in frequent fallers and non-fallers aged over 65. Age Ageing. 2002;31:119–125. doi: 10.1093/ageing/31.2.119. [DOI] [PubMed] [Google Scholar]
- 14.Demura S, Yamaji S, Goshi F, Nagasawa Y. Lateral dominance of legs in maximal muscle power, muscular endurance, and grading ability. Percept Mot Skills. 2001;93:11–23. doi: 10.2466/pms.2001.93.1.11. [DOI] [PubMed] [Google Scholar]
- 15.Anderson DE, Madigan ML, Nussbaum MA. Maximum voluntary joint torque as a function of joint angle and angular velocity: model development and application to the lower limb. J Biomech. 2007;40:3105–3113. doi: 10.1016/j.jbiomech.2007.03.022. [DOI] [PMC free article] [PubMed] [Google Scholar]
- 16.Yoon TS, Park DS, Kang SW, Chun SI, Shin JS. Isometric and isokinetic torque curves at the knee joint. Yonsei Med J. 1991;32:33–43. doi: 10.3349/ymj.1991.32.1.33. [DOI] [PubMed] [Google Scholar]
- 17.Gandevia SC, McKenzie DK. Activation of human muscles at short muscle lengths during maximal static efforts. J Physiol. 1988;407:599–613. doi: 10.1113/jphysiol.1988.sp017434. [DOI] [PMC free article] [PubMed] [Google Scholar]
- 18.Christova P, Kossev A, Radicheva N. Discharge rate of selected motor units in human biceps brachii at different muscle lengths. J Electromyogr Kinesiol. 1998;8:287–294. doi: 10.1016/s1050-6411(97)00034-5. [DOI] [PubMed] [Google Scholar]
- 19.Vander Linden DW, Kukulka CG, Soderberg GL. The effect of muscle length on motor unit discharge characteristics in human tibialis anterior muscle. Exp Brain Res. 1991;84:210–218. doi: 10.1007/BF00231776. [DOI] [PubMed] [Google Scholar]
- 20.Gemperline JJ, Allen S, Walk D, Rymer WZ. Characteristics of motor unit discharge in subjects with hemiparesis. Muscle Nerve. 1995;18:1101–1114. doi: 10.1002/mus.880181006. [DOI] [PubMed] [Google Scholar]
- 21.Rosenfalck A, Andreassen S. Impaired regulation of force and firing pattern of single motor units in patients with spasticity. J Neurol Neurosurg Psychiatry. 1980;43:907–916. doi: 10.1136/jnnp.43.10.907. [DOI] [PMC free article] [PubMed] [Google Scholar]
- 22.Patikas DA, Kotzamanidis C, Robertson CT, Koceja DM. The effect of the ankle joint angle in the level of soleus Ia afferent presynaptic inhibition. Electromyogr Clin Neurophysiol. 2004;44:503–511. [PubMed] [Google Scholar]
- 23.Toft E, Sinkjær T. H-reflex changes during contractions of the ankle extensors in spastic patients. Acta Neurol Scand. 1993;88:327–333. doi: 10.1111/j.1600-0404.1993.tb05352.x. [DOI] [PubMed] [Google Scholar]
- 24.Renner CI, Woldag H, Hummelsheim H. Central compensation at short muscle range is differentially affected in cortical versus subcortical strokes. Stroke. 2006;37:2076–2080. doi: 10.1161/01.STR.0000229876.29608.85. [DOI] [PubMed] [Google Scholar]
- 25.Fridén J, Lieber RL. Spastic muscle cells are shorter and stiffer than normal cells. Muscle Nerve. 2003;27:157–164. doi: 10.1002/mus.10247. [DOI] [PubMed] [Google Scholar]
- 26.Svantesson U, Takahashi H, Carlsson U, Danielsson A, Sunnerhagen KS. Muscle and tendon stiffness in patients with upper motor neuron lesion following a stroke. Eur J Appl Physiol. 2000;82:275–279. doi: 10.1007/s004210000216. [DOI] [PubMed] [Google Scholar]
- 27.Wickiewicz TL, Roy RR, Powell PL, Edgerton VR. Muscle architecture of the human lower limb. Clin Orthop Relat Res. 1983;179:275–283. [PubMed] [Google Scholar]
- 28.Lieber RL, Fridén J. Functional and clinical significance of skeletal muscle architecture. Muscle Nerve. 2000;23:1647–1666. doi: 10.1002/1097-4598(200011)23:11<1647::aid-mus1>3.0.co;2-m. [DOI] [PubMed] [Google Scholar]
- 29.Brouwer B, Ashby P. Corticospinal projections to lower limb motoneurons in man. Exp Brain Res. 1992;89:649–654. doi: 10.1007/BF00229889. [DOI] [PubMed] [Google Scholar]
- 30.Marchand-Pauvert V, Simonetta-Moreau M, Pierrot-Deseilligny E. Cortical control of spinal pathways mediating group II excitation to human thigh motoneurones. J Physiol. 1999;517:301–313. doi: 10.1111/j.1469-7793.1999.0301z.x. [DOI] [PMC free article] [PubMed] [Google Scholar]
- 31.Marque P, Nicolas G, Marchand-Pauvert V, Gautier J, Simonetta-Moreau M, Pierrot-Deseilligny E. Group I projections from intrinsic foot muscles to motoneurones of leg and thigh muscles in humans. J Physiol. 2001;536:313–327. doi: 10.1111/j.1469-7793.2001.t01-1-00313.x. [DOI] [PMC free article] [PubMed] [Google Scholar]
- 32.Lind AR, Taylor SH, Humphreys PW, Kennelly BM, Donald KW. The circulatory effects of sustained voluntary muscle contraction. Clin Sci. 1964;27:229–244. [PubMed] [Google Scholar]
- 33.Bezucha GR, Lenser MC, Hanson PG, Nagle FJ. Comparison of hemodynamic responses to static and dynamic exercise. J Appl Physiol. 1982;53:1589–1593. doi: 10.1152/jappl.1982.53.6.1589. [DOI] [PubMed] [Google Scholar]
- 34.Engardt M, Olsson E. Body weight-bearing while rising and sitting down in patients with stroke. Scand J Rehabil Med. 1992;24:67–74. [PubMed] [Google Scholar]
- 35.Alexander NB, Gu MJ, Branch M, Schultz AB, Ashton-Miller JA, Gross MM. Geriatrics: does leg torque influence rising from a chair in older adults. Rehabil R D Prog Rep. 1995;32:101–102. [Google Scholar]
- 36.Millington PJ, Myklebust BM, Shambes GM. Biomechanical analysis of the sit-to-stand motion in elderly persons. Phys Med Rehabil. 1992;73:609–617. [PubMed] [Google Scholar]
- 37.Knapik JJ, Wright JE, Mawdsley RH, Braun JM. Isokinetic, isometric and isotonic strength relationships. Arch Phys Med Rehabil. 1983;64:77–80. [PubMed] [Google Scholar]