

Abstract
The distribution, clearance, and bioavailability of (2S,6S)-hydroxynorketamine has been studied in the Wistar rat. The plasma and brain tissue concentrations over time of (2S,6S)-hydroxynorketamine were determined after intravenous (20 mg/kg) and oral (20 mg/kg) administration of (2S,6S)-hydroxynorketamine (n = 3). After intravenous administration, the pharmacokinetic parameters were estimated using noncompartmental analysis and the half-life of drug elimination during the terminal phase (t1/2) was 8.0 ± 4.0 h and the apparent volume of distribution (Vd) was 7352 ± 736 mL/kg, clearance (Cl) was 704 ± 139 mL/h per kg, and the bioavailability was 46.3%. Significant concentrations of (2S,6S)-hydroxynorketamine were measured in brain tissues at 10 min after intravenous administration, ∼30 μg/mL per g tissue which decreased to 6 μg/mL per g tissue at 60 min. The plasma and brain concentrations of (2S,6S)-hydroxynorketamine were also determined after the intravenous administration of (S)-ketamine, where significant plasma and brain tissue concentrations of (2S,6S)-hydroxynorketamine were observed 10 min after administration. The (S)-ketamine metabolites (S)-norketamine, (S)-dehydronorketamine, (2S,6R)-hydroxynorketamine, (2S,5S)-hydroxynorketamine and (2S,4S)-hydroxynorketamine were also detected in both plasma and brain tissue. The enantioselectivity of the conversion of (S)-ketamine and (R)-ketamine to the respective (2,6)-hydroxynorketamine metabolites was also investigated over the first 60 min after intravenous administration. (S)-Ketamine produced significantly greater plasma and brain tissue concentrations of (2S,6S)-hydroxynorketamine relative to the (2R,6R)-hydroxynorketamine observed after the administration of (R)-ketamine. However, the relative brain tissue: plasma concentrations of the enantiomeric (2,6)-hydroxynorketamine metabolites were not significantly different indicating that the penetration of the metabolite is not enantioselective.
Keywords: Antidepressant; bioavailability of (2S,6S)-HNK; brain concentrations; plasma half-life and distribution of (2S,6S)-HNK
Introduction
(R,S)-Ket was developed as an anesthetic agent and more recently has been shown to be effective for the clinical treatment of treatment-resistant major depressive disorder and bipolar depression at subanesthetic doses of (R,S)-Ket or (S)-Ket (Paul et al. 2009; Zarate et al. 2012; Zhao et al. 2012; Hirota and Lambert, 2011). The initial pharmacodynamic studies of (R,S)-Ket were conducted using Wistar rats and examined the anesthetic effects of the parent compound and its two principle metabolites (R,S)-norketamine, (R,S)-norKet, and (2S,6S;2R,6R)-hydroxynorketamine, (2S,6S;2R,6R)-HNK, Scheme 3, Pathway A (Leung and Baillie 1986). The results demonstrated that (R,S)-Ket and (R,S)-norKet produced the central nervous system (CNS) activities associated with general anesthesia and increased spontaneous locomotor activity during the postanesthetic recovery phase, whereas(2S,6S;2R,6R)-HNK had no effect. (2S,6S;2R,6R)-HNK was described as an “inactive” metabolite.
Figure 3.
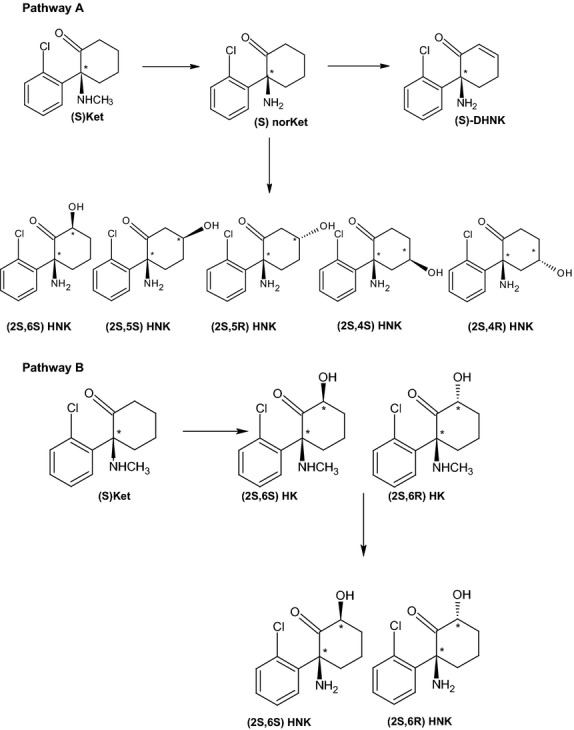
Scheme Metabolic pathway of ketamine.
The plasma clearance and disposition of (R,S)-Ket and (R,S)-norKet and their respective enantiomers in rats have been extensively described (Williams et al. 2004). However, based upon the data obtained in the initial pharmacodynamic study, these studies did not consider the metabolism and disposition of the “inactive” (2S,6S;2R,6R)-HNK metabolite as well as the other multiple (R,S)-Ket metabolites, which include diastereomeric hydroxyketamines (HKet), a series of diastereomeric hydroxynorketamines, and (R,S)-dehydronorketamine, (R,S)-DHNK, Scheme 3. The pharmacological fate of these compounds was ignored even though the initial studies demonstrated that the administration of (R,S)-Ket produced quantifiable concentrations of (R,S)-norKet and (2S,6S;2R,6R)-HNK in plasma and brain tissues, and that the administration of (R,S)-norKet produced quantifiable concentrations of (2S,6S;2R,6R)-HNK in plasma and brain tissue, whereas the administration of (2S,6S;2R,6R)-HNK did not produce any additional compounds (Leung and Baillie 1986).
The distribution, clearance, and bioavailability in the rat of (R,S)-Ket metabolites other than (R,S)-norKet has continued to be disregarded even though the transformation of (R,S)-Ket into HNK, DHNK, and HKet metabolites has also been observed in volunteer and clinical studies (Bolze and Boulieu 1998; Turfus et al. 2009; Moaddel et al. 2010; Zarate et al. 2012) and in studies utilizing human microsomal preparations (Desta et al. 2012). In addition, the results from recent pharmacokinetic and pharmacodynamic studies in patients with bipolar depression and treatment-resistant depression indicate that, in these patients, the clinical effects of (R,S)-Ket could not be adequately explained solely on the disposition and clearance of (R,S)-Ket and (R,S)-norKet (Zhao et al. 2012). In fact, it was demonstrated that there was an association between the HNK and DHNK metabolites and response (Zarate et al. 2012), however, to date only one study presented a pharmacokinetic model for the enantiomers of (R,S)-DHNK in the rat model (Williams et al. 2004).
On the basis of these clinical observations, we reexamined the pharmacological effects of (2S,6S)-HNK in a series of in vitro experiments. The data indicated that (2S,6S;2R,6R)-HNK and (R,S)-DHNK are potent (IC50 < 100 nmol/L) and selective inhibitors of the α7-nicotinic acetylcholine receptor (Moaddel et al. 2013). We also determined that in PC-12 cells the inhibition of α7-nicotinic acetylcholine receptor activity by (2S,6S)-HNK attenuated the activity of the enzyme serine racemase, which, in turn, decreased the intracellular concentration of d-serine, a key co-agonist of the N-methyl-d-aspartate (NMDA) receptor (Singh et al. 2013a,b; unpublished data). Antagonism of the NMDA receptor has been associated with antidepressant effects (Trullas and Skolnick 1990) and reduced d-serine concentrations. Furthermore, attenuated NMDA receptor activity is related in rat and mouse models (Rosenberg et al. 2013). Thus, it is reasonable to assume that a (2S,6S)-HNK-associated reduction in d-serine production should also result in reduced NMDA receptor activation leading to decreased neurotoxicity, synaptic death, and depression and that this “inactive” metabolite actually possesses key pharmacological properties.
This hypothesis was supported by the observation that incubation of PC-12 cells with (2S,6S)-HNK led to higher expression of the monomeric form of serine racemase via de novo protein synthesis associated with the mammalian target of rapamycin (mTOR) signaling pathway (Singh et al. 2013a,b; Paul et al. 2014). These effects are consistent with results from a study in the Wistar rat in which the rapid antidepressant effect produced by (R,S)-Ket was associated with activation of the mTOR pathway in the prefrontal cortex of the animal (Li et al. 2010; Dwyer and Duman 2013). The administration of (R,S)-Ket produced a rapid increase in the relative concentration of the phosphorylated forms of extracellular signal-regulated kinases (pERK1/2), protein kinase B (pAkt), eukaryotic initiation factor 4E binding protein (p4E-BP1) and p70S6 kinase (pp70S6K) and the number and function of new spine synapses in the prefrontal cortex (Li et al. 2010; Dwyer and Duman 2013). We recently repeated this study in the Wistar rat using (R,S)-Ket, (R,S)-norKet, and (2S,6S)-HNK (Paul et al. 2014). The intravenous administration of (2S,6S)-HNK (20 mg/kg) produced pharmacologically relevant CNS concentrations of (2S,6S)-HNK within 10 min and stimulated the activating phosphorylation of mTOR and its downstream targets pERK1/2, pAkt, p4E-BP1, and pp70S6K in pre-frontal cortex tissue (Paul et al. 2014). Although the effect of (2S,6S)-HNK on synaptogenesis was not examined, our results indicate that (2S,6S)-HNK has in vivo pharmacological activity associated with the antidepressant effects of (R,S)-Ket.
On the basis of these observations, we have continued the development of (2S,6S)-HNK as a potential antidepressant drug. We now report the results from the first pharmacokinetic and bioavailability studies of (2S,6S)-HNK and the comparison of the data with the results obtained after the administration of (S)-Ket and (R)-Ket.
Materials and Methods
Materials
(R)-Ket and (S)-Ket and (2S,6S)-hydroxynorketamine were synthesized as previously described (Moaddel et al. 2010). All compounds were used as the hydrochloride salt. Samples were collected from three animals for each data point in the study. Male Wistar rat brains were purchased from BioreclamationIVT (Westbury, NY). Potassium phosphate dibasic, potassium phosphate monobasic, β-nicotinamide adenine dinucleotide 2′-phosphate reduced tetrasodium salt hydrate (NADPH), (R,S)-Ket, and magnesium chloride were purchased from Sigma (St. Louis, MO).
Animals
All procedures in this study were conducted in accordance with the National Research Council (NRC) Guide for the Care and Use of Laboratory Animals (1996) and the Animal Welfare Standards incorporated in 9 CFR Part 3, 1991. Male Wistar rats were obtained from Harlan (Livermore, CA) were 9–10 weeks old, 271–354 g. They were housed 1–3 per cage, in polycarbonate hanging cages, 12 h light/12 h dark cycle, at 68–73°F, and 20–60% humidity. The rats were provided Harlan Teklad Certified Rodent Chow #2018C and water (Purified, Reverse Osmosis) ad libitum.
(2S,6S)-Hydroxynorketamine ((2S,6S)-HNK)
(2S,6S)-HNK iv
A single dose of (2S,6S)-HNK, 20 mg/kg in saline (5 mL/kg), was administered by i.v. administration via a jugular vein catheter. Blood was collected from a second jugular vein catheter (not used for dose administration) at 5, 10, 20, 40, 60, 120, 240, and 480 min and 12, 24, 48, 72 h after the dose was administered and processed to plasma. Brain specimens were collected at 5, 10, 20, 60, and 240 min and 24 h following administration. Plasma and brain samples were stored at −60 ± 10°C until analysis.
2S,6S)-HNK po
A single dose of (2S,6S)-HNK, 20 mg/kg in saline (10 mL/kg), was administered by oral gavage. Blood was collected via the jugular vein catheter at 15, 30, 60, 90, 120, 240, and 480 min after the dose was administered and processed to plasma. Plasma samples were stored at −70 ± 10°C until analysis.
(R)-Ket and (S)-Ket studies
A single dose of (S)-Ket or (R)-Ket, 20 mg/kg in saline (5 mL/kg), was administered by i.v. injection into the tail vein as a 2 min infusion. At 10, 30, and 60 min after dosing the rats were euthanized with an overdose of pentobarbital and blood samples and whole brains were promptly collected. The blood samples were processed as described above and the brains were rinsed with phosphate-buffered saline and stored frozen at 70 ± 10°C until analysis.
Brain metabolism
Preparation of rat brain S9s
Rat brains were thawed on ice, weighed and manually homogenized in 0.1 mol/L potassium phosphate buffer, pH 7.4 (three volumes of buffer per gram of tissue). The homogenate was centrifuged at 9000g at 4°C for 30 min in an Allegra 25R centrifuge (Beckman Coulter, Indianapolis, IN). The supernatant following centrifugation was retained as the S9 fraction. Protein concentration was determined using the Pierce BCA Protein Assay Kit (Thermo Scientific, Rockford, IL) and aliquots were stored at −80°C until use.
Incubation of (R,S)-ket with S9s prepared from Wistar rat brain
(R,S)-Ket (at 0.1, 1, and 10 μmol/L final) was incubated with 1 mg/mL S9s, 2.5 mmol/L NADPH and 3.3 mmol/L MgCl2 in 0.1 mol/L phosphate buffer, pH 7.4, with a final organic solvent concentration of 0.1% dimethyl sulfoxide (DMSO). Aliquots were removed at 0, 15, 30, 60, 90, and 120 min, and mixed with an equal volume of cold acetonitrile. Following brief vortex and centrifugation, supernatants were transferred to new tubes and stored at −80°C until analysis. Control incubations of (R,S)-Ket with heat-inactivated S9s, as well as incubations in the absence of (R,S)-Ket, were also performed.
General analytical procedures
The plasma and brain tissue samples collected in this study were analyzed using a previously reported achiral-chiral liquid chromatographic method utilizing mass spectrometric detection which had been validated for use with clinical samples (Moaddel et al. 2010). The achiral portion of the analytical method was cross-validated for use in this study using plasma (Bioreclamation, East Meadow, NY) and whole brains (SRI International) obtained from drug-free Wistar rats. As only the achiral analytical procedures were utilized in this study, the standards used in the validation procedure were the racemic forms of the analytes.
For plasma analyses, the calibration standards for (R,S)-Ket and (2R,6R;2S,6S)-HNK ranged from 6000 ng/mL to 5.85 ng/mL and from 600 ng/mL to 0.58 ng/mL and quantification was accomplished using area ratios calculated using D4-(R,S)-Ket as the internal standard, where the concentration of the internal standard was set at 500 ng/mL. Quality control standards used in the cross-validation and analytical runs were 187.5 ng/mL (low), 1500 ng/mL (medium), and 3000 ng/mL (high). The intraday and interday repeatability determined as coefficients-of-variance (CVs) were ≤5% and accuracies ranged from 89% to 111%.
When brain samples were analyzed, the brain was suspended in 990 μL of water:methanol (3:2, v/v) and 10 μL of 10 μg/mL of Ket-D4. The solution was homogenized on ice with a polytron homogenizer and centrifuged 21,000g for 30 min. The supernatant was extracted using 1 mL Oasis HLB solid phase extraction cartridges (Waters Corp., Waltham, MA). The cartridges were preconditioned with 1 mL of methanol, followed by 1 mL of water and then 1 mL ammonium acetate [10 mmol/L, pH 9.5]. The supernatants were added to the cartridges, followed by 1 mL of water and the compounds were eluted with 1 mL of methanol. The eluent was transferred to an autosampler vial for analysis. QC standards for the analysis of (R,S)-Ket and (2R,6R;2S,6S)-HNK ranged from 6000 ng/mL to 5.85 ng/mL and quantification was accomplished using D4-(R,S)-Ket as the internal standard. QC standards were prepared daily by adding 10 μL of the appropriate standard solution and 10 μL of internal standard solution (100 ng/mL) to methanol.
Statistical Analysis
The pharmacokinetic parameters assessed in this study were maximum plasma concentration (Cmax), time point of maximum plasma concentration (Tmax), area under the plasma concentration–time curve from 0 to infinity (AUC0−∞), half-life of drug elimination during the terminal phase (t1/2), apparent volume of distribution (Vd), and clearance (Cl). These parameters were estimated using noncompartmental analysis of WinNonlin Professional Software Version 5.2.1 (Pharsight Corporation, St. Louis, MO). The significance between datasets was determined using an unpaired Student’s t-test contained within the GraphPad Prism 4 software package (GraphPad Software, Inc., La Jolla, CA) running on a personal computer.
Results
Plasma metabolism and distribution of (2S,6S)-HNK
The only compound identified in the analysis of the plasma samples obtained after the i.v. and p.o. administration of (2S,6S)-HNK was the administered (2S,6S)-HNK (data not shown). This is consistent with the data from previous studies in the rat in which the administration of (2S,6S;2R,6R)-HNK and (2S,6S)-HNK resulted in no additional Phase I metabolites or chiral inversion of an asymmetric center (Leung and Baillie 1986; Paul et al. 2014). It should be noted that while glucoronide conjugates of (R,S)-Ket metabolites have been identified in plasma samples obtained from patients receiving (R,S)-Ket for the treatment of Complex Regional Pain Syndrome (Moaddel et al. 2010) the samples obtained in this study were not assayed for these compounds. The measured plasma concentrations of (2S,6S)-HNK at 10, 20, and 60 min after i.v. administration of (2S,6S)-HNK are presented in Table1 and the plasma concentration–time curves following i.v. and p.o. administration are presented in Figure2.
Table 1.
Plasma concentrations of Ket and (2,6)-HNK metabolites after i.v. administration to Wistar rats (20 mg/kg) of (2S,6S)-HNK, (S)-Ket, and (R)-Ket.
| Protocol | Compound | 10 min (ng/mL) | 20 min (ng/mL) | 60 min (ng/mL) |
|---|---|---|---|---|
| (2S,6S)-HNK | (2S,6S)-HNK | 11,958 ± 364 | 8344 ± 606 | 2827 ± 313 |
| (S)-Ket | (S)-Ket | 2732 ± 535 | 1002 ± 121 | 457 ± 82 |
| (2S,6S)-HNK | 722 ± 41 | 1323 ± 671 | 640 ± 1361 | |
| (2S,6R)-HNK | 177 ± 28 | 69 ± 8 | BQ | |
| (R)-Ket | (R)-Ket | 3430 ± 400 | 1420 ± 103 | 498 ± 116 |
| (2R,6R)-HNK | 345 ± 115 | 316 ± 58 | 200 ± 24 | |
| (2R,6S)-HNK | 222 ± 29 | 96 ± 6 | 35 ± 6 |
The results are presented as ng/mL with n = 3 for each data point (±SD).
Statistically significant difference (P < 0.005) between the plasma concentrations of (2S,6S)-HNK and (2R,6R)-HNK observed after administration of (S)-Ket and (R)-Ket, respectively.
Figure 2.
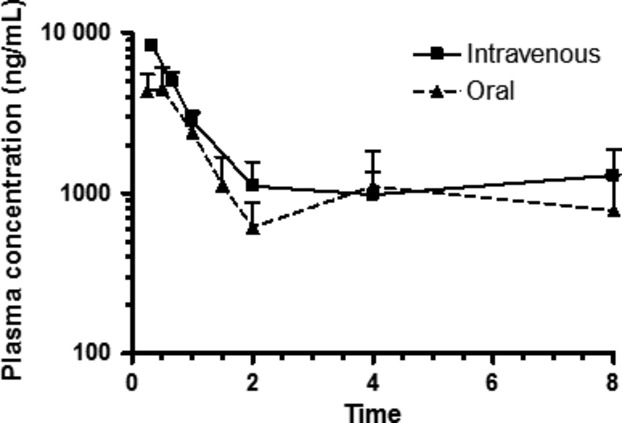
Plasma profile of (2S, 6S)-6-hydroxynorketamine administered i.v. and po routes, 20 mg/kg to male wistar rats. Each data point represents the mean ± SD for n = 3 rats. Time points were collected through 72 h, but drug was not detected in plasma samples from the final time point.
Following i.v. administration, the plasma half-life of drug elimination during the terminal phase (t1/2) was 8.0 ± 4.0 h, apparent volume of distribution (Vd) 7352 ± 736 mL/kg, the clearance (Cl) 704 ± 139 mL/h per kg and the AUCinf 29,242 ± 6421 h·ng/mL (Table2). It is interesting to note that both the apparent t1/2 (9.5 ± 5.4 h) and AUCinf (33,843 ± 4432 h·ng/mL) for (2S,6S;2R,6R)-HNK observed after the i.v. administration of (R,S)-Ket (Table S1) are similar to the values obtained after i.v. administration of (2S,6S)-HNK, which is consistent with the rapid and efficient metabolic generation of the HNK metabolite. (2S,6S)-HNK was rapidly adsorbed after p.o. administration with a Tmax of 0.4 ± 0.1 h and the observed t1/2 was 3.8 ± 0.6 h. The calculated AUCinf was 13,551 ± 1665 (h·ng/mL) and the estimated oral bioavailability was 46.3%.
Table 2.
Estimated pharmacokinetic parameters for (2S,6S)-HNK after i.v and p.o administration of 20 mg/kg (2S,6S)-HNK(±SD).
| Protocol | Compound | t1/2 (h) | Tmax (h) | Cmax (ng/mL) | AUClast (h·ng/mL) | AUCinf (h·ng/mL) | Vss (mL/kg) | Cl (mL/h per kg) |
|---|---|---|---|---|---|---|---|---|
| (2S,6S)-HNK | ||||||||
| i.v. | (2S,6S)-HNK | 8 ± 4.0 | NA | 14,754 ± 694 | 28,981 ± 6162 | 29,242 ± 6421 | 6163 ± 475.7 | 1951 ± 692 |
| p.o. | (2S,6S)-HNK | 3.78 ± 0.64 | 0.42 ± 0.14 | 4713 ± 1221 | 10,120 ± 1313 | 13,551 ± 1665 | NC | |
After i.v. administration of 20 mg/kg (S)-Ket, the parent drug and five of the eight major metabolites, see Scheme 3, were present at quantitative levels in plasma 10 min after dosing, Figure1A, Table1. The results indicate that (S)-Ket was rapidly transformed into (2S,6S)-HNK and that the circulating concentration of this metabolite exceeded the parent compound at 20 and 60 min post administration, Table1. In comparison, the chromatogram obtained 10 min after the i.v. administration of 20 mg/kg (R)-Ket demonstrated that quantifiable concentrations of the parent drug and seven of the eight potential metabolites (Scheme 3) were present in the plasma sample, Figure1B, Table1. However, unlike the data obtained after the administration of (S)-Ket, the plasma concentrations of (2R,6R)-HNK did not exceed those of (R)-Ket in the samples collected during the first 60 min after dosing, Table1. The data indicate that (S)-Ket is a more efficient source of the (2,6)-HNK metabolite as the plasma concentrations of (2S,6S)-HNK were significantly higher than (2R,6R)-HNK (P < 0.005) at the 10, 20, and 60 min sampling times. It is of interest to note that there appears to be no significant enantioselectivity in the metabolic route depicted by Pathway B in Scheme 3, which is another source of the (2,6)-HNK metabolites. While (2S,6S)-HNK and (2R,6R)-HNK are products of Pathways A and B, (2S,6R)-HNK, and (2R,6S)-HNK are only produced by Pathway B (Desta et al. 2012; Paul et al. 2014). This was confirmed in this study, where the (2S,6R;2R,6S) was not detected after the i.v. administration of (R,S)-norKet (data not shown). There were no significant differences in the plasma concentrations of (2S,6R)-HNK and (2R,6S)-HNK during the first 60 min post administration of (S)-Ket and (R)- Ket, Table1.
Figure 1.
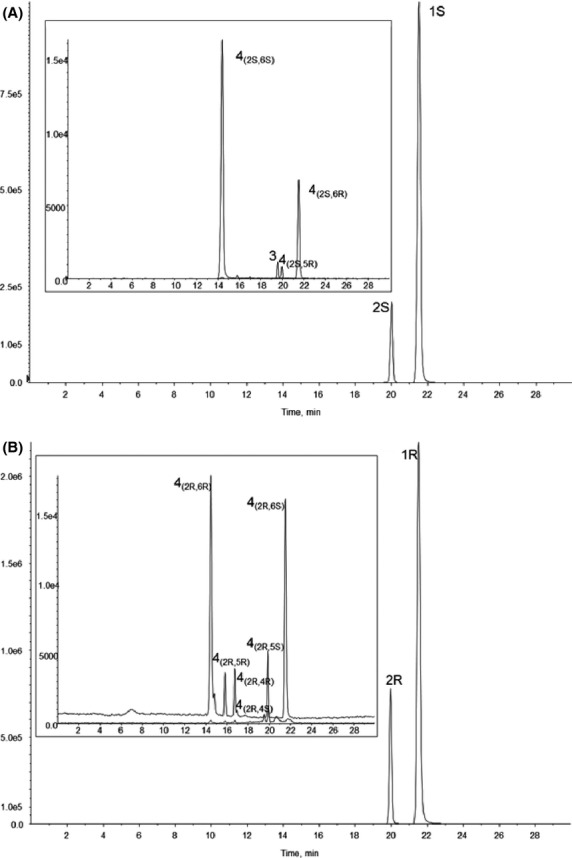
The chromatographic trace from the achiral analysis of a plasma sample obtained 10 min after administration of a 20 mg/kg dose of (S)-Ket (A) and 20 mg/kg of (R)- Ket (B), where 1 = Ket, 2 = norKet, 3 = DHNK, and 4 = HNK.
Brain tissue concentrations of (2S,6S)-HNK
As has been previously demonstrated (Paul et al. 2014) significant brain tissue concentrations of (2S,6S)-HNK were detected within 10 min following the i.v. administration of (2S,6S)-HNK and increased by ∼twofold at 60 min post administration, Table3. A similar effect was reported by Leung and Baillie (1986) over a 10 min sampling time following the administration of (2S,6S;2R,6R)-HNK. The ratio of the (2S,6S)-HNK concentration determined in brain tissues divided by the corresponding plasma concentration of (2S,6S)-HNK averaged ∼2.5-fold over the 60 min sampling period, Table3, indicating that (2S,6S)-HNK accumulated in brain tissue relative to plasma.
Table 3.
Brain tissue concentrations of Ket and (2,6)-HNK metabolites after i.v. administration to Wistar rats (20 mg/kg) of (2S,6S)-HNK, (S)-Ket, and (R)-Ket and the ratio of brain tissue concentration: plasma concentration of the analytes presented in the parenthesis under the brain tissue concentrations.
| Protocol | Compound | 10 min | 20 min | 60 min |
|---|---|---|---|---|
| (2S,6S)HNK | (2S,6S)-HNK | 30,463 ± 8412 | 29,256 ± 41442 | 6117 ± 21162 |
| (2.5) | (3.5) | (2.2) | ||
| (S)-Ket | (S)-Ket | 15,512 ± 453 | 7044 ± 3915 | 5643 ± 4125 |
| (5.7) | (7.0) | (12.3) | ||
| (2S,6S)-HNK | 657 ± 501 | 760 ± 1211 | 769 ± 1331 | |
| (0.9)ns | (0.6)ns | (1.2)ns | ||
| (2S,6R)-HNK | 103 ± 5 | 46 ± 28 | BQ | |
| (0.6) | (0.7) | |||
| (R)-Ket | (R)-Ket | 16,365 ± 1931 | 8715 ± 4433 | 5224 ± 3391 |
| (4.8) | (6.1) | (10.5) | ||
| (2R,6R)-HNK | 274 ± 47 | 191 ± 50 | 156 ± 34 | |
| (0.8) | (0.6) | (0.8) | ||
| (2R,6S)-HNK | 141 ± 20 | 78 ± 37 | 48 ± 28 | |
| (0.6) | (0.8) | (1.4) |
The results are presented as ng/g tissue with n = 3 for each data point (±SD). nsNo statistically significant differences between the ratio of brain tissue concentration: plasma concentration of (2S,6S)-HNK and (2R,6R)-HNK observed after administration of (S)-Ket and (R)-Ket, respectively.
Statistically significant difference (P < 0.005) between the brain tissue concentrations of (2S,6S)-HNK and (2R,6R)-HNK observed after administration of (S)-Ket and (R)-Ket, respectively.
Data obtained from Paul et al. (2014).
Significant concentrations of (2,6)-HNK and Ket were detected in brain tissue after administration of (R)-Ket and (S)-Ket, Table3, and other HNK metabolites were also detected (data not shown). The brain tissue concentrations of (2S,6S)-HNK were significantly greater than the corresponding concentrations of (2R,6R)-HNK, as had been observed in the plasma samples, Table1, but lower than the concentrations produced by the administration of (2S,6S)-HNK. The ratios of the (2S,6S)-HNK and (2R,6R)-HNK brain tissue concentrations divided by the corresponding plasma concentrations of (2S,6S)-HNK and (2R,6R)-HNK averaged ∼1 over the 60 min sampling period, Table3, indicating that after the administration of (S)-Ket or (R)-Ket these compounds did not accumulate in brain tissue relative to plasma. It is interesting to note that while there were statistically significant differences in the concentrations of (2S,6S)-HNK and (2R,6R)-HNK in both plasma and brain tissue samples, the brain tissue:plasma concentration ratios were not significantly different.
Quantifiable levels of the (2S,6R)-HNK and (2R,6S)-HNK metabolites were also present in the brain tissue samples during the first 20 min post administration of (S)-Ket and (R)-Ket, Table3. There were no significant differences between the brain tissue concentrations of the two metabolites. The ratios of the (2S,6R)-HNK and (2R,6S)-HNK brain tissue concentrations divided by the corresponding plasma concentrations of (2S,6R)-HNK and (2R,6S)-HNK averaged ∼1 over the first 20 min post administration, Table3, indicating that after the administration of (S)-Ket or (R)-Ket these compounds did not accumulate in brain tissue relative to plasma.
Metabolism of (R,S)-Ket by S9 and microsomes prepared from Wistar rat brain
In order to determine whether the presence of the (2,6)-HNK metabolites in rat brain tissue was due to the in situ metabolism of (R,S)-Ket in the brain, (R,S)-Ket was incubated with S9 fractions and microsomes prepared from male Wistar rat brains. The resulting incubates did not contain any known Ket metabolites (data not shown), indicating that the observed (2,6)-HNK concentrations reflected the uptake of the compounds from the circulating plasma through the blood–brain barrier.
Discussion
(R,S)-Ket was developed as an anesthetic agent and initial pharmacodynamic studies of the agent in the rat demonstrated that (R,S)-Ket and (R,S)-norKet were the source of the anesthesia and postanesthetic effects (Cohen et al. 1973; Leung and Baillie 1986). In the latter study, the administration of (R,S)-Ket to the Wistar rat produced significant plasma concentrations of (2S,6S;2R,6R)-HNK and (R,S)-norKet at 2 min after dosing. In this study, the administration of (S)-Ket and (R)-Ket resulted in the rapid production of (2S,6S)-HNK and (2R,6R)-HNK. The results suggest that the metabolic conversion of Ket to (2,6)-HNK is enantioselective favoring (2S,6S)-HNK as significantly higher plasma concentrations of this enantiomer relative to (2R,6R)-HNK were observed at the 10 min, 20 min, and 60 min sampling points. The (2S,6S)-HNK and (2R,6R)-HNK metabolites are produced by two pathways, Pathway A (Ket  norKet
  HNK) and Pathway B (Ket
  HKet
HKet  HNK), Scheme 3. Recent in vitro and in vivo studies have demonstrated that the (2S,6R)-HNK and (2R,6S)-HNK metabolites are only produced by Pathway B (Desta et al. 2012; Paul et al. 2014) and, thereby, can be used as a marker of the relative activity of this pathway. The data from this study indicates that while Pathway B contributes to the overall production of the (2S,6S)-HNK and (2R,6R)-HNK metabolites, it does not appear to be responsible for the observed enantioselectivity.
The pharmacodynamic data reported in the Leung and Baillie (1986) study demonstrated that the administration of (R,S)-Ket produced significantly longer duration of anesthesia (7 min) and increased spontaneous locomotor activity (25 min) compared to the effects produced by the administration of (R,S)-norKet (3 and 7 min, respectively) and (2S,6S;2R,6R)-HNK, which had no effect. On the basis of this observation, (2S,6S;2R,6R)-HNK was identified as an “inactive” metabolite, and subsequent pharmacokinetic and pharmacodynamic studies of (R,S)-Ket, (R,S)-norKet and their individual enantiomers did not examine the pharmacological fate of the HNK metabolites. However, we have recently demonstrated that (2S,6S)-HNK is pharmacologically active in vitro (Moaddel et al. 2013; Paul et al. 2014) and in vivo in the Wistar rat (Paul et al. 2014) and potentially plays a significant role in the antidepressant effects produced by the administration of sub-anesthetic doses of (R,S)-Ket. These observations led us to examine the pharmacokinetics and CNS distribution of (2S,6S)-HNK after i.v. and p.o. administration.
The results from this study demonstrate that following the i.v. administration of (2S,6S)-HNK, the plasma half-life of drug elimination during the terminal phase (t1/2) was 8.0 ± 4.0 h, apparent volume of distribution (Vd) 7352 ± 736 mL/kg, the clearance (Cl) 704 ± 139 mL/h per kg and the AUCinf 29,242 ± 6421 h·ng/mL. It is interesting to note that both the apparent t1/2 (9.5 ± 5.4 h) and AUCinf (33,843 ± 4432 h·ng/mL) for (2S,6S;2R,6R)-HNK observed after the i.v. administration of (R,S)-Ket (Table S1) are similar to the values obtained after i.v. administration of (2S,6S)-HNK, which is consistent with the rapid and efficient metabolic generation of the HNK metabolite. After p.o. administration of an equivalent dose of (2S,6S)-HNK, the compound was rapidly adsorbed reaching maximum plasma concentration (Tmax) at 0.4 ± 0.1 h, with a calculated t1/2 and AUCinf of 3.8 ± 0.6 h, 13,551 ± 1665 (h·ng/mL), respectively. The calculated oral bioavailability was 46.3%.
The initial studies of the anesthetic effects of (R,S)-Ket in the rat demonstrated that after i.v. administration the drug rapidly accumulates in the CNS with peak brain tissue concentrations achieved in less than 1 min and that the brain tissue concentration: plasma concentration ratios were 6.5:1 from the initial sampling time (0.5 min) to the last sampling at 10 min (Cohen et al. 1973). The data also indicated that (R,S)-norKet could be detected in plasma and brain tissues at 1 min post administration and that the relative brain tissue concentration: plasma rose to 2.5:1 at 10 min. No other metabolites were detected in the samples. In the later study of Leung and Baillie (1986), brain tissue concentrations of (R,S)-Ket, (R,S)-norKet and (2S,6S;2R,6R)-HNK were quantified at 2, 5 and 10 min after i.v. administration (40 mg/kg) of (R,S)-Ket and after dosing with each of the metabolites. The data indicated that (R,S)-Ket was rapidly converted into (R,S)-norKet and (2S,6S;2R,6R)-HNK with detectable levels of both metabolites present in brain tissues 2 min after dosing and that these levels continued to increase during the 10 min sampling period. A similar pattern was observed after the administration of (R,S)-norKet with increasing concentrations of (2S,6S;2R,6R)-HNK measured in the 2, 5, and 10 min brain samples, whereas administration of (2S,6S;2R,6R)-HNK produced no additional compounds. The concentrations of (R,S)-Ket and (R,S)-norKet in brain tissue relative to the corresponding plasma concentrations were always greater than unity while the ratios for (2S,6S;2R,6R)-HNK were slightly less than unity. The authors suggested that the brain tissue: plasma concentration ratios were most probably a reflection of the relative hydrophobicities of the compounds as a similar trend was observed in a set of experimentally determined partition coefficients where (R,S)-Ket was slightly more hydrophobic, that is, soluble in the organic phase relative to the aqueous phase, than (R,S)-norKet, whereas (2S,6S;2R,6R)-HNK was significantly less lipophilic.
The results of this study are consistent with the data reported by Leung and Baillie (1986) and our recent data (Paul et al. 2014) as there was a rapid accumulation of (2S,6S)-HNK and (2R,6R)-HNK in brain tissues after i.v. administration of (S)-Ket and (R)-Ket, respectively, and the ratio of CNS concentration to circulating plasma concentrations were equal to or slightly less than unity. As observed with the plasma concentrations of (2S,6S)-HNK and (2R,6R)-HNK, the brain tissue concentrations of (2S,6S)-HNK were significantly greater than the corresponding concentrations of (2R,6R)-HNK suggesting that the CNS uptake may proceed via a passive process. This hypothesis was supported by the determination that there was no difference in the ratios of the brain tissue:plasma concentration between the two enantiomers indicating that CNS transport was not mediated by an enantioselective process. A similar result was observed with the (2S,6R)-HNK and (2R,6S)-HNK metabolites. However, the data obtained after the administration of (2S,6S)-HNK were dramatically different. In this instance there was a significant accumulation of (2S,6S)-HNK in brain tissue producing a ∼2-fold higher concentration relative to the circulating plasma concentrations. These results suggest that there is active transport of (2S,6S)-HNK into the CNS and that (S)-Ket and (R)-Ket are also substrates of the transporter(s) responsible for this process. The data further suggest that Ket is an effective inhibitor of (2,6)-HNK transport, which when present limits the CNS penetration of (2,6)-HNK to passive diffusion. These possibilities are under investigation and the results of the studies will be reported elsewhere.
Previous studies have demonstrated that (2S,6S)-HNK and (2R,6R)-HNK are pharmacologically active compounds (Moaddel et al. 2013) and that their plasma concentrations appear to be related to a positive response to (R,S)-Ket therapy in patients suffering from bipolar depression and treatment-resistant major depressive disorder (Zarate et al., 2013). In addition, in Wistar rats, the direct administration of (2S,6S)-HNK produced increased activity of the mTOR pathway associative similar to the effect produced by (R,S)-Ket and associated with a positive anti-depressant response (Paul et al. 2014). The data from this study demonstrate that the i.v. administration of (2S,6S)-HNK is an efficient method for the delivery of this compound that results in an enhanced CNS exposure of this compound. The results also indicate that (2S,6S)-HNK can be administered as an oral medication, a potentially important advance in the treatment of depression as (R,S)-Ket and (S)-Ket are controlled substances that are administered as 40-min i.v. infusions. In addition, recent studies in mice have suggested that (R)-Ket has greater potency and longer lasting antidepressant effect than (S)-Ket (Zhang et al. 2014). The data from this study demonstrate that (2R,6R)-HNK also readily passes the blood–brain barrier and has the potential for use in the treatment of depression. The antidepressant activities and potencies of (2S,6S)-HNK and (2R,6R)-HNK are currently under investigation and the results of these studies will be presented elsewhere.
Author Contributions
Moaddel, Green, and Wainer participated in research design. Sanghvi, Dossou, Ramamoorthy, and O’Loughlin conducted experiments of this study. Moaddel, Green, and Wainer performed data analysis. Moaddel, Green, and Wainer contributed to the writing of the manuscript.
Disclosure
None declared.
Glossary
- DHNK
dehydronorketamine
- HKet
hydroxyketamine
- HNK
hydroxynorketamine
- Ket
ketamine
- norKet
norketamine
Supporting Information
Additional Supporting Information may be found in the online version of this article:
Table S1. Estimated pharmacokinetic parameters for (2S,6S;2R,6R)-HNK after a single i.v. administration of 40 mg/kg (R,S)-Ket.
References
- Bolze S, Boulieu R. HPLC determination of ketamine, norketamine and dehydronorketamine in plasma with a high-purity reversed-phase sorbent. Clin Chem. 1998;44:560–564. [PubMed] [Google Scholar]
- Cohen ML, Chan S-L, Way WL, Trevor AJ. Distribution in the brain and metabolism of ketamine in the rat after intravenous administration. Anesthesiology. 1973;39:370–376. doi: 10.1097/00000542-197310000-00003. [DOI] [PubMed] [Google Scholar]
- Desta Z, Moaddel R, Ogburn ET, Xu C, Ramamoorthy A, Venkata SLV, et al. Stereoselective and regiospecific hydroxylation of ketamine and norketamine. Xenobiotica. 2012;42:1076–1087. doi: 10.3109/00498254.2012.685777. [DOI] [PMC free article] [PubMed] [Google Scholar]
- Dwyer JM, Duman RS. Activation of mammalian target of rapamycin and synaptogenesis: role in the actions of rapid-acting antidepressants. Biol Psychiatry. 2013;73:1189–1198. doi: 10.1016/j.biopsych.2012.11.011. [DOI] [PMC free article] [PubMed] [Google Scholar]
- Hirota K, Lambert DG. Ketamine: new uses for an old drug? Br J Anaesth. 2011;107:123–126. doi: 10.1093/bja/aer221. [DOI] [PubMed] [Google Scholar]
- Leung LY, Baillie TA. Comparative pharmacology in the rat of ketamine and its two principal metabolites, norketamine and (Z)-6-hydroxynorketamine. J Med Chem. 1986;29:2396–2399. doi: 10.1021/jm00161a043. [DOI] [PubMed] [Google Scholar]
- Li N, Lee B, Lui R-J, Banasr M, Dwyer JM, Iwata X-Y, et al. mTOR-dependent synapse formation underlies the rapid antidepressant effects of NMDA antagonists. Science. 2010;329:959–964. doi: 10.1126/science.1190287. [DOI] [PMC free article] [PubMed] [Google Scholar]
- Moaddel R, Venkata SLV, Tanga MJ, Bupp JE, Green CE, LaIyer L, et al. A parallel chiral-achiral liquid chromatographic method for the determination of the stereoisomers of ketamine and ketamine metabolites in the plasma and urine of patients with complex regional pain syndrome. Talanta. 2010;82:1892–1904. doi: 10.1016/j.talanta.2010.08.005. [DOI] [PMC free article] [PubMed] [Google Scholar]
- Moaddel R, Abdrakhmanova G, Kozak J, Jozwiak K, Toll L, Jimenez L, et al. Sub-anesthetic concentrations of (R, S)-ketamine metabolites inhibit acetylcholine-evoked currents in α7 nicotinic acetylcholine receptors. Eur J Pharmacol. 2013;698:228–234. doi: 10.1016/j.ejphar.2012.11.023. [DOI] [PMC free article] [PubMed] [Google Scholar]
- Paul R, Schaaff N, Padberg F, Möller HJ, Frodl T. Comparison of racemic ketamine and S-ketamine in treatment-resistant major depression: report of two cases. World J Biol Psychiatry. 2009;10:241–244. doi: 10.1080/15622970701714370. doi: 10.1080/15622970701714370. [DOI] [PubMed] [Google Scholar]
- Paul RK, Singh NS, Khadeer M, Moaddel R, Sanghvi M, Green CE, et al. (R,S)-Ketamine metabolites (R,S)-norketamine and (2S,6S)-hydroxynorketamine increase the mammalian target of rapamycin (mTOR) function. Anesthesiology. 2014;121:149–159. doi: 10.1097/ALN.0000000000000285. [DOI] [PMC free article] [PubMed] [Google Scholar]
- Rosenberg D, Artoul S, Segal AC, Kolodney G, Radzishevsky I, Dikopoltsev E, et al. Neuronal D-serine and glycine release via the Asc-1 transporter regulates NMDA receptor-dependent synaptic activity. J Neurosci. 2013;33:3533–3544. doi: 10.1523/JNEUROSCI.3836-12.2013. [DOI] [PMC free article] [PubMed] [Google Scholar]
- Singh NS, Paul RK, Ramamoorthy A, Torjman MC, Moaddel R, Bernier M, et al. Nicotinic acetylcholine receptor antagonists alter the function and expression of serine racemase in PC-12 and 1321N1 cells. Cell Signal. 2013a;25:2634–2645. doi: 10.1016/j.cellsig.2013.08.025. [DOI] [PMC free article] [PubMed] [Google Scholar]
- Trullas R, Skolnick P. Functional antagonists at the NMDA receptor complex exhibit antidepressant actions. Eur J Pharmacol. 1990;185:1–10. doi: 10.1016/0014-2999(90)90204-j. [DOI] [PubMed] [Google Scholar]
- Turfus SC, Parkin MC, Cowan DA, Halket JM, Smith NW, Braithwaite RA, Elliot SP, Steventon GB, Kicman AT. Use of human microsomes and deuterated substrates; an alternative approach for the identification of novel metabolites of ketamine by mass spectrometry. Drug Metab Dispos. 2009;37:1769–1778. doi: 10.1124/dmd.108.026328. [DOI] [PMC free article] [PubMed] [Google Scholar]
- Williams ML, Mager DE, Parentau H, Gudi G, Tracy TS, Mulhern M, et al. Effects of protein calorie malnutrition on the pharmacokinetics of ketamine in rats. Drug Metab Dispos. 2004;32:786–793. doi: 10.1124/dmd.32.8.786. [DOI] [PubMed] [Google Scholar]
- Zarate CA, Jr, Mathews DC, Furey ML. Human biomarkers of rapid antidepressant effects (Review) Biol. Psych. 2013;73:1142–1155. doi: 10.1016/j.biopsych.2012.11.031. [DOI] [PMC free article] [PubMed] [Google Scholar]
- Zarate CA, Jr, Brutsche N, Laje G, Luckenbaugh DA, Ramamoorthy A, Moaddel R, et al. Relationship of ketamine’s plasma metabolites with response and diagnosis, and side effects in major depression. Biol Psychiatry. 2012;72:331–338. doi: 10.1016/j.biopsych.2012.03.004. [DOI] [PMC free article] [PubMed] [Google Scholar]
- Zhang J-C, Li S-X, Hashimoto K. R (−)-ketamine shows greater potency and longer lasting antidepressant effects than S (+)-ketamine. Pharmacol Biochem Behavior. 2014;116:137–141. doi: 10.1016/j.pbb.2013.11.033. [DOI] [PubMed] [Google Scholar]
- Zhao X, Venkats SLV, Moaddel R, Luckenbaugh DA, Brutsche NE, Ibrahim L, et al. Simultaneous population pharmacokinetic modeling of ketamine and three major metabolites in patients with treatment-resistant bipolar depression. Br J Clin Pharmacol. 2012;74:304–314. doi: 10.1111/j.1365-2125.2012.04198.x. [DOI] [PMC free article] [PubMed] [Google Scholar]
Associated Data
This section collects any data citations, data availability statements, or supplementary materials included in this article.
Supplementary Materials
Table S1. Estimated pharmacokinetic parameters for (2S,6S;2R,6R)-HNK after a single i.v. administration of 40 mg/kg (R,S)-Ket.