

Abstract
Individuals infected with the human immunodeficiency virus (HIV) often suffer from concomitant metabolic complications. Treatment with antiretroviral therapy has also been shown to alter the metabolism of patients. Although chemometric analysis of nuclear magnetic resonance (NMR) spectra of human sera can distinguish normal sera (HIVneg) from HIV-infected sera (HIVpos) and sera from HIV-infected patients on antiretroviral therapy (ART), quantitative analysis of the discriminating metabolites and their relationship to disease status has yet to be determined. The objectives of the study were to analyze NMR spectra of HIVneg, HIVpos, and ART serum samples with a combination of chemometric and quantitative methods and to compare the NMR data with disease status as measured by viral load and CD4 count. High-resolution magic angle spinning (HRMAS) NMR spectroscopy was performed on HIVneg (N = 10), HIVpos (N = 10), and ART (N = 10) serum samples. Chemometric linear discriminant analysis classified the three groups of spectra with 100% accuracy. Concentrations of 12 metabolites were determined with a semi-parametric metabolite quantification method named high-resolution quantum estimation (HR-QUEST). CD4 count was directly associated with alanine (p = 0.008), and inversely correlated with both glutamine (p = 0.017) and glucose (p = 0.022) concentrations. A multivariate linear model using alanine, glutamine and glucose as covariates demonstrated an association with CD4 count (p = 0.038). The combined chemometric and quantitative analysis of the data disclosed previously unknown associations between specific metabolites and disease status. The observed associations with CD4 count are consistent with metabolic disorders that are commonly seen in HIV-infected patients.
Introduction
The link between the immune and metabolic systems is clearly evident during HIV infection which triggers metabolic disorders in addition to the loss of immune reactivity; the latter is viewed as the hallmark of the acquired immune deficiency syndrome (AIDS). It is now generally understood that the virus interferes in metabolic pathways involved in general health; causing among others malabsorption, malnutrition, gradual weight loss, muscle wasting, etc. Individuals dealing with HIV/AIDS have thus been shown to suffer from metabolic complications such as diabetes, atherosclerosis, lipodystrophy and cardiovascular disease.1–4
Therapy for HIV infection is successful for most individuals but is also known to dramatically alter the metabolism of the patient. In fact, long-term treatment with anti-retroviral therapy (ART), especially protease and reverse transcriptase inhibitors, has been associated with the development of “lipodystrophy syndrome”, which is often accompanied by hyperlipidemia and insulin resistance.5 The latter disorder, insulin resistance, is also considered to be characteristic of “metabolic syndrome”, a complex disorder caused by a combination of genetic and environmental factors, which is associated with glutamine, glutamate and glutamine-to-glutamate ratio.6 It is now logical to assume infection with HIV to be one of the factors that can lead to metabolic syndrome especially because studies have shown the virus’ effect on glutamate7,8 and glutamine levels.
HIV infection also disrupts the metabolism of other amino acids9 and reducing viral load or plasma HIV RNA improves muscle amino acid metabolism.10 Amino acid metabolism plays an important role in regulating host immunity and changes in the levels of these metabolites impairs immune function and increases susceptibility to infections.11 Amino acids are involved in overlapping metabolic processes such as glycolysis and protein synthesis pathways, thus the effect of HIV infection on one pathway could have implications for the other. For example, altered amino acid metabolism may partly influence the HIV-mediated disruption in glucose metabolism that has been reported in the literature.12,13 In this study we therefore anticipated the detection of amino acids and sugars as metabolic indicators of infection or disease progression in conditions of HIV/AIDS.
Studies characterizing the metabolic profile of HIV/AIDS biofluids using proton nuclear magnetic resonance (1H NMR) spectroscopy and mass spectrometry have demonstrated the ability to detect metabolites affected by infection and treatment.14–20 Chemometric analysis of NMR spectra of human sera was shown to distinguish normal sera from that of HIV-infected individuals treated with ART and that of untreated HIV-infected individuals.15,16 Several serum metabolites that discriminate the three groups were recently identified with NMR biofluid metabonomic analyses;21 however, the absolute concentrations of the discriminating metabolites and their association with disease status have yet to be determined. Advanced methods for NMR-based metabolite quantification are now available and are used here for exploring these issues.
Even at high magnetic field strengths, NMR spectra from serum have broadened linewidths compared with spectra from typical solution-state samples which use water or deuterated water (D2O) as the vehicle. The heterogeneous composition of small-molecule metabolites, proteins and other macromolecules, and mobile lipids in sera causes it to have a higher viscosity than water or D2O, which restricts molecular motion and results in broadened linewidths. It is difficult to accurately distinguish neighbouring resonance peaks corresponding to different metabolites in spectra that have broad linewidths because the peaks often overlap. High-resolution magic angle spinning (HRMAS) NMR is a powerful analytical technique that was developed to overcome this issue and has been used to collect narrow linewidth spectra from tissue specimens22–25 and serum.26 HRMAS NMR also allows for the use of small sample volumes (10–25 μl) compared to the typical sample volume (50–500 μl) for conventional NMR.15,16 To date, no HIV metabonomic studies have been performed using HRMAS-NMR spectroscopy.
Despite the improved spectral resolution afforded by the HRMAS method, spectra from serum are still influenced by macromolecules that appear as broad resonances that span the entire baseline of the spectrum and contribute non-specifically to the area of small metabolite resonance peaks. Furthermore, variations in pH, ion concentration and intermolecular interactions may also cause shifts in the resonance frequencies of metabolites. To correct for these issues, the semi-parametric high-resolution quantum estimation (HR-QUEST) analysis method was developed specifically for quantitative analysis of HRMAS NMR data. HR-QUEST has been used to quantify metabolites in cancer biospecimens24,27 but this is the first study using HR-QUEST to interpret spectra from HIV-infected serum.
The objectives of this study were to use HRMAS NMR spectroscopy to obtain high-resolution spectral profiles of serum samples from patients infected with the HIV-1 virus (HIVpos), HIVpos patients on ART (ART), and HIV-negative control donors (HIVneg) and to analyse the data with a combination of chemometric and metabolite quantification methods (i.e. HR-QUEST) in order to determine the biological links between the spectral data and disease status. Here we present the first quantitative analysis of HIV-infected and uninfected sera, using HRMAS spectroscopy for data collection and HR-QUEST for metabolite quantification.
Materials and methods
Serum specimens
Serum samples from 20 HIV-infected patients participating in the Study of the Consequences of the Protease Inhibitor Era (SCOPE) project at the AIDS Research Institute at the University of California San Francisco (UCSF), were obtained in accordance with the ethical and privacy policies of the UCSF Committee on Human Research (CHR). At the time of collection, 10 patients were undergoing antiretroviral therapy (ART), either a combination of reverse transcriptase inhibitors (N = 8) or a combination of reverse transcriptase inhibitors and protease inhibitors (N = 2). The remaining 10 patients were untreated (HIVpos). Aliquots of serum were stored at −80 °C until further analysis.
HIV status for each patient was determined by hospital records and made available for this study. Information on treatment history for the HIV-infected subjects was determined prospectively by interview. Viral load as determined by branched DNA (bDNA) testing and real-time PCR were obtained. Control serum samples from 10 HIVneg donors were obtained from the UCSF Medical Center Blood Bank and stored in the same manner.
HRMAS NMR spectroscopy
The serum samples were thawed at room temperature and vortexed for 5–10 s to mix the contents. To provide a frequency lock and reference, 3.0 μl of D2O containing 0.75% 3-(trimethylsilyl)propionic acid-d4 sodium salt (TSP) was pipetted into the rotor and weighed to ±0.01 mg, after which a 20–25 μl sample aliquot was pipetted into the rotor and weighed. The rotor was then assembled and placed into the probe for analysis.
Spectra were acquired using a pulse-acquire sequence with pre-saturation water suppression on a 500 MHz Varian INOVA spectrometer equipped with a gHX gradient nanoprobe. Samples were evaluated at 1 °C while the serum was spun at 2250 Hz at the magic angle (theta = 54.7 degrees). The fully relaxed water pre-saturation sequence parameters were relaxation delay 2 s, saturation delay 2.5 s, pulse width = 7.8 μs, transients = 128, acquisition time 2 s, sweep width = 40 kHz, and 40 000 points. The Electronic REference To access In vivo Concentrations (ERETIC) method was used to provide a constant reference for quantifying the peak sizes in the spectrum.28 The ERETIC method inserts a radiofrequency pulse in the spectrum at a known frequency and amplitude and has been shown to be a more stable resonance amplitude reference than TSP for biospecimens, which can adsorb TSP.
Data analysis
The spectra were analysed with two different methods to determine whether there were differences between the three experimental groups. First, a chemometric method described in a previous study15 was used to compare the differences in the entire spectral profiles from each group using linear discriminant analysis (LDA). In the second method, the concentrations of 14 specific metabolites were quantified with HR-QUEST and compared among the three groups. Lastly, associations with viral load and CD4 count were investigated using complementary spectral and metabolic information gleaned from the two analytical methods. The two analytical methods are described in detail below.
Chemometric analysis of HRMAS NMR spectra
Statistical analysis was performed on the entire NMR spectrum to determine inherent patterns among experimental groups. The spectrum obtained for each serum sample was first divided into 146 segments of equal length (δ 0.03 ppm). The integrated areas of each spectral segment were used as variables in the statistical analysis.
The original serum spectrum was standardized by calculating a mean and standard deviation per subject, then subtracting the mean from each subject’s amplitude and dividing the result by the standard deviation,
where zfi is the standardized integral at frequency f for the ith individual, afi is the integrated segment at frequency f for the ith individual, āi is the mean value of the 146 integrated segments for the ith individual, and si is the standard deviation of the 146 integrated segments for the ith individual. The result was that the standardized spectra for each individual had a mean of 0 and a standard deviation of 1.
The mean standardized spectra of the three groups (HIVneg, ART, and HIVpos) were compared with analysis of variance (ANOVA) F-tests. An alpha level of p < 0.05 was used to establish whether or not there were significant differences between two or more of the groups. To determine whether the spectral data could be used to classify the three experimental groups, a stepwise linear discriminant analysis routine was performed. All 146 integral segments were used as inputs in a stepwise fashion and a Wilks’ Lambda was calculated at each step. The criterion for inclusion in the LDA model was minimization of the Wilks’ Lambda with a p-value of 0.085 or less while the criterion for removal was a p-value of 0.21 or greater.
Quantitative analysis of HRMAS NMR spectra
Metabolite concentrations were quantified in each spectrum using the HR-QUEST semi-parametric time-domain fitting algorithm.27 Briefly, the first two time points of the free induction decay (FID) were calculated by linear prediction prior to Fourier transformation to correct for any distortion resulting from transient effects after the application of the radiofrequency (RF) excitation pulse. A basis set of spectra created from solutions with known concentrations of metabolites were fit to the acquired spectra using a non-linear least squares method. A residual spectrum was generated by subtracting the fitted spectrum from the acquired spectrum and the standard deviation of the residual spectrum, represented as the Cramer Rao Lower Bound (CRLB) error, was used as a measure of the accuracy of the fit. To improve the fit, the macromolecules remaining in the residual spectrum were estimated using Hankel Lanczos Singular Value Decomposition and removed from the acquired spectrum. The frequency and phase of individual peaks within the basis spectrum were also adjusted to account for differences in the molecular environments of metabolites in serum and in the buffered solution used for the basis spectra. The fit routine and CRLB error measurement was then repeated iteratively until the CRLB error was minimized for the 14 metabolites. The final concentration of each fitted metabolite was calculated using the ERETIC peak as the amplitude reference, the mass of each serum specimen, and the concentration of each metabolite in the basis set.
The basis set used in this study was comprised of 23 resonance peaks representing 14 metabolites. However, only 12 metabolites met our criterion for accurate quantification of CRLB error of ≤5%. The metabolites and their resonance frequencies were (metabolite; multiplicity, δ): alanine (Ala; d 1.48, q 3.78), creatine (Cre; s 3.91, s 3.03), glycerophosphocholine (GPC; m 4.31, m 3.95–3.87, m 3.66, s 3.21), phosphorylcholine (PC; m 4.28, m 3.64, s 3.21), free choline (Cho; m 4.05, m 3.50, s 3.19), glutamine (Gln; t 3.75, m 2.45–2.43, m 2.13–2.11), glutamate (Glu; dd 3.74, m 2.35–2.34, m 2.12–2.04), lactate (Lac; d 1.33, q 4.12), taurine (Tau, t 3.26, t 3.43), valine (Val; 0.99 d, 1.05 d, 3.66 d), α/β-glucose (α; d 5.22, dd 3.83, m 3.82, dd 3.75, t 3.70, dd 3.52, t 3.40. β; d 4.63, dd 3.88, dd 3.71, t 3.47, m 3.45, t 3.39, dd 3.23) and glycine (Gly; s 3.56). Myo-inositol and glutathione were also included in the basis set but did not meet the CRLB error threshold for inclusion in the study. The chemical shifts and multiplicities were assigned according to the values published by Govindaraju et al.29
Statistical analysis
All statistical analysis was performed using Statistical Package for the Social Sciences (SPSS version 20.0, IBM Corp., Armonk, NY) software. Non-parametric tests were used to compare the concentrations of specific metabolites among the three groups. A Kruskal–Wallis test was used to look for differences across all three groups and a Mann–Whitney U test was used for pairwise comparisons. Associations between metabolite concentrations and both viral load and CD4 count were investigated with a Spearman Rank correlation. Lastly a linear regression model was constructed using CD4 count as the dependent variable and multiple metabolite concentrations as covariates to determine whether a combination of metabolites was associated with CD4 count. An alpha level of p ≥ 0.05 was used as a threshold for statistical significance for all.
Results
Experimental profiles
Fig. 1 shows a representative 500 MHz 1H HRMAS NMR spectrum obtained from HIVneg human serum. The subject ages, viral load, and CD4 count for the three experimental groups were (mean ± SD): HIVpos (41.2 ± 6.2, 1.1 × 10⁵ ± 1.3 × 10⁵, 343 ± 169), HIVneg (49.6 ± 8.3, 0, 952 ± 204), and ART (48.5 ± 9.3, 60 ± 17, 376 ± 118), respectively. Of the 30 serum samples that were studied with HRMAS NMR, only 28 spectra were included in the analysis due to mechanical and/or sample preparation errors that occurred during the experiments on two of the HIVneg samples. The study cohort, therefore, was comprised of spectra from 10 HIVpos, 8 HIVneg, and 10 ART serum samples. The viral load for the HIVpos group was higher than that of the HIVneg and ART groups (p = 0.02, ANOVA with Tukey post hoc test) and the CD4 count for the HIVneg group was higher than that of the HIVpos and ART groups (p < 0.001, ANOVA with Tukey post hoc test). These results confirmed that our three experimental groups had the expected differences in clinical biomarkers of disease status.
Fig. 1.

A representative 1H HRMAS NMR spectrum of serum from an HIVneg donor. Chemical shift assignments of metabolites are based on published literature.
Analysis of variance and linear discriminant analysis
Comparison of the spectra with ANOVA showed significant differences among the three experimental groups for 19 of the 146 integrated spectral segments. Subsequent multivariate analysis using stepwise LDA resulted in a model that was able to classify spectra from the three study groups with 100% accuracy. These data are in agreement with what was accomplished in previous studies15,16 from our group with spectra collected with standard (non-HRMAS) NMR methods. The striking similarity in the results from our previous study of HIV-1-infected serum from South African, low-income patients and the current study of HIV-1-infected serum from patients living in urban areas of the United States suggests that the metabolic differences are not significantly influenced by lifestyle.
Fig. 2 is a scatter plot of the results of the classification and shows that Function 1 of the LDA model primarily separates spectra from HIVpos sera from that of the other two groups while Function 2 primarily separates spectra from ART sera from that of the other two groups. The main differences observed between the three experimental groups in the previous studies15,16 and the present work were in spectral regions that represent lipids and glycerol, glucose and amino acids. This was not unexpected because numerous studies already implicated HIV as interfering in amino acid7–9 and glucose metabolism12,13 and the involvement of HIV in lipid metabolism disorders is notorious. In the following sections, we attempt to identify and quantify the specific metabolites that are altered and investigate their associations with disease status.
Fig. 2.
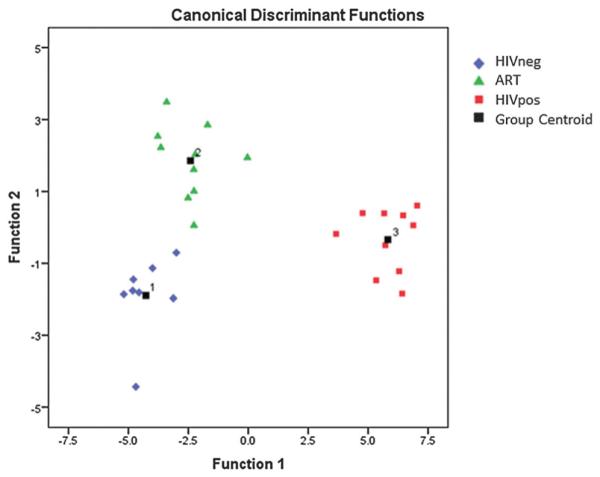
Scatter plot of the discriminant functions for the three groups: 8 HIVneg (blue), 10 ART (green) and 10 HIVpos (red).
Metabolite quantification
HR-QUEST was used to quantify the concentrations of 12 metabolites from 24 of the 28 spectra analysed with LDA. Although the LDA analysis in the current and prior studies showed that integrated spectral segments in the lipid region of the spectra were substantially different among the three experimental groups, we did not include lipids in the quantitative analysis because they arise from overlapping signals of a large ensemble of similar compounds and the HR-QUEST method was not well suited to quantify them. Also the CRLB error of several metabolites in four of the spectra analysed with LDA did not meet the 5% or less accuracy criterion. The resulting experimental cohort that underwent quantitative analysis was comprised of spectra from 9 HIVpos, 7 HIVneg, and 8 ART serum samples.
Table 1 lists the mean concentrations of the 12 quantified metabolites in each group. We found no significant differences among the metabolite concentrations of the three experimental groups (Kruskal–Wallis non-parametric test). However, pairwise comparison of the groups revealed trends toward higher concentrations of alanine in HIVneg versus ART (p = 0.10) and HIVpos (p = 0.07).
Table 1.
Metabolite concentrations (mean ± SD) and Kruskal–Wallis p-values for the HIVpos, ART, and HIVneg sera. Concentrations are expressed in mol kg−1 × 10⁻³
| HIVpos | ART | HIVneg | p | |
|---|---|---|---|---|
| Alanine | 0.351 ± 0.235 | 0.320 ± 0.198 | 0.393 ± 0.079 | 0.10 |
| Choline | 0.105 ± 0.043 | 0.141 ± 0.074 | 0.111 ± 0.051y | 0.54 |
| Creatine | 0.027 ± 0.029 | 0.014 ± 0.009 | 0.010 ± 0.006 | 0.18 |
| Glutamine | 1.333 ± 0.578 | 1.285 ± 0.493 | 0.908 ± 0.446 | 0.30 |
| Glutamate | 0.459 ± 0.118 | 0.341 ± 0.167 | 0.517 ± 0.256 | 0.34 |
| Glycine | 0.430 ± 0.191 | 0.381 ± 0.174 | 0.357 ± 0.155 | 0.81 |
| Glycerophosphocholine | 0.070 ± 0.049 | 0.080 ± 0.063 | 0.077 ± 0.039 | 0.98 |
| Lactate | 4.853 ± 3.033 | 4.171 ± 1.780 | 3.846 ± 1.320 | 0.92 |
| Phosphocholine | 0.052 ± 0.011 | 0.073 ± 0.028 | 0.064 ± 0.033 | 0.42 |
| Taurine | 0.376 ± 0.214 | 0.459 ± 0.104 | 0.413 ± 0.110 | 0.35 |
| Valine | 0.286 ± 0.187 | 0.299 ± 0.250 | 0.369 ± 0.159 | 0.54 |
| Glucose | 4.182 ± 2.329 | 3.550 ± 1.115 | 3.135 ± 0.951 | 0.60 |
LDA-directed assessment of metabolites
To determine which, if any, of the quantified metabolites contributed to the LDA classification model, the integrated spectral segments that had the highest coefficients in Functions 1 and 2 were compared with the resonance frequencies of the quantified metabolites. Fig. 3 shows example spectra from HIVneg (top), HIVpos (middle), and ART (bottom) sera. The grey shading indicates regions with the highest coefficients in Function 1 (light grey) and Function 2 (dark grey) that were also resonance peaks that were quantified with HR-QUEST. The coefficients of the 10 integrated spectral segments used in the classification model are shown in Table 2.
Fig. 3.

Representative HRMAS NMR spectra from HIVneg (top), HIVpos (middle), and ART (bottom) serum. Regions with the highest coefficients in Function 1 (light grey) and Function 2 (dark grey) of the LDA classification model are highlighted.
Table 2.
Coefficients of Functions 1 and 2 of the LDA classification. The segment name indicates the beginning of the 0.03 ppm integrated segment of spectrum that was used in the model. The last column lists quantified metabolites that have resonance peaks in or near the spectral segment9
| Integrated spectral segment (ppm) |
Function 1 | Function 2 | Metabolite |
|---|---|---|---|
| 4.66 | 3.880 | 1.544 | Glucose |
| 4.18 | −0.634 | 1.077 | Lactate |
| 3.67 | 3.769 | −0.577 | GPC |
| 3.64 | −2.911 | 1.401 | |
| 3.55 | 2.406 | −1.174 | |
| 3.40 | −7.320 | −0.200 | Taurine, glucose |
| 2.14 | 9.111 | −1.353 | Glutamine, glucose |
| 1.66 | −2.531 | 1.122 | |
| 1.06 | −7.394 | 0.903 | Valine |
| 0.64 | 3.209 | −1.398 |
The spectral segment with the highest coefficient in Function 1, which separated HIVpos spectra from the other two groups, was 2.14–2.17 ppm (Table 2 and Fig. 3). Glutamine has resonance peaks near 2.14 ppm, 2.45 ppm, and 3.78 ppm. The integral segment that contained the 2.45 ppm resonance was found to be significantly different among the three experimental groups by ANOVA although it was not a component of the LDA model. The 3.78 ppm glutamine peak overlaps with both glutamate and glucose, which may be the reason why it was not found to be different among the groups. These data suggest that Function 1 of the LDA model may be strongly influenced by differences in glutamine concentrations among the three experimental groups.
The next highest coefficient in Function 1 was assigned to the 1.06–1.09 ppm segment, which is near one of the four resonance peaks for valine. None of the other three valine resonances were in regions found to be different between the three experimental groups. Furthermore, valine was difficult to fit with the basis spectrum and only had acceptable CRLB in 19 of the 24 cases. Although there was a clear valine doublet peak in the 1.06–1.09 ppm regions in most of the spectra (Fig. 3), it resides in the valley between two lipid resonances at 0.9 ppm and 1.3 ppm, which influenced the baseline in that region of the spectrum. It is possible, therefore, that the differences in the integrated area of the 1.06–1.09 ppm region is due more to the differences in lipid concentrations among the groups than to valine concentrations.
The third highest coefficient of Function 1 was for the 3.40–3.43 ppm segment, which contains one of the two resonance peaks for taurine. Taurine has triplet resonance peaks near 3.42 and 3.25 ppm. The integral segment that contained the 3.25 ppm resonance was found to be significantly different among the three experimental groups by ANOVA although it was not a component of the LDA model. It should be noted, however, that glucose also has resonance peaks at 3.41 and 3.25 ppm that overlap with taurine. These data suggest that, in addition to glutamine, Function 1 of the LDA model may also be strongly influenced by differences in taurine and/or glucose concentrations among the three experimental groups.
Applying the same analysis to the Function 2 spectral segments, which separated ART serum samples from the other two groups, the segment with the highest coefficient was at 4.66 ppm corresponding to the glucose β anomer H-1 doublet. The other resonance peaks of glucose overlap with glutamine and taurine peaks which, as stated above, adds some uncertainty as to the true source of the Function 1 peaks.
The spectral segments with the next highest coefficients in Function 2 corresponded to metabolites that were not included in the basis set or were not adequately fit by HR-QUEST (glycerol and myo-inositol near 3.64–3.67 ppm, respectively) or were spectral regions that were fit as macromolecules and removed during the HR-QUEST algorithm (0.64–0.67 ppm). As with Function 1, the 2.14–2.17 ppm spectral segment that is one of the three glutamine peaks also had a relatively strong contribution to Function 2 and may be altered by both HIV infection and ART treatment. Taken together, these results suggest that specific metabolites, and not just the integrated spectral segments, may be indicators of disease status. We explore this further in the next section.
Associations between metabolites, viral load and CD4 counts
The results from the previous two sections suggest that alanine, glutamine, valine, taurine, and glucose may be altered during HIV infection and/or after treatment with ART. The trend toward lower alanine in sera from HIV-infected patients and the repeated involvement of spectral resonances from the other four metabolites in the LDA model suggest an association with disease status may exist despite the lack of a statistical difference in the metabolite concentrations among the three experimental groups. To determine whether there was an association between metabolite concentrations and disease progression, Spearman correlations were performed between all 12 metabolites, the viral load and CD4 count.
There was an inverse correlation between viral load and alanine (r = −0.426, p = 0.043) among the entire cohort (N = 24) and among the group of HIVpos cases only (r = −0.850, p = 0.004, N = 9). This suggested that the relationship was not simply due to the fact that HIVneg and ART cases had negligible viral load but to the fact that, among cases with measurable viral load, alanine levels were lower when the viral loads were higher.
CD4 count was directly associated with alanine (r = 0.539, p = 0.008), providing further evidence for low serum alanine levels being an indicator of disease progression. CD4 count was also inversely correlated with both glutamine (r = −0.482, p = 0.017) and glucose (r = −0.465, p = 0.022). Based on these results, we constructed a multivariate linear model using alanine, glutamine and glucose as covariates that demonstrated a positive association with CD4 count (p = 0.038).
Fig. 4 shows plots of (A) alanine, (B) glutamine, and (C) glucose versus CD4 count for the three experimental groups. In all three graphs, the HIVneg cases (green circles) are clearly separated from the other two groups suggesting that the model may primarily reflect the different metabolite levels in HIV-infected and uninfected sera. To determine whether the same metabolites were associated with CD4 count in the subset of HIV-infected patients (HIVpos and ART groups combined), the groups for which CD4 count is a clinical indicator of disease progression and response to therapy, we performed a Spearman correlation within that subset of patients only. Again, the only metabolites that showed either trends or significant associations with CD4 count were alanine (r = 0.371, p = 0.158), glutamine (r = −0.422, p = 0.092), and glucose (r = −0.564, p = 0.018) and a multivariate model using these metabolites as covariates showed a significant association with CD4 count (p = 0.036).
Fig. 4.

Correlation of (A) alanine, (B) glutamine, and (C) glucose with CD4 count in HIVpos, HIVneg, and ART sera.
Discussion
A number of NMR metabonomic studies have identified spectral regions with which to distinguish HIVpos from HIVneg and/or treated biofluid samples.14–17,19,21 These studies also speculated on metabolic pathways associated with these spectral regions but specifics on metabolite concentrations and their associations with indicators of disease progression were rarely attempted.18 In this paper, we present evidence that alanine levels decrease, while glutamine and glucose levels increase with disease severity, as measured by a reduction in CD4 counts.
CD4 is a glycoprotein that is expressed on the surface of immune cells that decrease in number with the severity of HIV-infection. Immune cells such as CD4-positive lymphocytes consume glucose and glutamine at an extremely high rate,30 which may explain why serum levels of these metabolites increase as the number of healthy circulating lymphocytes decreases. Glycolysis and glutaminolysis in immune cells occur at rates that are much higher than needed for producing intermediates for maintenance of biosynthetic pathways and are thought to also be utilized to generate reserves of metabolic intermediates for rapid utilization during proliferation, to provide energy for the cells (particularly glutaminolysis), and for the secretion of free radicals and cytokines.31
In many cells, glutamine metabolism also promotes glutamate-mediated transamination of pyruvate to alanine;6 however, transamination processes in lymphocytes results in aspartate, rather than alanine.30,31 Therefore it is not likely that the decreased serum alanine levels in HIV-infected patients in this study was related to the low number of CD4-positive lymphocytes. Alanine is a highly gluconeogenic amino acid that is released from energy-depleted muscle and taken up by the liver to form glucose which is then secreted back into the circulation and used by muscle cells as an energy source, in a process known as the ‘glucose–alanine cycle’.32 A more likely reason for the lower serum alanine levels is the high incidence of muscle wasting among HIV-infected patients. Yarasheski et al. reported an increased muscle proteolysis/synthesis rate in HIV-infected patients33 that was reversed when HIV RNA levels decreased after ART.10 A plausible hypothesis is that alanine levels are influenced by the deleterious effect that HIV has on muscle protein synthesis. Taken together, the increased serum levels of glucose and glutamine and concomitant decrease in alanine that we observed with increasing disease severity may result from the loss of both lymphocytes and myocytes and their associated metabolic processes. It should be noted that amino acid and glycolytic metabolism are disrupted by several disease processes that are comorbidities of HIV-infection; therefore the observed associations may be due either to HIV-infection directly or an accompanying metabolic disorder.
A limitation of this study incorporating quantitative NMR to investigate metabolic alterations associated with HIV infection and treatment was the use of a pulse-acquire sequence, which did not allow for discrimination of metabolites in the lipid region of the spectrum. We considered using a Carr–Purcell–Meiboom–Gill (CPMG) sequence that could be manipulated to filter out resonance peaks with different T2 relaxation properties; however, we did not have a basis set of spectra that were acquired with such a sequence, that could be used with HR-QUEST to calculate accurate metabolite concentrations. Future studies should definitely incorporate methods that can quantify the specific lipids that are altered in these patients as the chemometric analysis indicated that resonance peaks in the lipid region accounted for much of the metabolic differences between the three groups. The fact that metabolic alterations associated with CD4 status were discovered in the face of this limitation; however, bodes well for the success of such future studies. This suggests that the combination of chemometric and quantitative analytical techniques used in the current study is clearly amenable to the investigation of any metabolic disorder such as metabolic syndrome.
Conclusion
Constant monitoring of patients by laboratory testing plays a critical role in successful HIV/AIDS management.14 Definitive monitoring of both HIV disease progression and response to treatment currently relies on CD4 count, viral load, protein and other macromolecular markers.34,35 Metabonomics techniques show promise for HIV/AIDS management15 and is currently being used to identify and quantify potential biomarkers associated with infection, response to treatment or disease progression;36 however, the independent association between metabolites and clinical outcome still needs to be validated. The implications of our study suggest that metabonomics may also be useful for identifying the metabolic origin of comorbidities and the impact of therapies designed to treat them.
Acknowledgements
The authors would like to thank Dr John Kurhanewicz, Director of the UCSF Biomedical NMR Laboratory, Dr Girish Vyas of the UCSF Blood Bank, and the UCSF AIDS Research Institute.
Abbreviations
- HRMAS
High-resolution magic angle spinning
- HIV
Human immunodeficiency virus
- AIDS
Acquired immunodeficiency syndrome
References
- 1.Friis-Moller N, Weber R, Reiss P, Thiebaut R, Kirk O, d‘Arminio Monforte A, Pradier C, Morfeldt L, Mateu S, Law M, El-Sadr W, De Wit S, Sabin CA, Phillips AN, Lundgren JD. AIDS. 2003;17:1179–1193. doi: 10.1097/01.aids.0000060358.78202.c1. [DOI] [PubMed] [Google Scholar]
- 2.Koutkia P, Grinspoon S. Annu. Rev. Med. 2004;55:303–317. doi: 10.1146/annurev.med.55.091902.104412. [DOI] [PubMed] [Google Scholar]
- 3.Schuster I, Thoni GJ, Ederhy S, Walther G, Nottin S, Vinet A, Boccara F, Khireddine M, Girard PM, Mauboussin JM, Rouanet I, Dauzat M, Cohen A, Messner-Pellenc P, Obert P. Am. J. Cardiol. 2008;101:1213–1217. doi: 10.1016/j.amjcard.2007.11.073. [DOI] [PubMed] [Google Scholar]
- 4.Villarroya F, Domingo P, Giralt M. Trends Pharmacol. Sci. 2005;26:88–93. doi: 10.1016/j.tips.2004.12.005. [DOI] [PubMed] [Google Scholar]
- 5.Jain RG, Furfine ES, Pedneault L, White AJ, Lenhard JM. Antiviral Res. 2001;51:151–177. doi: 10.1016/s0166-3542(01)00148-6. [DOI] [PubMed] [Google Scholar]
- 6.Sookoian S. World J. Gastroenterol. 2012;18:3775. doi: 10.3748/wjg.v18.i29.3775. [DOI] [PMC free article] [PubMed] [Google Scholar]
- 7.Eck HP, Frey H, Droge W. Int. Immunol. 1989;1:367–372. doi: 10.1093/intimm/1.4.367. [DOI] [PubMed] [Google Scholar]
- 8.Porcheray F, Leone C, Samah B, Rimaniol AC, Dereuddre-Bosquet N, Gras G. Am. J. Physiol.: Cell Physiol. 2006;291:C618–C626. doi: 10.1152/ajpcell.00021.2006. [DOI] [PubMed] [Google Scholar]
- 9.Hortin GL, Landt M, Powderly WG. Clin. Chem. 1994;40:785–789. [PubMed] [Google Scholar]
- 10.Yarasheski KE, Smith SR, Powderly WG. Am. J. Physiol.: Endocrinol. Metab. 2005;288:E278–E284. doi: 10.1152/ajpendo.00359.2004. [DOI] [PMC free article] [PubMed] [Google Scholar]
- 11.Li P, Yin YL, Li D, Kim SW, Wu G. Br. J. Nutr. 2007;98:237–252. doi: 10.1017/S000711450769936X. [DOI] [PubMed] [Google Scholar]
- 12.Lutz NW, Yahi N, Fantini J, Cozzone PJ. AIDS. 1997;11:147–155. doi: 10.1097/00002030-199702000-00003. [DOI] [PubMed] [Google Scholar]
- 13.Weis BC, Margolis D, Burgess SC, Merritt ME, Wise H, Sherry AD, Malloy CR. Magn. Reson. Med. 2004;51:649–654. doi: 10.1002/mrm.20057. [DOI] [PubMed] [Google Scholar]
- 14.Ghannoum MA, Mukherjee PK, Jurevic RJ, Retuerto M, Brown RE, Sikaroodi M, Webster-Cyriaque J, Gillevet PM. OMICS. 2013;17:5–15. doi: 10.1089/omi.2011.0035. [DOI] [PMC free article] [PubMed] [Google Scholar]
- 15.Hewer R, Vorster J, Steffens FE, Meyer D. J. Pharm. Biomed. Anal. 2006;41:1442–1446. doi: 10.1016/j.jpba.2006.03.006. [DOI] [PubMed] [Google Scholar]
- 16.Philippeos C, Steffens FE, Meyer D. J. Biomol. NMR. 2009;44:127–137. doi: 10.1007/s10858-009-9329-8. [DOI] [PubMed] [Google Scholar]
- 17.Riddler SA, Li X, Otvos J, Post W, Palella F, Kingsley L, Visscher B, Jacobson LP, Sharrett AR. J. Acquired Immune Defic. Syndr. 2008;48:281–288. doi: 10.1097/QAI.0b013e31817bbbf0. [DOI] [PubMed] [Google Scholar]
- 18.Sitole LJ, Williams AA, Meyer D. Mol. BioSyst. 2013;9:18–28. doi: 10.1039/c2mb25318f. [DOI] [PubMed] [Google Scholar]
- 19.Swanson B, Sha BE, Keithley JK, Fogg L, Nerad J, Novak R, Adeyemi O. J. Clin. Lipidol. 2009;3:379–384. doi: 10.1016/j.jacl.2009.10.005. [DOI] [PMC free article] [PubMed] [Google Scholar]
- 20.Williams A, Koekemoer G, Lindeque Z, Reinecke C, Meyer D. Metabolomics. 2011;8:804–818. [Google Scholar]
- 21.Munshi SU, Rewari BB, Bhavesh NS, Jameel S. PLoS One. 2013;8:e64298. doi: 10.1371/journal.pone.0064298. [DOI] [PMC free article] [PubMed] [Google Scholar]
- 22.Ben Sellem D, Elbayed K, Neuville A, Moussallieh FM, Lang-Averous G, Piotto M, Bellocq JP, Namer IJ. J. Oncol. 2011;2011:174019. doi: 10.1155/2011/174019. [DOI] [PMC free article] [PubMed] [Google Scholar]
- 23.Chan EC, Koh PK, Mal M, Cheah PY, Eu KW, Backshall A, Cavill R, Nicholson JK, Keun HC. J. Proteome Res. 2009;8:352–361. doi: 10.1021/pr8006232. [DOI] [PubMed] [Google Scholar]
- 24.McKnight TR, Smith KJ, Chu PW, Chiu KS, Cloyd CP, Chang SM, Phillips JJ, Berger MS. J. Magn. Reson. Imaging. 2011;33:808–816. doi: 10.1002/jmri.22517. [DOI] [PMC free article] [PubMed] [Google Scholar]
- 25.Rocha CM, Barros AS, Gil AM, Goodfellow BJ, Humpfer E, Spraul M, Carreira IM, Melo JB, Bernardo J, Gomes A, Sousa V, Carvalho L, Duarte IF. J. Proteome Res. 2010;9:319–332. doi: 10.1021/pr9006574. [DOI] [PubMed] [Google Scholar]
- 26.Jordan KW, Adkins CB, Su L, Halpern EF, Mark EJ, Christiani DC, Cheng LL. Lung Cancer. 2010;68:44–50. doi: 10.1016/j.lungcan.2009.05.012. [DOI] [PMC free article] [PubMed] [Google Scholar]
- 27.Ratiney H, Albers MJ, Rabeson H, Kurhanewicz J. NMR Biomed. 2010;23:1146–1157. doi: 10.1002/nbm.1541. [DOI] [PMC free article] [PubMed] [Google Scholar]
- 28.Albers MJ, Butler TN, Rahwa I, Bao N, Keshari KR, Swanson MG, Kurhanewicz J. Magn. Reson. Med. 2009;61:525–532. doi: 10.1002/mrm.21808. [DOI] [PMC free article] [PubMed] [Google Scholar]
- 29.Govindaraju V, Young K, Maudsley AA. NMR Biomed. 2000;13:129–153. doi: 10.1002/1099-1492(200005)13:3<129::aid-nbm619>3.0.co;2-v. [DOI] [PubMed] [Google Scholar]
- 30.Newsholme EA, Crabtree B, Ardawi MS. Q. J. Exp. Physiol. 1985;70:473–489. doi: 10.1113/expphysiol.1985.sp002935. [DOI] [PubMed] [Google Scholar]
- 31.Newsholme P, Curi R, Pithon Curi TC, Murphy CJ, Garcia C, Pires de Melo M. J. Nutr. Biochem. 1999;10:316–324. doi: 10.1016/s0955-2863(99)00022-4. [DOI] [PubMed] [Google Scholar]
- 32.Garber AJ, Karl IE, Kipnis DM. J. Biol. Chem. 1976;251:826–835. [PubMed] [Google Scholar]
- 33.Yarasheski KE, Zachwieja JJ, Gischler J, Crowley J, Horgan MM, Powderly WG. Am. J. Physiol. 1998;275:E577–E583. doi: 10.1152/ajpendo.1998.275.4.E577. [DOI] [PMC free article] [PubMed] [Google Scholar]
- 34.Calabrese LH, Proffitt MR, Gupta MK, Easley KA, Walker JR, Rehm SJ, Valenzuela R, Clough JD. AIDS Res. 1984;1:423–438. doi: 10.1089/aid.1.1983.1.423. [DOI] [PubMed] [Google Scholar]
- 35.Kanekar A. J. Clin. Med. Res. 2010;2:55–61. doi: 10.4021/jocmr2010.03.255w. [DOI] [PMC free article] [PubMed] [Google Scholar]
- 36.Beger RD, Colatsky T. Metabolomics. 2011;8:2–7. [Google Scholar]