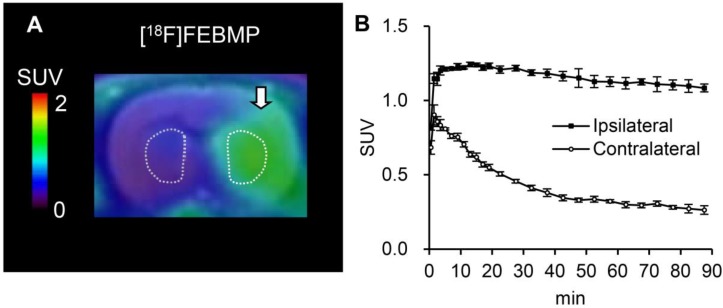
Figure 2.
In vivo imaging with [18F]FEBMP in ischemic rat brains. A: Representative coronal PET image (summation of 0-90 min) was overlaid on the MRI template of a rat brain. The arrow indicates the ischemic areas. B: Time-activity curve for the ipsilateral and contralateral striatum. Data (mean ± SEM, n = 3) were from three ischemic rat brains. SUV, standardized uptake value.

