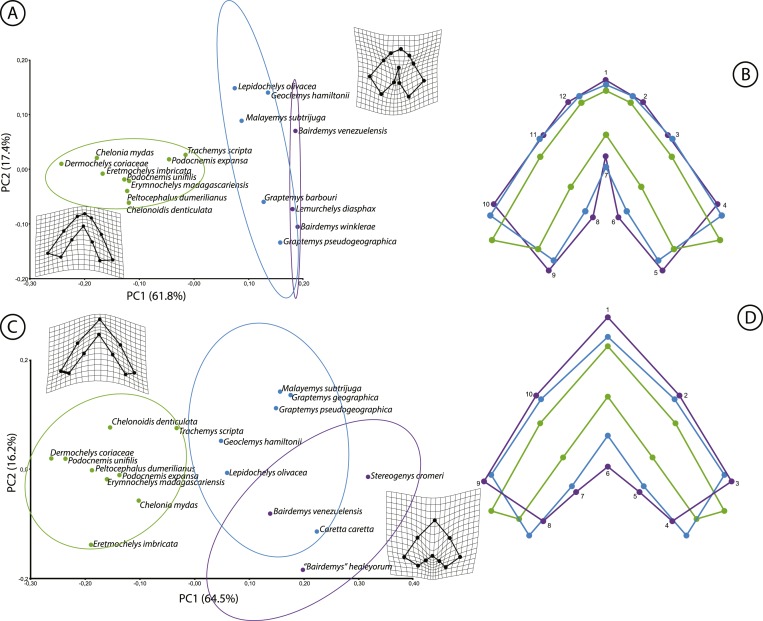
Figure 7. Results of the geometric morphometric analyses.
Principal component analysis (A and C) derived from the first two principal components (PC1 and PC2) and comparison of the mean values of the coordinates (B and D) for the upper (A and B) and the lower jaws (C and D). D’Arcy Thompson grids correspond to extreme shape variation. Durophagous taxa are represented in blue, non-durophagous in green, and fossil taxa with unknown diet in purple.

