

Abstract
We identified and measured proteins in the cerebral spinal fluid (CSF) involved in HIV-associated neurological disorders. Protein levels were determined by mass spectrometry (MS) in pooled CSF taken from three patient groups (human immunodeficiency virus (HIV)-1-infected patients that developed HIV-associated neurocognitive disorders (HANDs), HIV-1-infected patients without HAND, and healthy controls). Pools were generated from 10 patients each per group. CSF from individual patient groups were digested with trypsin and separately labeled using with isobaric tags for relative and absolute quantitation (iTRAQ). After combining all samples in one, peptides were extensively fractionated by offline two-dimensional separation and identified by tandem MS. One hundred and ninety three proteins were deemed to be interpretable for quantitation based on permutation tests with a 95 % confidence interval with a p value≤0.05. Using a cutoff of 1.5-fold for upregulation and 0.6 for downregulation, 16 proteins were differentially expressed in HIV+HAND (reporter p value ≤0.05) with seven of them previously described as HIV-interacting proteins: endoplasmin, mitochondrial damage mediator-BH3-interacting domanin death agonist, orosomucoid, apolipoprotein E, metalloproteinase inhibitor 2, peroxiredoxin-2, and the nuclear protein, ruvB-like 2. Several previously unidentified proteins with possible neurological implication in HIV patients include forming-binding protein 1, C-reactive protein, leukocyte-associated immunoglobulin receptor 1, renin receptor, mediator of RNA polymerase II transcription subunit 14, multimerin-2, alpha-N-acetylglucosaminidase, caldesmon, and cadherin EGF LAG G-type receptor. Our results suggest that not only a few but possibly a combination of biomarkers that are highly correlated can predict neurocognitive status in HIV-infected patients and might be involved in monocyte or macrophage activation.
Keywords: Mass spectrometry, i-TRAQ, HIV, Biomarker, Proteomics
Introduction
As of 2012, the Word Health Organization estimates that approximately 35 million people are living with human immunodeficiency virus (HIV). Out of these, 30–60 % are expected to develop some form of HIV-associated neurocognitive disorder (HAND) despite treatment with antiretroviral therapy (cART) (Schouten et al. 2011). Novel biomarkers detectable in human biological fluids, such as blood, plasma, saliva, or cerebral spinal fluid (CSF), are needed to support earlier clinical diagnosis of HAND (reviewed in (Price et al. 2013)). To this end, we performed a protein biomarker discovery study in CSF from HIV-infected patients that developed HAND using isobaric tags for relative and absolute quantitation (iTRAQ). iTRAQ allows for multiplex mass spectrometry (MS)-based approaches to be used to analyze multiple samples in a single experiment. Differences in protein expression among samples are determined by comparing the intensities of the different iTRAQ reporter ions in the MS/MS peptide fragmentation spectra (Zieske 2006). iTRAQ has been recently used to study topics ranging from cellular responses to HIV infection to the composition of HIV-1 virions (Huang et al. 2010; Linde et al. 2013; Navare et al. 2012; Pendyala et al. 2010; Shetty et al. 2011). For HAND research, iTRAQ was recently used to study changes in oxidative stress proteins in the brains of HIV-infected individuals (Uzasci et al. 2013).
Using an iTRAQ-based proteomics approach, we measured proteins in the CSF of HIV-infected patients, which had developed HAND while under cART therapy. We used an 8-plex iTRAQ reporter system to compare three groups: HIV+ with HAND, HIV+ without HAND, and HIV− controls. We identified 673 proteins (with a 5 % false discovery rate and a p value ≤0.05). Out of the 673 identified proteins, 193 proteins had sufficient iTRAQ reporter intensity quality to allow for quantitation. Of these 193 proteins, 16 proteins were significantly upregulated greater than 1.5-fold or less than 0.6-fold. Of the 16 proteins differentially regulated, seven are reported to be associated with HIV infection. Using hierarchical clustering analysis, we characterized the overall patterns of protein expression in the CSF of the three patient groups. Our analysis indicated that multiple pathways might be dysregulated in the CSF of HIV-infected patients with HAND.
Methods
Patient samples
HIV+ patients were recruited from the Northeast AIDS Dementia (NEAD) cohort and Oxidative Stress (OS) cohort (McArthur et al. 2004; Mohamed et al. 2010). In these cohorts, 68 % of patients were on HAART therapy, with the majority of patients treated with a neucloside analogue reverse transcriptase inhibitor (NRTI, stavudine (37.2 %); zidovudine (35.6 %) or lamivudine (56.8 %)) and a protease inhibitor. HIV+ individuals were grouped into two categories: HIV+ with HAND and HIV+ without HAND based on neurocognitive scoring (Frascati criteria (Antinori et al. 2007)). A general summary of patients is provided in Table 1 and a detailed description of the cohort is provided in supplemental data 1, Table 1, and Table 2. Briefly, 5 mL of CSF was collected from lumbar position L3–L4 using a standard protocol of cutaneous and subcutaneous pretreatment with lidocaine cream followed by insertion of 22-gauge Sprotte needle. After collection, the fluid was spun down to remove excess cells, aliquoted, and stored at −80 °C. Samples were divided into groups of 10 patients and 50 μL were pooled from each patient to give a single analytical sample of 500 μL for each group. Human studies were approved and conducted according to the procedures approved by their respective institutional review boards.
Table 1.
Demographic characteristics and viral load across HAND and non-HAND patients
| HAND | non-HAND | Control | |
|---|---|---|---|
| N | 10 | 10 | 10 |
| Age | 47.8 | 47.3 | 43.42 |
| Education | 12 | 12.1 | 16 |
| Race | |||
| African American | 10 | 9 | 3 |
| White | 0 | 1 | 7 |
| Gender | |||
| Male | 8 | 4 | 8 |
| Female | 2 | 6 | 2 |
| CSF Viral Load avg. | <50–336 | <50–77 | NA |
| Plasma Viral Load avg. | <50–169 (one case 65,836) | <50 (one case 100) | NA |
| CD4 avg. | 378.1 | 476.9 | NA |
| CD4 Range | [2–977] | [20–944] | NA |
| CD 4 Nadir avg. | 65.5 | 112.3 | NA |
| CD4 Nadir Range | [<50–299] | [<50–399] | NA |
NA not available
Table 2.
Differentially expressed proteins and possible HAND protein biomarkers
| Identified proteins (405/466) | Accession number | p value | HAND/control | HAND/non-HAND | Regulation | HIV- interacting |
|---|---|---|---|---|---|---|
| Formin-binding protein 1-like isoform 2 | gi∣41581463 | 0.02 | 2.2 | 2.20 | Up | |
| C-reactive protein | gi∣55770842 | 0.019 | 5.5 | 1.77 | Up | |
| Endoplasmin | gi∣4507677 | 0.0001 | 6.45 | 1.74 | Up | Rev |
| Leukocyte-associated immunoglobulin-like receptor 1 isoform b |
gi∣11231177 | 0.00011 | 1.55 | 1.55 | Up | |
| BH3-interacting domain death agonist isoform 1 |
gi∣37574726 | 0.0001 | 2.3 | 1.53 | Up | Env, Vpr, Gag-Pol |
| Renin receptor | gi∣15011918 | 0.0001 | 2.05 | 1.46 | Up | |
| Mediator of RNA polymerase II transcription subunit 14 |
gi∣28558973 | 0.00016 | 1.7 | 1.42 | Up | |
| Orosomucoid | gi∣167857790 | 0.0001 | 1.55 | 1.45 | Up | Env |
| Apolipoprotein E | gi∣4557325 | 0.0001 | 1.6 | 1.45 | Up | Env, Tat |
| Metalloproteinase inhibitor 2 | gi∣4507511 | 0.0006 | 1.85 | 1.45 | Up | Tat |
| Multimerin-2 | gi∣221316695 | 0.016 | 1.85 | 1.45 | Up | |
| Alpha-N-acetylglucosaminidase | gi∣66346698 | 0.00017 | 0.65 | 1.45 | Up | |
| Caldesmon | gi∣44680105 | 0.003 | 0.65 | 1.45 | Up | |
| Cadherin EGF LAG seven-pass G-type receptor 2 |
gi∣13325064 | 0.0014 | 0.35 | 0.61 | Down | |
| Peroxiredoxin-2 isoform a | gi∣32189392 | 0.0001 | 0.35 | 0.58 | Down | Gag-Pol |
| ruvB-like 2 | gi∣5730023 | 0.0002 | 1.55 | 0.49 | Down | Tat |
Sample preparation
Nine molar urea in triethylammonium bicarbonate (TEABC) were added to the CSF samples; then, they were incubated at 25 °C for 1 h. The samples were filtered using 10 kDa cutoff Amicon Ultra 0.5-mL tubes by centrifugation at 5,000g for 15 min. The same buffer was used for washing the samples three times. For protein recovery, the filter was spun in reverse for 2 min at 1,000g followed by a rinse with 100 μL of 50 mM TEABC buffer. Protein amounts were measured using a bicinchoninic acid (BCA) protein assay (Thermo Scientific), and 100 μg were prepared for iTRAQ labeling. Samples were resuspended in 2 M urea with 20 mM TEABC, incubated in 5 mM dithiothreitol (DTT) at 56°C for 30 min for reduction and 15 mM iodoacetamide (IAA) at room temperature for alkylation, followed by overnight trypsin treatment, with a trypsin-to-protein ratio of 1:20. To increase labeling affinity, the samples were acidified with 10 μL of 20 % trifluoroacetic acid (TFA) (Thermo Scientific) followed by cleanup with C18 SepPak cartridges (Waters). The samples were then dried and stored at −80 °C before iTRAQ labeling. Six out of the possible eight iTRAQ reagents (113,114,115,116,117, and 118) were used from an 8-plex iTRAQ kit (ABSciex). Reporters 113 and 117 were used to label control samples, 114 and 118 were used to label samples from HIV+ patients without HAND, and 115 and 116 were used to label samples from HIV+ patients with HAND.
Liquid chromatography and mass spectrometry
A two-dimensional offline HPLC strategy was used to increase the coverage of peptides by MS. Strong cation exchange (SCX) chromatography was used in the first dimension and basic reverse phase (bRP) in the second dimension. For SCX, peptides were reconstituted with buffer A (5 mM KH2PO4 buffer, pH 2.85, in 25 % acetonitrile (ACN)) and separated using an Agilent 1100 HPLC system as previously described (Alpert and Andrews 1988). Briefly, peptides were fractionated using a polysulfoethyl A column (300 Å, 5 μm, 100×2.1 mm, PolyLC, Columbia, MD) using a 45-min linear gradient using buffer B (buffer A with 350 mM KCl). After SCX chromatography, fractions were dried and re-suspended in 10 μL of 10 mM TEABC (Sigma) in water (buffer A) for bRP chromatography as previously described (Wang et al. 2011). Briefly, a 96-min step gradient with buffer B (10 mM TEABC in 90 % ACN) using a 2.1×100 mm XBridge column with a 5-μm, 2.1×10 mm guard column at a 0.25-mL/min flow rate was performed (0–20 min at 0 % B; 20–25 min at 8 % B; 25–50 min at 32 % B; 50–60 min at 50 % B; and 60–96 min at 100 % B). Peaks were monitored at 278 nm. A total of 27 peptide fractions were collected based upon the elution chromatographs. Fractions were dried and re-suspended in 7 μL 0.1 % formic acid (FA) for online liquid chromatography (LC)-MS/MS analysis. LC-MS/MS analysis was carried out using LTQ-Orbitrap Velos mass spectrometer (Thermo Electron, Bremen, Germany). Peptide samples reconstituted in 0.1 % FA were loaded on a trap column (75 μm×10 mm) and washed for 5 min with 3 % solvent B (90 % ACN in 0.1 % FA). A third dimension fractionation was performed online during the LC-MS/MS analysis using a reversed phase analytical C18 column connected to 1,200 Series Nanoflow LC (Agilent Technologies). The nanospray source was fitted with an 8-μm emitter tip (New Objective, Woburn, MA, USA) to which a voltage of 2 kV was applied. The peptide separation was carried out using linear gradient of 10–30 % solvent B for 70 min at a constant flow rate of 0.4 μL/min. Data were acquired using Xcalibur 2.1 (Thermo Electron). In the scan range of m/z 350–1,800, the 10 most abundant ions were selected for fragmentation. The selected ions were excluded for 30 s after two MS/MS scans. Target ion quantity for FT full MS was 5×10⁵ and for MS2 was 2×10⁵. Precursor fragmentation was carried out in an HCD cell. MS data were acquired with Orbitrap analyzer at a resolution of 30,000 and MS/MS with a resolution of 15,000 (both at 400 m/z). Polydimethylcyclosiloxane (m/z, 445.1200025) ions were used as an internal reference mass.
Qualitative data analysis
All MS raw files were analyzed with Proteome Discoverer 1.4 (PD) and searched using Mascot 2.2 against the RefSeq2012 database limiting the taxonomy to Homo sapiens and using trypsin allowing for one missed cleavage as the enzymatic treatment. With a precursor mass tolerance of 15 ppm, fragment mass tolerance was 0.03 Da, and peak integration tolerance of 20 ppm. Dynamic modifications included methionine oxidation, deamidation, and cysteine methylthioalkylation. Static modifications were adjusted for iTRAQ 8-plex lysine and N-terminus labeled with reporter ions. Identified proteins were grouped by PD by common peptides. In order to increase sequence coverage and identification confidence, we built an in-house-created subset database (Tharakan et al. 2010) from all ungrouped identified proteins from the initial search with PD (4,382 spectra). Using this subset database, we re-searched all raw files as described above. Finally, to increase confidence in MS assignment, an additional X!Tandem search was performed in Scaffold Q+4.0.
Quantitative data analysis
Scaffold Q+4.0 (Proteome Software Inc., Portland, OR) was used for statistical analysis of proteins based on iTRAQ-labeled peptides. Peptide probabilities from X!Tandem search were assigned by the Peptide Prophet algorithm (Keller et al. 2002) with Scaffold delta-mass correction. Peptide probabilities from Mascot were assigned by the Scaffold Local FDR algorithm. Protein identifications were accepted if they could be established at greater than 95.0 % probability by the FDR algorithm and contained at least two identified peptides. Protein probabilities were assigned by the Protein Prophet algorithm (Nesvizhskii et al. 2003). Proteins that contained similar peptides and could not be differentiated based on MS/MS analysis alone were grouped into clusters. Channels were corrected in all samples according to the algorithm described in the i-Tracker software (Shadforth et al. 2005). Acquired intensities were globally normalized across all acquisition runs, and individual quantitative samples were normalized within each acquisition run. Intensities for each identified peptide were normalized within the assigned protein. The reference channels were normalized to produce a 1:1 fold change. If a sample duplicate did not result in a normalized distribution of reporter ions, it was excluded from the analysis. All normalization calculations were performed using medians to multiplicatively normalize data. Differentially expressed proteins (p values) were determined using Kruskal-Wallis and permutation test analysis with and without Bonferroni correction (supplemental data 2).
Results and discussion
Protein identification
An iTRAQ-based discovery study was performed to quantitatively assess the abundance of proteins in pooled CSF samples from three groups of patients: HIV+ with HAND, HIV+ without HAND, and HIV− control (Table 1). Samples were prepared as described above and a schema is shown in Fig. 1. To maximize protein coverage and increase the number of identified peptides, extensive fractionation was performed (see “Methods”), and a bioinformatics strategy wherein an in-house subset database was generated from ungrouped proteins and searched to increase the coverage of proteins as previously described (Tharakan et al. 2010). Using this method, we were able to increase identified grouped proteins from 566 to 673 proteins, with 121 proteins unique to the subset database search and 14 unique to the initial search (Fig. 2). These 673 proteins were used for all further analysis and provided in the supplemental information (CSF_HAND_iTRAQ_Subsetdatabase.xlsx).
Fig. 1.

Schematic representation of sample preparation for CSF analysis using iTRAQ labeling followed by mass spectrometry analysis
Fig. 2.
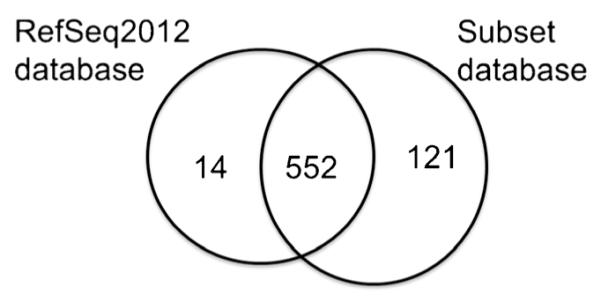
Protein identification overlaps between the RefSeq2012 and Subset database
Quality of data and validation of iTRAQ reporters
iTRAQ studies have several limitations ranging from biases towards proteins with higher abundance (Mahoney et al. 2011) to problems with dynamic range (Gan et al. 2007; Ow et al. 2009) and errors in precursor ion isolation (Wu et al. 2006). Given the variability reported in previous studies, we elected to perform our experiments in duplicate in case of a technical failure in labeling. To this end, the raw intensities of the technical replicates were compared for each reaction. We determined that channels 1 and 2, corresponding to 113 (control) and 114 (HIV+HAND), were not efficiently labeled (supplemental data 2 Fig. 1a) and therefore excluded from analysis (supplemental data 2 Fig. 1b). After this correction, we used an intensity-based normalization strategy that weighted the median for the reporter ion intensity values for all spectra (Gan et al. 2007; Lin et al. 2006) (supplemental data 2 Fig. 2b). Labeling deficits have been reported in other iTRAQ studies (Pichler et al. 2010; Pottiez et al. 2012), and the normalization approaches used in this study are well established (Bantscheff et al. 2008; Boehm et al. 2007; Choe et al. 2005; Herbrich et al. 2013; Hu et al. 2006; Karp et al. 2010; Keshamouni et al. 2006; Lin et al. 2006).
Statistical significance
After qualitative evaluation of data (supplemental data 2), proteins were searched with Scaffold Q+4.0 using X!Tandem as described above and shown in Fig. 3. The HIV− control group was considered as reference (reporter ion 117) and it was used as denominator for the HIV+ with HAND and HIV+ without HAND groups. In the case of HIV+ with HAND, we averaged the intensities corresponding to technical replicates for reporter ions 115 and 116, and then we divided the average by the reference. A schema of the data analysis workflow is shown in Fig. 3. Summaries of the statistical tests used are shown in supplemental data 3 along with the number of proteins that passed our criteria for every test. For the remaining proteins, we statistically evaluated the fold change of iTRAQ reporter ions using Kruskal-Wallis and permutation testing with and without Bonferroni correction. Both statistical approaches gave similar results (supplemental data 3). The same proteins passed both tests with 95 % CI with p value ≤0.05 without Bonferroni correction. Of the 193 proteins identified with the subset database search, we selected proteins with a fold change ≥1.5 or ≤0.5 in HIV+ with HAND/control. To determine putative biomarkers for the diagnosis of HAND, we were most interested in the proteins that were up or downregulated in HIV-infected patients under cART with HAND versus those without HAND. Sixteen proteins were found to be upregulated ≥1.5-fold or downregulated ≤0.5 and are summarized in Table 2. Only seven proteins were found to significantly differentiate HIV+ HAND/HIV+ without HAND (Table 2).
Fig. 3.

Bioinformatics scheme for qualitative and quantitative analysis of iTRAQ data
Biological significance and study limitations
In this study, we identified regulated proteins in CSF samples collected from healthy subjects, HIV+ patients with HAND and HIV+ patients without HAND. Among the HAND patient group, the neurological impairment varied between asymptomatic, mild, and severe, and the diagnostic of a patient can change over time from asymptomatic to mild to back to normal (Heaton 2012a, 2012b). Given the three-dimensional fractionation approach used in this study and limited sample volume, sample pooling was the only practical option for this study. Pooling samples is an area of considerable debate for proteomics discovery research. The advantage of sample pooling is that it provides much more rapid results, reduces sample requirements, and has lowers costs. The limitation of this method is that potential biomarkers only present in one or two samples are diluted. Since instrumentation measurements are biased towards higher abundance proteins, some putative biomarkers might be diluted to below the limits of detection. To address this limitation, extensive fractionation was performed with the goal of separating low-abundance peptides from high-abundance peptides. As with all discovery proteomics experiments, extensive validation must be performed on a larger validation cohort before one can confirm that a biomarker, preferably including longitudinal study design. Therefore, we consider the proteins in Table 2 to be putative biomarker candidates that need further and consistent validation in a larger sample cohort.
Formin-binding protein 1-like isoform 2 binds lipids and is involved in actin polymerization and internalization. It has been proposed to have a role in HIV cell-cell transfer (Aggarwal et al. 2012). Renin receptor levels were also increased in the CSF of HAND individuals. While renin has been connected to HIV nephropathy and the renin-angiotensin system is impacted by cART (Tzoupis et al. 2012), no connections yet have been made to HIV neurological disease. Genetic defects in renin receptor are linked to profound mental retardation. Soluble renin receptor is generated by furin proteases, the same proteases suggested to process gp120 (Cousin et al. 2009). Changes were also observed in multimerin, one of the largest proteins found in the human body (occurring as massive disulfide-linked multimers that are millions of daltons in size). Multimerin is speculated to be an extracellular or adhesive protein, and it is found in endothelial cells and megakaryocytes as well as platelets (Hayward 1997; Jeimy et al. 2008). CRP has been previously monitored in plasma as a marker for mild cognitive impairment (Karim et al. 2013) and associated with schizophrenia and antipsychotic treatment (Lin et al. 2013). Cadherin EFG LAG has unknown implications in neurological disorders but it has multiple functions in the central nervous system and epithelia (Boutin et al. 2012). Caldesmon has important role in contractility of microvessels following traumatic brain injury (Kreipke et al. 2006). Several putative interactions exist between proteins changed in the context of neurological disease (supplemental data 4).
Several of the proteins observed have been shown to interact with HIV proteins in different biological systems. For example, orosomucoid inhibits the infection of human monocyte-derived macrophages by R5 HIV-1 (Atemezem et al. 2001; Rabehi et al. 1995). Gautier et al. have shown that ruvB-like2 is one of the 183 Jurkat T cell nuclear extract proteins that interact with Tat (Gautier et al. 2009). In a similar study, Impens et al. incubated HIV-1 protease with Jurkat T cell lysates and analyzed the resulting peptides with MS (Impens et al. 2012). Peroxiredoxin-2 isoform was one of 53 human proteins that was shown to be a substrate of HIV-1 protease. Using a checkerboard analysis, Lafrenie et al. showed that HIV-1 Tat-induced monocyte invasion is inhibited by anti-beta integrin Ab or tissue inhibitor of metalloproteinase (TIMP), indicating an interaction with beta integrins and TIMP (Lafrenie et al. 1996a, 1996b; Toschi et al. 2001). It is known that apolipoprotein E (ApoE) has neurological implications in Alzheimer’s disease as well as in HIV-infected patients (Chico et al. 2013; Sadigh-Eteghad et al. 2012; Verghese et al. 2013). In the context of HIV, Turchan-Cholewo et al. have found that HIV-infected individuals with the E4 allele of ApoE or a history of intravenous drug abuse had increased oxidative stress in the CNS (Turchan-Cholewo et al. 2006) while the antioxidant properties of human lipidated apoE3 protects neurons from Tat-induced toxicity (Liu et al. 2000; Park et al. 2007; Pocernich et al. 2004; Turchan-Cholewo et al. 2006). BH3-interacting domain death (BID) agonist isoform 1 has been shown to be involved in the caspase activated pathway in cultured cortical neurons when exposed to HIV gp120 (Tun et al. 2007). Similar studies have delineated a novel pathway of Vpr-induced apoptosis in renal tubular epithelial cells, which is mediated by sustained ERK activation, resulting in caspase 8-mediated cleavage of BID, thereby facilitating Bax-mediated mitochondrial injury and apoptosis (Snyder et al. 2010). In relation to the apoptosis pathway, a different research group showed that HIV-1 protease directly cleaves and activates procaspase 8 in T cells which is associated with cleavage of BID, mitochondrial release of cytochrome c, and activation of the downstream caspases 9 and 3 (Nie et al. 2002).
Hierarchical clustering
One hundred ninety-three proteins were identified with the specific GI (gene index) name from ncbi gene database (http://www.ncbi.nlm.nih.gov/) and classified using hierarchical clustering to observe the overall expression patterns (Fig. 4). Overall, proteins show correlation within the three groups of control, HIV+ with HAND and HIV+ without HAND. As shown in Fig. 4, the hierarchical clustering analysis produced clear patterns. For example, downregulated proteins in the control group (upper green left cluster) correlated with proteins that were upregulated in the HIV+ with HAND group (upper red right cluster) and with proteins that remained unchanged in the HIV+ without HAND group (upper red-dark middle cluster). This suggests that a combination of biomarkers that are highly correlated can predict neurocognitive status in HIV-infected patients and are involved in a set of pathways altered by HIV infection (supplemental data 4). Correlation of possible biomarkers that predict neurodegeneration in HIV-infected individuals has been observed in CNS HIV Anti-Retroviral Therapy Effects Research (CHARTER) study where researchers tested a panel of biomarkers to predict cognitive impairment (Letendre 2012). A combination of sCD14, CCL2, CXCL10, sTNFR, and TNF-alpha predicted neurocognitive status in 92 % of patients for patients with normal performance at the first time point. A combination of sCD14, IL-6, CXCL12, CCL2, and sTNFR correctly classified the cognitive status of 94 % at the second time point. For subjects with impaired performance at the first time point, CCL2, TNF-alpha, sCD14, and CX3CL1 classified 96 % correctly. The two most frequently identified biomarkers were sCD14 and CCL2. These are indicators of monocyte or macrophage activation. All cases of neurocognitive stability were correctly classified. It remains to be determined if the addition of these putative biomarkers might improve the specificity of these panels.
Fig. 4.
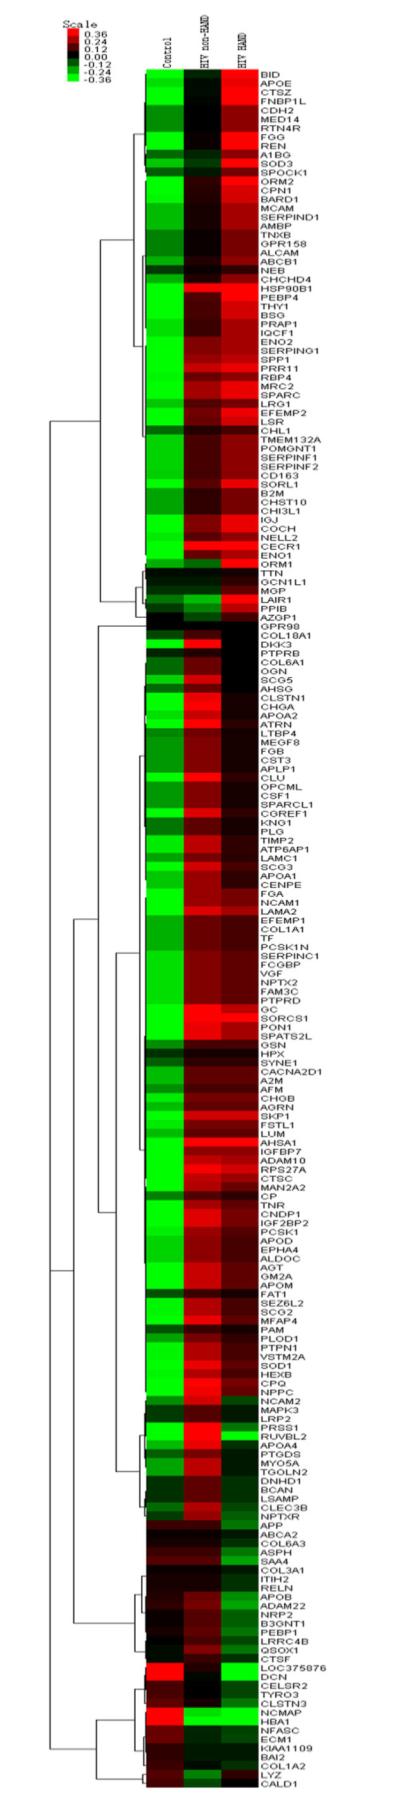
Hierarchical clustering analysis of 193 proteins (p value ≤0.05) (on the right, each protein was associate with ncbi database gene name). Overall proteins show differential regulation within the three groups of control, HAND and non-HAND. Green represents low expression level and red represents high expression level. In the upper left in green, downregulated protein in the control group clustered with proteins that are upregulated in HAND (upper red right) and non-regulated in non-HAND group (upper red-dark middle)
In summary, the current study provides evidence for putative HAND biomarkers using MS. While the study design is limited to pooled samples, we maximized our protein identification and coverage using extensive separation techniques (three-dimensional peptide separation) and bioinformatics strategies. We have further increased the integrity of the data by the elimination of any artifacts due to sample preparation, by only considering high confidence identifications (p value ≤0.05) for statistical analysis. Using this approach, we identified several proteins that can be considered biomarker candidates for neurological impairment in HIV infection. Further, by analyzing the pattern of expression of all proteins with hierarchical clustering, we show the clustering of several markers that, while not significantly changed, showed groupings of several additional markers that were differentially regulated between HIV+ patients with or without HAND. While further validation is needed, this proteomics study shows the potential of biomarker discovery in neurological disorders.
Supplementary Material
Acknowledgments
The authors would like to acknowledge the following funding sources for this work: Center for Novel Therapeutics for HIV-Associated Cognitive Disorders, NIMH Center grant 2P30MH075673, and NHLBI Contract No. HHSN268201000032C. CSF was collected from patients that provided informed consent and under protocols approved by the appropriate institutional review boards. We would like to acknowledge that mass spectrometry for these studies were performed in the Johns Hopkins University School of Medicine Mass Spectrometry and Proteomics Core facility (Dr. Robert Cole, Director).
Dedication The authors would like to dedicate this manuscript to the late Dr. Robert Cotter, who passed away during the preparation of this manuscript. His friendship, guidance, and support will be greatly missed.
Footnotes
Conflict of interest The authors declare they have no financial relationship with the organization that sponsors this research; therefore, they have no conflict of interest.
Electronic supplementary material The online version of this article (doi:10.1007/s13365-014-0263-5) contains supplementary material, which is available to authorized users.
Contributor Information
Adriana Bora, Department of Molecular and Comparative Pathobiology-Retrovirus Laboratory, Baltimore, USA; Department of Neurology, University of Hawaii, Honolulu, USA.
Ceereena Ubaida Mohien, Department of Molecular and Comparative Pathobiology-Retrovirus Laboratory, Baltimore, USA.
Raghothama Chaerkady, Johns Hopkins School of Medicine, Johns Hopkins University School of Medicine Mass Spectrometry and Proteomics Core, Baltimore, USA.
Linda Chang, Department of Medicine, John A. Burns School of Medicine, University of Hawaii, Honolulu, USA.
Richard Moxley, 4th, Department of Neurology, University of Hawaii, Honolulu, USA.
Ned Sacktor, Department of Neurology, University of Hawaii, Honolulu, USA.
Norman Haughey, Department of Neurology, University of Hawaii, Honolulu, USA.
Justin C. McArthur, Department of Neurology, University of Hawaii, Honolulu, USA
Robert Cotter, Department of Pharmacology and Molecular Sciences, Johns Hopkins School of Medicine, Baltimore, USA.
Avindra Nath, National Institute of Neurological Disorders and Stroke, National Institutes of Health, Bethesda, MD, USA.
David R. Graham, Department of Molecular and Comparative Pathobiology-Retrovirus Laboratory, Baltimore, USA
References
- Aggarwal A, Iemma TL, Shih I, Newsome TP, McAllery S, et al. Mobilization of HIV spread by diaphanous 2 dependent filopodia in infected dendritic cells. PLoS Pathog. 2012;8:e1002762. doi: 10.1371/journal.ppat.1002762. [DOI] [PMC free article] [PubMed] [Google Scholar]
- Alpert AJ, Andrews PC. Cation-exchange chromatography of peptides on poly(2-sulfoethyl aspartamide)-silica. J Chromatogr. 1988;443:85–96. doi: 10.1016/s0021-9673(00)94785-x. [DOI] [PubMed] [Google Scholar]
- Antinori A, Arendt G, Becker JT, Brew BJ, Byrd DA, et al. Updated research nosology for HIV-associated neurocognitive disorders. Neurology. 2007;69:1789–1799. doi: 10.1212/01.WNL.0000287431.88658.8b. [DOI] [PMC free article] [PubMed] [Google Scholar]
- Atemezem A, Mbemba E, Vassy R, Slimani H, Saffar L, Gattegno L. Human alpha1-acid glycoprotein binds to CCR5 expressed on the plasma membrane of human primary macrophages. Biochem J. 2001;356:121–128. doi: 10.1042/0264-6021:3560121. [DOI] [PMC free article] [PubMed] [Google Scholar]
- Bantscheff M, Boesche M, Eberhard D, Matthieson T, Sweetman G, Kuster B. Robust and sensitive iTRAQ quantification on an LTQ Orbitrap mass spectrometer. Mol Cell Proteomics. 2008;7:1702–1713. doi: 10.1074/mcp.M800029-MCP200. [DOI] [PMC free article] [PubMed] [Google Scholar]
- Boehm AM, Putz S, Altenhofer D, Sickmann A, Falk M. Precise protein quantification based on peptide quantification using iTRAQ. BMC Bioinformatics. 2007;8:214. doi: 10.1186/1471-2105-8-214. [DOI] [PMC free article] [PubMed] [Google Scholar]
- Boutin C, Goffinet AM, Tissir F. Celsr1-3 cadherins in PCP and brain development. Curr Top Dev Biol. 2012;101:161–183. doi: 10.1016/B978-0-12-394592-1.00010-7. [DOI] [PubMed] [Google Scholar]
- Chico L, Simoncini C, Lo Gerfo A, Rocchi A, Petrozzi L, et al. Oxidative stress and APO E polymorphisms in Alzheimer’s disease and in mild cognitive impairment. Free Radic Res. 2013;47:569–576. doi: 10.3109/10715762.2013.804622. [DOI] [PubMed] [Google Scholar]
- Choe LH, Aggarwal K, Franck Z, Lee KH. A comparison of the consistency of proteome quantitation using two-dimensional electrophoresis and shotgun isobaric tagging in Escherichia coli cells. Electrophoresis. 2005;26:2437–2449. doi: 10.1002/elps.200410336. [DOI] [PubMed] [Google Scholar]
- Cousin C, Bracquart D, Contrepas A, Corvol P, Muller L, Nguyen G. Soluble form of the (pro)renin receptor generated by intra-cellular cleavage by furin is secreted in plasma. Hypertension. 2009;53:1077–1082. doi: 10.1161/HYPERTENSIONAHA.108.127258. [DOI] [PubMed] [Google Scholar]
- Gan CS, Chong PK, Pham TK, Wright PC. Technical, experimental, and biological variations in isobaric tags for relative and absolute quantitation (iTRAQ) J Proteome Res. 2007;6:821–827. doi: 10.1021/pr060474i. [DOI] [PubMed] [Google Scholar]
- Gautier VW, Gu L, O’Donoghue N, Pennington S, Sheehy N, Hall WW. In vitro nuclear interactome of the HIV-1 Tat protein. Retrovirology. 2009;6:47. doi: 10.1186/1742-4690-6-47. [DOI] [PMC free article] [PubMed] [Google Scholar]
- Hayward CP. Multimerin: a bench-to-bedside chronology of a unique platelet and endothelial cell protein–from discovery to function to abnormalities in disease. Clin Invest Med. 1997;20:176–187. [PubMed] [Google Scholar]
- Heaton R. Asymptomatic mild HIV-associated neurocognitive disorder increases risk for future symptomatic decline: a CHARTER longitudinal study. 19th CROI; Seattle. 2012; 2012a. Oral abstract 81. [Google Scholar]
- Heaton R. Prevalence and predictors of neurocognitive decline over 18 to 42 Months: a CHARTER longitudinal study. 19th CROI; Seattle. 2012b. Poster abstract 474. [Google Scholar]
- Herbrich SM, Cole RN, West KP, Jr, Schulze K, Yager JD, et al. Statistical inference from multiple iTRAQ experiments without using common reference standards. J Proteome Res. 2013;12:594–604. doi: 10.1021/pr300624g. [DOI] [PMC free article] [PubMed] [Google Scholar]
- Hu J, Qian J, Borisov O, Pan S, Li Y, et al. Optimized proteomic analysis of a mouse model of cerebellar dysfunction using amine-specific isobaric tags. Proteomics. 2006;6:4321–4334. doi: 10.1002/pmic.200600026. [DOI] [PMC free article] [PubMed] [Google Scholar]
- Huang X, Stone DK, Yu F, Zeng Y, Gendelman HE. Functional proteomic analysis for regulatory T cell surveillance of the HIV-1-infected macrophage. J Proteome Res. 2010;9:6759–6773. doi: 10.1021/pr1009178. [DOI] [PMC free article] [PubMed] [Google Scholar]
- Impens F, Timmerman E, Staes A, Moens K, Arien KK, et al. A catalogue of putative HIV-1 protease host cell substrates. Biol Chem. 2012;393:915–931. doi: 10.1515/hsz-2012-0168. [DOI] [PubMed] [Google Scholar]
- Jeimy SB, Tasneem S, Cramer EM, Hayward CP. Multimerin 1. Platelets. 2008;19:83–95. doi: 10.1080/09537100701832157. [DOI] [PubMed] [Google Scholar]
- Karim S, Hopkins S, Purandare N, Crowther J, Morris J, et al. Peripheral inflammatory markers in amnestic mild cognitive impairment. Int J Geriatr Psychiatry. 2013 doi: 10.1002/gps.3988. [DOI] [PMC free article] [PubMed] [Google Scholar]
- Karp NA, Huber W, Sadowski PG, Charles PD, Hester SV, Lilley KS. Addressing accuracy and precision issues in iTRAQ quantitation. Mol Cell Proteomics. 2010;9:1885–1897. doi: 10.1074/mcp.M900628-MCP200. [DOI] [PMC free article] [PubMed] [Google Scholar]
- Keller A, Nesvizhskii AI, Kolker E, Aebersold R. Empirical statistical model to estimate the accuracy of peptide identifications made by MS/MS and database search. Anal Chem. 2002;74:5383–5392. doi: 10.1021/ac025747h. [DOI] [PubMed] [Google Scholar]
- Keshamouni VG, Michailidis G, Grasso CS, Anthwal S, Strahler JR, et al. Differential protein expression profiling by iTRAQ-2DLC-MS/MS of lung cancer cells undergoing epithelial-mesenchymal transition reveals a migratory/invasive phenotype. J Proteome Res. 2006;5:1143–1154. doi: 10.1021/pr050455t. [DOI] [PubMed] [Google Scholar]
- Kreipke CW, Morgan NC, Petrov T, Rafols JA. Calponin and caldesmon cellular domains in reacting microvessels following traumatic brain injury. Microvasc Res. 2006;71:197–204. doi: 10.1016/j.mvr.2006.02.002. [DOI] [PubMed] [Google Scholar]
- Lafrenie RM, Wahl LM, Epstein JS, Hewlett IK, Yamada KM, Dhawan S. HIV-1-Tat modulates the function of monocytes and alters their interactions with microvessel endothelial cells. A mechanism of HIV pathogenesis. J Immunol. 1996a;156:1638–1645. [PubMed] [Google Scholar]
- Lafrenie RM, Wahl LM, Epstein JS, Hewlett IK, Yamada KM, Dhawan S. HIV-1-Tat protein promotes chemotaxis and invasive behavior by monocytes. J Immunol. 1996b;157:974–977. [PubMed] [Google Scholar]
- Letendre S. A concise panel of biomarkers diagnoses and predicts neurocognitive status in HIV-infected individuals. 19th CROI; Seattle. 2012; 2012. Oral abstract 82. [Google Scholar]
- Lin WT, Hung WN, Yian YH, Wu KP, Han CL, et al. Multi-Q: a fully automated tool for multiplexed protein quantitation. J Proteome Res. 2006;5:2328–2338. doi: 10.1021/pr060132c. [DOI] [PubMed] [Google Scholar]
- Lin CC, Chang CM, Liu CY, Huang TL. Increased high-sensitivity C-reactive protein levels in Taiwanese schizophrenic patients. Asia Pac Psychiatry. 2013;5:E58–E63. doi: 10.1111/appy.12078. [DOI] [PubMed] [Google Scholar]
- Linde ME, Colquhoun DR, Ubaida Mohien C, Kole T, Aquino V, et al. The conserved set of host proteins incorporated into HIV-1 virions suggests a common egress pathway in multiple cell types. J Proteome Res. 2013 doi: 10.1021/pr300918r. [DOI] [PMC free article] [PubMed] [Google Scholar]
- Liu Y, Jones M, Hingtgen CM, Bu G, Laribee N, et al. Uptake of HIV-1 tat protein mediated by low-density lipoprotein receptor-related protein disrupts the neuronal metabolic balance of the receptor ligands. Nat Med. 2000;6:1380–1387. doi: 10.1038/82199. [DOI] [PubMed] [Google Scholar]
- Mahoney DW, Therneau TM, Heppelmann CJ, Higgins L, Benson LM, et al. Relative quantification: characterization of bias, variability and fold changes in mass spectrometry data from iTRAQ-labeled peptides. J Proteome Res. 2011;10:4325–4333. doi: 10.1021/pr2001308. [DOI] [PMC free article] [PubMed] [Google Scholar]
- McArthur JC, McDermott MP, McClernon D, St Hillaire C, Conant K, et al. Attenuated central nervous system infection in advanced HIV/AIDS with combination antiretroviral therapy. Arch Neurol. 2004;61:1687–1696. doi: 10.1001/archneur.61.11.1687. [DOI] [PubMed] [Google Scholar]
- Mohamed MA, Barker PB, Skolasky RL, Selnes OA, Moxley RT, et al. Brain metabolism and cognitive impairment in HIV infection: a 3-T magnetic resonance spectroscopy study. Magn Reson Imaging. 2010;28:1251–1257. doi: 10.1016/j.mri.2010.06.007. [DOI] [PMC free article] [PubMed] [Google Scholar]
- Navare AT, Sova P, Purdy DE, Weiss JM, Wolf-Yadlin A, et al. Quantitative proteomic analysis of HIV-1 infected CD4+ T cells reveals an early host response in important biological pathways: protein synthesis, cell proliferation, and T-cell activation. Virology. 2012;429:37–46. doi: 10.1016/j.virol.2012.03.026. [DOI] [PMC free article] [PubMed] [Google Scholar]
- Nesvizhskii AI, Keller A, Kolker E, Aebersold R. A statistical model for identifying proteins by tandem mass spectrometry. Anal Chem. 2003;75:4646–4658. doi: 10.1021/ac0341261. [DOI] [PubMed] [Google Scholar]
- Nie Z, Phenix BN, Lum JJ, Alam A, Lynch DH, et al. HIV-1 protease processes procaspase 8 to cause mitochondrial release of cytochrome c, caspase cleavage and nuclear fragmentation. Cell Death Differ. 2002;9:1172–1184. doi: 10.1038/sj.cdd.4401094. [DOI] [PubMed] [Google Scholar]
- Ow SY, Salim M, Noirel J, Evans C, Rehman I, Wright PC. iTRAQ underestimation in simple and complex mixtures: “the good, the bad and the ugly”. J Proteome Res. 2009;8:5347–5355. doi: 10.1021/pr900634c. [DOI] [PubMed] [Google Scholar]
- Park SE, Lee MJ, Yang MH, Ahn KY, Jang SI, et al. Expression profiles and pathway analysis in HEK 293 T cells overexpressing HIV-1 Tat and nucleocapsid using cDNA microarray. J Microbiol Biotechnol. 2007;17:154–161. [PubMed] [Google Scholar]
- Pendyala G, Trauger SA, Siuzdak G, Fox HS. Quantitative plasma proteomic profiling identifies the vitamin E binding protein afamin as a potential pathogenic factor in SIV induced CNS disease. J Proteome Res. 2010;9:352–358. doi: 10.1021/pr900685u. [DOI] [PMC free article] [PubMed] [Google Scholar]
- Pichler P, Kocher T, Holzmann J, Mazanek M, Taus T, et al. Peptide labeling with isobaric tags yields higher identification rates using iTRAQ 4-plex compared to TMT 6-plex and iTRAQ 8-plex on LTQ Orbitrap. Anal Chem. 2010;82:6549–6558. doi: 10.1021/ac100890k. [DOI] [PMC free article] [PubMed] [Google Scholar]
- Pocernich CB, Sultana R, Hone E, Turchan J, Martins RN, et al. Effects of apolipoprotein E on the human immunodeficiency virus protein Tat in neuronal cultures and synaptosomes. J Neurosci Res. 2004;77:532–539. doi: 10.1002/jnr.20182. [DOI] [PubMed] [Google Scholar]
- Pottiez G, Wiederin J, Fox HS, Ciborowski P. Comparison of 4-plex to 8-plex iTRAQ quantitative measurements of proteins in human plasma samples. J Proteome Res. 2012;11:3774–3781. doi: 10.1021/pr300414z. [DOI] [PMC free article] [PubMed] [Google Scholar]
- Price RW, Peterson J, Fuchs D, Angel TE, Zetterberg H, et al. Approach to cerebrospinal fluid (CSF) biomarker discovery and evaluation in HIV infection. Journal of neuroimmune pharmacology : the official journal of the Society on NeuroImmune Pharmacology. 2013;8:1147–1158. doi: 10.1007/s11481-013-9491-3. [DOI] [PMC free article] [PubMed] [Google Scholar]
- Rabehi L, Ferriere F, Saffar L, Gattegno L. Alpha 1-acid glycoprotein binds human immunodeficiency virus type 1 (HIV-1) envelope glycoprotein via N-linked glycans. Glycoconj J. 1995;12:7–16. doi: 10.1007/BF00731863. [DOI] [PubMed] [Google Scholar]
- Sadigh-Eteghad S, Talebi M, Farhoudi M. Association of apolipoprotein E epsilon 4 allele with sporadic late onset Alzheimer’s disease. A meta-analysis Neurosciences (Riyadh) 2012;17:321–326. [PubMed] [Google Scholar]
- Schouten J, Cinque P, Gisslen M, Reiss P, Portegies P. HIV-1 infection and cognitive impairment in the cART era: a review. Aids. 2011;25:561–575. doi: 10.1097/QAD.0b013e3283437f9a. [DOI] [PubMed] [Google Scholar]
- Shadforth IP, Dunkley TP, Lilley KS, Bessant C. i-Tracker: for quantitative proteomics using iTRAQ. BMC Genomics. 2005;6:145. doi: 10.1186/1471-2164-6-145. [DOI] [PMC free article] [PubMed] [Google Scholar]
- Shetty V, Jain P, Nickens Z, Sinnathamby G, Mehta A, Philip R. Investigation of plasma biomarkers in HIV-1/HCV mono- and coinfected individuals by multiplex iTRAQ quantitative proteomics. Omics. 2011;15:705–717. doi: 10.1089/omi.2011.0004. [DOI] [PMC free article] [PubMed] [Google Scholar]
- Snyder A, Alsauskas ZC, Leventhal JS, Rosenstiel PE, Gong P, et al. HIV-1 viral protein r induces ERK and caspase-8-dependent apoptosis in renal tubular epithelial cells. Aids. 2010;24:1107–1119. doi: 10.1097/QAD.0b013e328337b0ab. [DOI] [PMC free article] [PubMed] [Google Scholar]
- Tharakan R, Edwards N, Graham DR. Data maximization by multipass analysis of protein mass spectra. Proteomics. 2010;10:1160–1171. doi: 10.1002/pmic.200900433. [DOI] [PubMed] [Google Scholar]
- Toschi E, Barillari G, Sgadari C, Bacigalupo I, Cereseto A, et al. Activation of matrix-metalloproteinase-2 and membrane-type-1-matrix-metalloproteinase in endothelial cells and induction of vascular permeability in vivo by human immunodeficiency virus-1 Tat protein and basic fibroblast growth factor. Mol Biol Cell. 2001;12:2934–2946. doi: 10.1091/mbc.12.10.2934. [DOI] [PMC free article] [PubMed] [Google Scholar]
- Tun C, Guo W, Nguyen H, Yun B, Libby RT, et al. Activation of the extrinsic caspase pathway in cultured cortical neurons requires p53-mediated down-regulation of the X-linked inhibitor of apoptosis protein to induce apoptosis. J Neurochem. 2007;102:1206–1219. doi: 10.1111/j.1471-4159.2007.04609.x. [DOI] [PubMed] [Google Scholar]
- Turchan-Cholewo J, Liu Y, Gartner S, Reid R, Jie C, et al. Increased vulnerability of ApoE4 neurons to HIV proteins and opiates: protection by diosgenin and L-deprenyl. Neurobiol Dis. 2006;23:109–119. doi: 10.1016/j.nbd.2006.02.005. [DOI] [PubMed] [Google Scholar]
- Tzoupis H, Leonis G, Megariotis G, Supuran CT, Mavromoustakos T, Papadopoulos MG. Dual inhibitors for aspartic proteases HIV-1 PR and renin: advancements in AIDS-hypertension-diabetes linkage via molecular dynamics, inhibition assays, and binding free energy calculations. J Med Chem. 2012;55:5784–5796. doi: 10.1021/jm300180r. [DOI] [PubMed] [Google Scholar]
- Uzasci L, Nath A, Cotter R. Oxidative stress and the HIV-infected brain proteome. J Neuroimmune Pharmacol. 2013 doi: 10.1007/s11481-013-9444-x. [DOI] [PMC free article] [PubMed] [Google Scholar]
- Verghese PB, Castellano JM, Garai K, Wang Y, Jiang H, et al. ApoE influences amyloid-beta (Abeta) clearance despite minimal apoE/Abeta association in physiological conditions. Proc Natl Acad Sci U S A. 2013;110:E1807–E1816. doi: 10.1073/pnas.1220484110. [DOI] [PMC free article] [PubMed] [Google Scholar]
- Wang Y, Yang F, Gritsenko MA, Wang Y, Clauss T, et al. Reversed-phase chromatography with multiple fraction concatenation strategy for proteome profiling of human MCF10A cells. Proteomics. 2011;11:2019–2026. doi: 10.1002/pmic.201000722. [DOI] [PMC free article] [PubMed] [Google Scholar]
- Wu WW, Wang G, Baek SJ, Shen RF. Comparative study of three proteomic quantitative methods, DIGE, cICAT, and iTRAQ, using 2D gel- or LC-MALDI TOF/TOF. J Proteome Res. 2006;5:651–658. doi: 10.1021/pr050405o. [DOI] [PubMed] [Google Scholar]
- Zieske LR. A perspective on the use of iTRAQ reagent technology for protein complex and profiling studies. J Exp Bot. 2006;57:1501–1508. doi: 10.1093/jxb/erj168. [DOI] [PubMed] [Google Scholar]
Associated Data
This section collects any data citations, data availability statements, or supplementary materials included in this article.