Abstract
Active segregation of E. coli low-copy number plasmid R1 involves formation of a bipolar spindle made of left-handed double-helical actin-like ParM filaments 1-6. ParR links the filaments with centromeric parC plasmid DNA, while facilitating the addition of subunits to ParM filaments 3,7-9. Growing ParMRC spindles push sister plasmids to the cell poles 9,10. Here, using modern electron cryomicroscopy methods we have investigated the structures and arrangements of ParM filaments in vitro and in cells, revealing at near atomic resolution how subunits and filaments come together to produce the simplest known mitotic machinery. To understand the mechanism of dynamic instability we determined structures of ParM filaments in different nucleotide states. The structure of filaments bound to AMPPNP was determined at 4.3 Å resolution and refined. The ParM filament structure shows strong longitudinal interfaces and weaker lateral interactions. Also using electron cryomicroscopy, we reconstructed ParM doublets forming antiparallel spindles. Finally, with whole-cell electron cryotomography we show that doublets are abundant in bacterial cells containing low-copy number plasmids with the ParMRC locus, leading to an asynchronous model of R1 plasmid segregation.
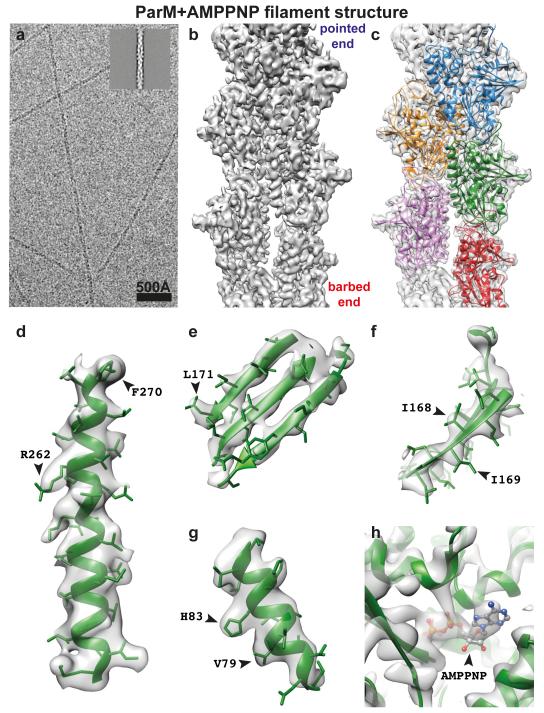
Using electron cryomicroscopic (cryo-EM) images collected on a direct-electron detector, we performed real-space helical reconstruction to elucidate a 4.3 Å structure of ParM filaments assembled with the adenosine triphosphate (ATP) analogue AMPPNP (Fig. 1a-c, ED Fig. 1, ED Table 1, Video 1). Densities corresponding to alpha helices, beta strands and many side-chains were clearly observed (Fig. 1d-g). The nucleotide AMPPNP was also observed in our map as strong density, especially on the phosphates (Fig. 1h). No significant resolution anisotropy was detected in the reconstruction (ED Fig. 1), indicating that the entire ParM protein is rigidly held in the filament. To derive an atomic model of the ParM filament, a previous, monomeric crystal structure of ParM and AMPPNP bound to the tail of ParR (PDB 4A62) was fitted into the map and the filament model iteratively rebuilt and all-atom refined using stereochemical restraints with REFMAC.
Figure 1. 4.3 Å cryo-EM reconstruction of ParM+AMPPNP filaments.
(a) Cryo-EM image of ParM+AMPPNP filaments. Inset: class average. This experiment was repeated nine times. (b) A 4.3 Å reconstruction of the filaments, isosurface contoured at 2 σ away from the mean (see ED Fig. 1 and Video 1). (c) The same reconstruction as b), overlaid with the refined atomic model with individual ParM subunits coloured differently. (d-g) Enlarged regions of the cryo-EM map showing resolved secondary structure elements and side chain densities, contoured at 1 σ. (h) Density for the nucleotide is stronger than that of the protein (contoured at 3 σ).
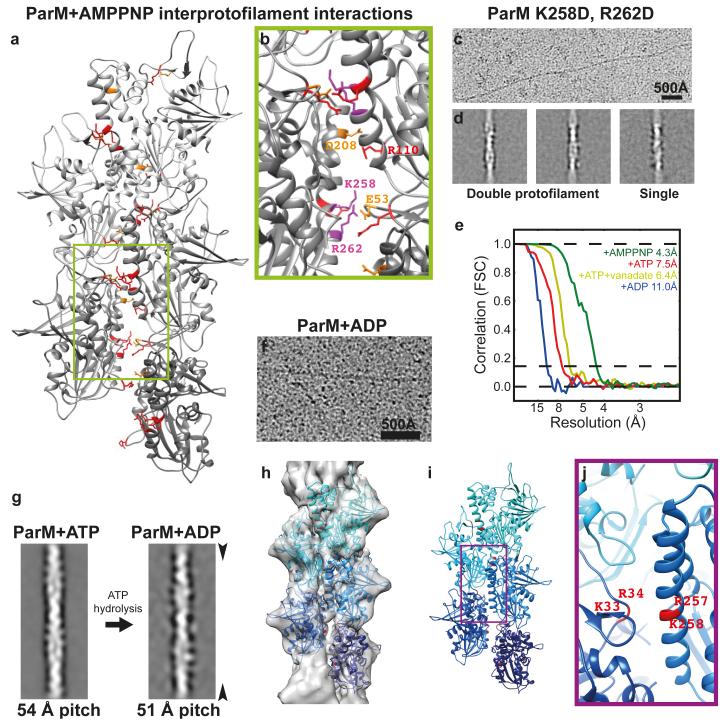
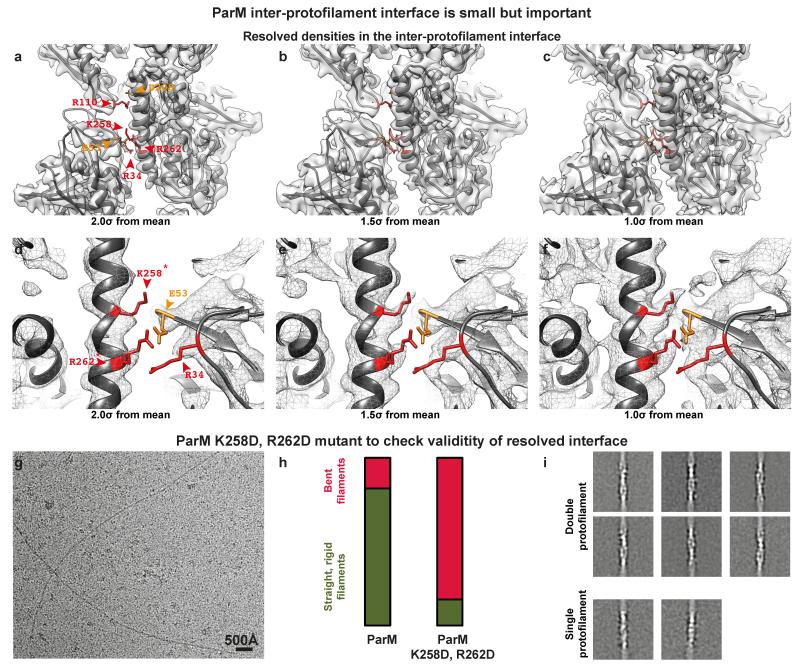
Surprisingly, the two protofilaments (strands) making up the double-helical ParM filament are held together only by salt bridges (Fig. 2a-b, ED Fig. 2-3 and ED Table 2). The ParM inter-protofilament interface is small (calculated interface area 371 Å2) and does not resemble a canonical protein-protein interface containing a hydrophobic core. To demonstrate the validity of this assessment we mutated two positively charged residues within the inter-protofilament interface to aspartic acids (K258D, R262D) and tested what effect this has on the stability of ParM filaments. Filament formation (with AMPPNP) from the resulting mutant protein ParM (K258D, R262D) was inefficient (ED Fig. 3g). The few filaments that were formed were unstable, and tended to be bent (Fig. 2c, S3h). Reference-free class averaging of these filaments showed that even though the majority of the few observed filaments were double helical like wild-type ParM, some single-helical filaments were also present (Fig. 2d, S3i). These observations indicate that although the interface between protofilaments in ParM is surprisingly small, it is sufficient for double filament assembly since many identical contacts along the filament contribute to the overall binding energy. Different actin-like proteins show very different filament arrangements, from single (crenactin, possibly 11) to parallel double helical (left-handed: ParM, right-handed: actin and non-staggered: MamK 12) and antiparallel, double straight (MreB). We propose that small and simple inter-protofilament contacts could have made it possible to change inter-protofilament arrangements relatively easily during evolution since all these actin-like filaments show similar longitudinal contacts 13.
Figure 2. ParM filaments are made up of two protofilaments held together by salt bridges, which are perturbed when ParM is bound to ADP.
(a) The refined atomic model of ParM+AMPPNP filaments shows that the protofilaments are held together laterally by salt bridges. Basic residues at the interface are highlighted in red and acidic residues in orange (see ED Table 2). Within the protofilaments’ longitudinal interfaces, more extensive hydrophobic interactions are observed (see ED Fig. 2). (b) A magnified view of a). The charges of two basic residues at the interface were inverted by mutation for panel c) (K258D, R262D). (c) The resulting protein formed filaments inefficiently. Cryo-EM image showing filaments of ParM(K258D, R262D) assembled with AMPPNP. This experiment was repeated four times. (d) In addition to normal double-helical filaments, some single-helical filaments were observed by image classification and averaging. (e) Fourier shell correlation (FSC) curves for the four cryo-EM structures presented in this study (see ED Table 1). (f) Cryo-EM image of ParM+ADP filaments. High protein concentrations were required to obtain these filaments and monomeric proteins can be seen. This experiment was repeated six times. (g) Comparison of filtered class averages of ParM+ATP and ParM+ADP filaments. Compared to the ATP bound state, the pitch of the ParM+ADP filaments reduced by ~ 3 Å (see Video 2). (h) Cryo-EM reconstruction of ParM+ADP filaments at 11 Å resolution with 5 copies of the ParM+ADP X-ray structure fitted. (i) The same pseudo-atomic fit without the cryo-EM density. (j) A magnified view of the perturbed inter-protofilament interface in the ParM+ADP filaments.
The protofilaments of ParM themselves are held together by an extensive longitudinal contact area (~995 Å2), containing both hydrophilic and hydrophobic interactions (ED Fig. 2 and ED Table 2). Actin filaments have also been shown to have the same difference in interface size between the longitudinal and lateral contacts 14-16. Interestingly, this difference has also been observed in tubulin polymers, microtubules 17.
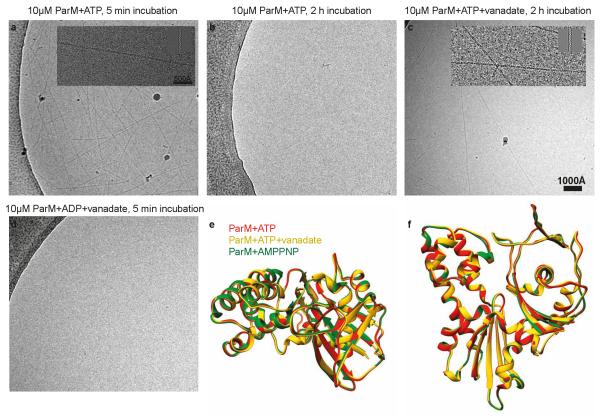
ParM’s dynamic instability is caused by intrinsic ATP hydrolysis in the filament and the resulting adenosine diphosphate (ADP)-bound filament being less stable 18, while being temporally protected by an ATP cap. We therefore assembled ParM+ATP filaments and obtained a 7.5 Å cryo-EM structure of these filaments (ED Fig. 4). Since the nucleotide state of this structure may be mixed, we devised a way to inhibit ParM’s ATPase with vanadate. Addition of sodium orthovanadate to the ParM+ATP solution retarded filament disassembly and we captured these ParM+ATP+vanadate filaments before complete disassembly and obtained a 6.4 Å structure (ED Fig. 4). Comparison of the three cryo-EM structures (+AMPPNP, +ATP, +ATP+vanadate) indicates that ParM is held in the same rigid, compact conformation, either until ATP is hydrolysed to ADP or until phosphate is released (ED Fig. 4e-f).
Therefore the state with an expected conformational change should be ADP-bound, and since ParM+ADP has a much higher critical concentration for filament formation, we incubated a concentrated solution of ParM with ADP for cryo-EM (Fig. 2f). This specimen yielded a lower resolution reconstruction at 11 Å. Further refinement was not possible, and adding data did not improve the resolution of the structure (Fig. 2e, ED Table 1). This indicated significant flexibility in the ParM+ADP filaments. Surprisingly, the overall helical pitch of the ParM+ADP filaments is significantly smaller than in the other nucleotide states (ADP: 51 Å vs. 54 Å, Fig. 2g, ED Table 1). The previously solved ParM+ADP X-ray structure (PDB 1MWM) 6 was sub-divided into its two domains and these were fitted as rigid bodies into the ParM+ADP cryo-EM reconstruction (Fig. 2h-i). Since the helical symmetry of ParM+ADP filaments is different from the ParM+ATP filaments, the interaction of ParM subunits with each other is also different in the two states. In ParM+ADP filaments, salt bridges at the inter-protofilament can no longer be formed and rather repulsing charges are brought close together (Fig. 2j). Additionally, change in helical pitch of the filament may also come with a substantial change in the longitudinal interface. These two factors together could explain why ParM+ADP filaments are less stable, and indicate why ParM filaments rapidly dissociate into monomeric form upon ATP hydrolysis, leading to dynamic instability (Video 2).
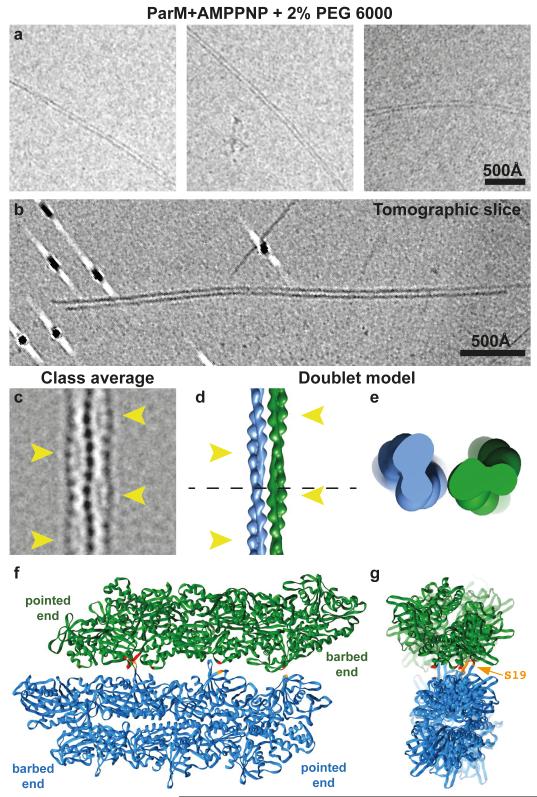
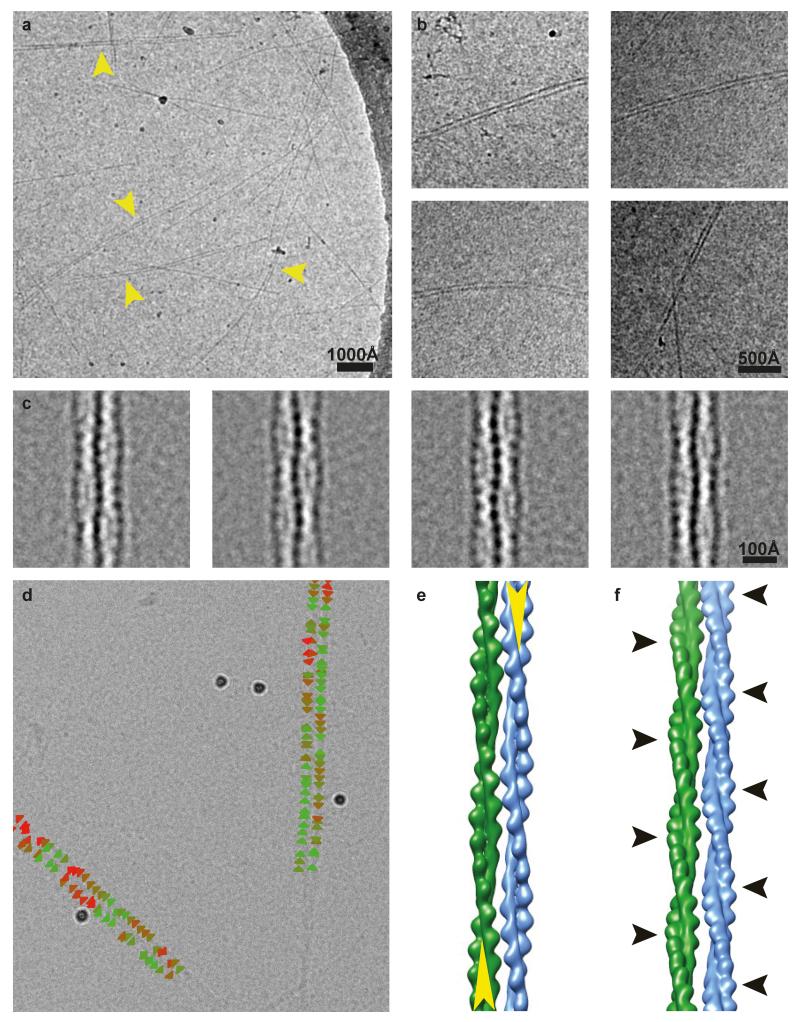
Having described the structure of the ParM filaments, we then wished to put the structural data in context of the bipolar spindles that segregate plasmid DNA in cells. For bipolar spindles to form, filamentous ParM subunits must engage in another interaction, inter-filament contacts, formed between double-helical filaments. It was known that incubation of ParM filaments with a crowding agent causes them to bundle 19. However, bundles are not amenable to high-resolution cryo-EM analysis because of their heterogeneity 20. To obtain a more defined sample, we titrated ParM+AMPPNP with varying amounts of crowding agent. When 2 % poly ethylene glycol (PEG) 6000 was added to ParM+AMPPNP, we found that ParM filaments dimerised to form ‘doublets’, containing two double-helical filaments (Fig. 3a, ED Fig. 5a-b). In raw cryo-EM images, doublets appeared as two roughly parallel lines, with no evidence of supercoiling or twisting. Electron cryotomography (cryo-ET) of the doublet specimen confirmed that the filaments do not twist around each other (Fig. 3b, Video 3).
Figure 3. ParM doublets formed in vitro.
(a) Cryo-EM images of ParM doublets formed in vitro with crowding agent PEG 6000. This experiment was repeated 15 times. (b) Slice through an electron cryotomogram (cryo-ET) showing clear lack of super-helicity in the doublets (see Video 3). (c) A 2D class average of the ParM doublet. The thickest parts of double helical ParM filaments have been indicated with yellow arrowheads (see ED Fig. 5). (d) Model of the doublet, shown in the same orientation as the class average in c) (see Video 4). (e) An orthogonal, magnified view of the doublet cut at the plane shown as a dashed line in d). (f) Atomic model of the doublet. Residues shown in red in one ParM filament interact with residues in orange in the other filament (see ED Table 2). (g) An orthogonal view of the doublet, with the filament axes going into the plane of the paper. One of the residues (S19) that forms the doublet interface has been highlighted (see ED Fig. 6).
We then performed reference-free two-dimensional (2D) classification of doublet images (Fig. 3c, ED Fig. 5c). Pleasingly, the two ParM filaments in the doublet were perfectly out of phase with each other. When viewed as a projection (in a cryo-EM class average), the thickest part of one filament in the doublet perfectly aligns with the thinnest part of the other double helical filament. We picked small segments along single ParM filaments that formed the doublets and aligned the segments to re-projections of the high-resolution ParM+AMPPNP structure we solved above. Using this alignment, directionality could be assigned to each filament in the doublet. We found that in 84% of the cases, the ParM in vitro doublets appeared to be made of two anti-parallel filaments (ED Fig. 5d) while opposite matches were probably due to incorrect assignment of the short segments.
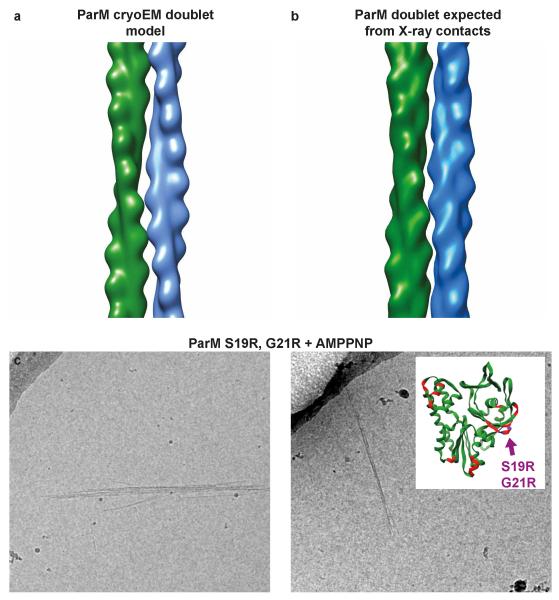
Using the class averages and the directionality assignment, we obtained an averaged model for the ParM doublet (Fig. 3d-g, ED Fig. 5e-f, Video 4). Two ParM monomers from adjoining filaments in the doublet model were found to be in a similar orientation as observed in a previous crystal structure of ParM (ED Fig. 6a-b)3. The model of the doublet predicts residues in ParM that should be important in doublet formation (Fig. 3f-g, ED Table 2) and confirmed earlier work, including mutations that modulate the strength of the inter-filament contact. One such set of mutations consisted of S19R and G21R 3. These mutations had been selected previously based on the fact that they are located the furthest away from the filament axis, essentially sticking out, but are shown here directly to be involved in the inter-filament contact. In line with this, mutant ParM(S19R, G21R) spontaneously formed doublets and bundles (ED Fig. 6c), without any crowding agent present in solution, validating both the previous Total Internal Reflection Fluorescence (TIRF) data 3 as well as the current atomic model of the ParM doublet.
Previous TIRF microscopy imaging of the reconstituted ParMRC spindles 3 as well as the model of the ParM doublet derived here are in vitro experiments. To test whether the doublets have physiological relevance, we visualised ParM filaments inside growing E. coli cells. Previously, direct observation of ParM filaments by cryo-EM was only possible by cryo-sectioning of frozen bacterial cells since whole cells were deemed too thick 19. Importantly, in vitreous sections filaments could only be visualised end-on, not revealing much about the inter-filament contacts. Using new direct electron detectors, signal-to-noise has been significantly improved so we aimed at imaging bipolar spindles directly inside cells using whole cell cryo-ET.
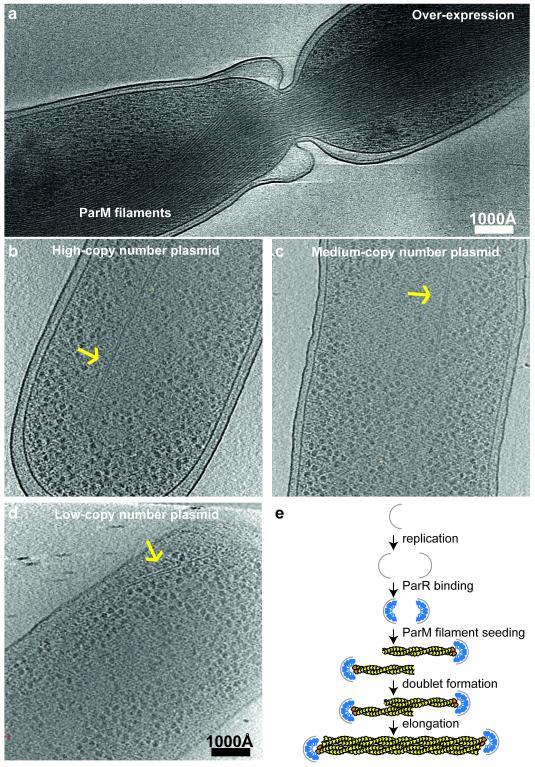
As a first test, we over-expressed a mutant of ParM (D170A) that hydrolysed ATP much more slowly in thin E. coli cells. As observed previously in vitreous sections 19, cryo-ET of these cells (Fig. 4a) allowed unambiguous identification of the over-expressed ParM mutant protein through its tendency to form extremely large bundles.
Figure 4. ParM doublets in E. coli cells, imaged by cryo-ET.
(a) A mutant of ParM that hydrolyses ATP more slowly (D170A) was over-expressed in E. coli cells. Tomographic slices show large bundles of ParM blocking cell division. This experiment was performed two times. (b) The ParMRC operon driven from high-copy number plasmid pDD19. Tomographic slice showing an example of observed doublets. (c) Tomographic slice for a medium-copy number plasmid (pKG321). (d) Tomographic slice for a low-copy number plasmid, emulating the native low-copy number R1 plasmids (pKG491, ‘mini-R1’ replicon) in E. coli (see Videos 5-6 to view entire tomograms). Each experiment with different copy number plasmids was performed once. (e) Schematic depicting proposed asynchronous plasmid DNA segregation. Bipolar ParM spindles are seeded when replication has produced two parC centromeric regions, still in close proximity. Each seeds one unipolar ParM filament that then come together in an antiparallel fashion to form the segregating bipolar spindle. Non-productive unipolar filaments or spindles that lack plasmid attachment will be destroyed through ParM’s dynamic instability. This is in contrast to earlier ideas in which all sister plasmids would be segregated through one bundle of filaments, containing double the number of unipolar filaments as the copy number of the plasmid in the cell 19.
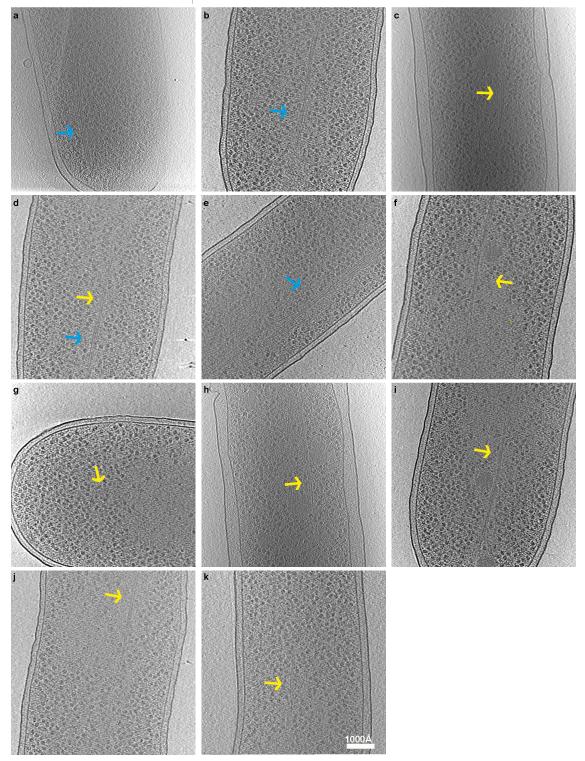
We then used plasmids with different copy numbers 21, all of which contained the entire ParMRC locus and transformed them in turn into E. coli cells. Cryo-ET of these cells revealed the presence of doublets in all cases (Fig. 4b-d, Videos 5-6, ED Fig. 7, ED Table 3). All doublets were roughly aligned with the long cell axis, and were never observed perpendicular to the cell axis. Although bundles were observed in the high and medium copy number plasmid cases, they were not observed in the low-copy number (mini-R1) case, where partitioning via ParMRC is required for plasmid stability 22. These cryo-ET data are in line with previous immuno-light microscopy data, where single pole-to-pole filaments were only observed in 40 % of cells 1,10 and the other cells showed several localised clusters or more complex patterns.
The above data showed that ParM doublets are found in cells containing the ParMRC locus, and are likely the machinery that actively segregates plasmid DNA to opposite ends of the dividing cell, even though antiparallel arrangement of ParM filaments in cellular doublets can only be inferred from the in vitro studies above. It is interesting to observe that the ratios of doublets observed per cell was the same as the ratios of the expected copy numbers of the three plasmids, although it needs to be noted that numbers remain small because of the low throughput nature of cryo-ET (ED Table 3). The ratios might indicate that each doublet carries a defined payload of DNA cargo, a fixed number of plasmids containing the parC locus. We propose that ParMRC spindles consisting solely of doublets elegantly circumvent the problem of synchronising plasmid replication, filament attachment and bundle formation for all plasmids in the cell: each pair of plasmid sisters is segregated by their own spindle. The resulting asynchronous plasmid segregation is schematically summarised in Fig. 4e. Indeed, it is known that R1 plasmids are replicated randomly throughout the cell cycle 23,24. In contrast, eukaryotic DNA segregation requires cohesion, kinetochore checkpoints and other dedicated machinery since all material is segregated with one coordinated and synchronised spindle.
Extended Data
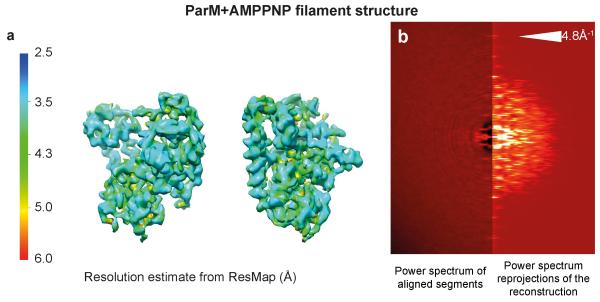
Extended Data Figure 1. Resolution estimate of the ParM+AMPPNP reconstruction.
(a) Resolution of the ParM+AMPPNP reconstruction was estimated using ResMap and this estimate was plotted back onto the cryo-EM density. Blue indicates high-resolution while red indicates lower resolution. (b) The power spectrum of the aligned segments (left) compared to the power spectrum of the re-projection of the cryo-EM reconstruction (right). A reflection is observed in both cases at 4.8 Å−1 indicating that the resolution extends beyond this shell. See Fig. 2e for Fourier Shell Correlation (FSC) curves.
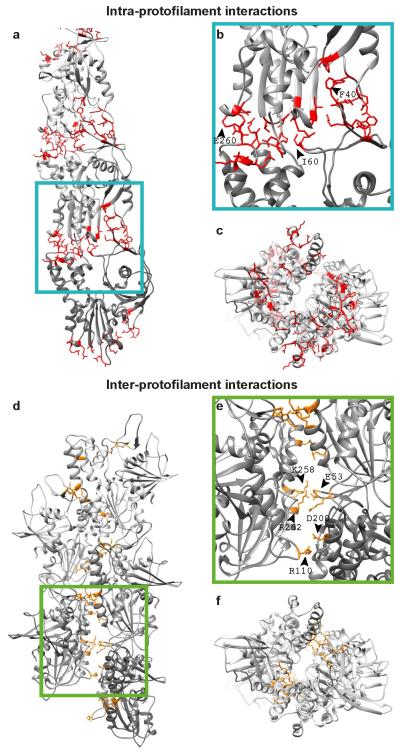
Extended Data Figure 2. Intra- and inter-protofilament interactions in ParM filaments.
(a) Atomic model of one protofilament (strand) of ParM is shown with the residues at the protein:protein interface highlighted in red. See ED Table 2 for a detailed list. (b) A magnified view of the interface. Three residues at the interface have been labelled. (c) The complete ParM filament (i.e. both protofilaments/strands) shown end-on. (d) Atomic model of the ParM filament with the inter-protofilament residues at the protein:protein interface highlighted in orange. (e) A magnified view of d). Salt bridging residues are labelled. (f) An orthogonal view of d). See ED Table 2 for a detailed list of interacting residues.
Extended Data Figure 3. The ParM inter-protofilament interface is small but important.
(a) Cryo-EM density for the ParM+AMPPNP filament is shown at an isosurface contour level of 2.0 σ from the mean value. Overlaid on the density, refined atomic coordinates from REFMAC are additionally displayed as grey ribbons. Residues forming salt bridges at the inter-protofilament interface are highlighted. (b) The same figure as a), except the cryo-EM density shown at an isosurface contour level of 1.5 σ from the mean. (c) 1.0 σ from the mean. (d-f) A magnified view of the primary salt-bridged interface consisting of charged residues that form the ParM inter-protofilament interface. The cryo-EM density is shown as a mesh at three different contour levels to demonstrate resolved side chain densities. Positively charged residues are highlighted in red while negatively charged residues are highlighted in orange. (g) Two residues (K258 and R262) that were the best resolved (marked with an * in d), were mutated to aspartic acid to test the importance of this inter-protofilament interface. A cryo-EM image of this mutant protein assembled with AMPPNP is shown. A much higher concentration of the protein was required to obtain filaments on cryo-EM grids (Supplementary Methods). This experiment was repeated four times. (h) Randomly selected cryo-EM images of ParM+AMPPNP and ParM(K258D, R262D)+AMPPNP were used to count occurrences of straight and bent filaments by visual inspection. The results of this quantification are shown as a percentage bar diagram. For the ParM protein, 82% of all filaments were classified as straight, while 18% were bent (n=345). Using exactly the same classification criteria, only 15% of the filaments were found to be straight and 85% of the filaments were bent (n=45) for the ParM(K258D, R262D) mutant protein. (i) Reference-free class averages show that most of the ParM(K258D, R262D) filaments are made up of double protofilaments like wild-type ParM. Some class averages show evidence of bending. A few class averages show that single protofilaments were present in the sample (lower panels). However, the double mutation destabilises the entire ParM filament, making filament formation an unfavourable reaction, illustrating that even though the inter-protofilament interface is small, it is critical for ParM filament formation.
Extended Data Figure 4. ParM adopts a compact conformation until ATP is hydrolysed to ADP or until phosphate is released.
(a) ParM protein (10 μM) was incubated with ATP (2 mM) and cryo-EM samples were prepared after 5 minutes. Many filaments were observed on the grid. This experiment was repeated ten times. (b) After two hours, no filaments were seen in the same reaction. Presumably, ATP had been hydrolysed and ParM had returned to monomeric form. This experiment was repeated three times. (c) When sodium orthovanadate (4 mM) was included in the reaction, filaments could be observed even after two hours. This experiment was repeated three times. (d) The same reaction as a), except ATP was replaced by ADP. No filaments were observed in this reaction. This experiment was repeated four times. (e, f) We performed real-space helical reconstruction of the ParM+ATP filaments (red) and ParM+ATP+vanadate filaments (yellow), and compared them with the ParM+AMPPNP filament structure (green). Comparison shows that ParM is held in a very similar conformation until hydrolysis of ATP is complete or until phosphate is released since we currently cannot distinguish these two possible effects of vanadate. See Fig. 2e for resolution estimates and ED Table 1 for image processing statistics.
Extended Data Figure 5. Model of the ParM doublet.
(a) A cryo-EM image of ParM+AMPPNP + 2% PEG 6000. Instances of doublets are marked with yellow arrowheads. This experiment was repeated 15 times. (b) More examples of ParM doublets observed in cryo-EM. (c) Class averages of the doublets. (d) Directionality assignment of the filaments in the doublet. Individual sub-segments and their assigned directionality are indicated by triangles, coloured based on the cross-correlation score in the alignment procedure: red indicates a poor cross correlation score while green indicates a good score. (e) A schematic model of the anti-parallel ParM doublet. Directionality is indicated with a yellow arrow. (f) The thickest parts of ParM filaments of the doublet (as they appear in projection) are marked with black arrowheads.
Extended Data Figure 6. Validation of the doublet model.
(a) Two ParM monomers arranged in an anti-parallel orientation, as obtained from the ParM cryo-EM doublet model. (b) Two ParM monomers arranged in an anti-parallel orientation, obtained from crystal packing of a monomeric ParM X-ray structure (PDB 4A62) 3. (c) Two residues at the interface of the doublet (see ED Table 2), S19 and G21 were mutated to arginine to improve affinity of ParM filaments to each other. Cryo-EM images of the mutant protein with AMPPNP show spontaneous doublet formation and filament bundling without crowding agent, validating the doublet model. This experiment was repeated six times.
Extended Data Figure 7. ParM bundles and doublets observed in vivo.
(a-k) E. coli B/R266 cells were transformed with a high-copy (pDD19), or medium-copy (pKG321) plasmid containing the ParMRC locus. Transformed cells were grown to log phase and then prepared for cryo-EM. This figure shows a gallery of ParM bundles (blue arrows) and doublets (yellow arrows) observed in these cells. Panels a, c, e and h show cells transformed with the high-copy number plasmid while panels b, d, f, g, i, j and k show cells transformed with the medium copy number plasmid. Each experiment with different copy number plasmids was performed only once due to low-throughput nature of cryo-ET.
Extended Data Table 1.
Image processing statistics for cryo-EM reconstructions of ParM filaments
| ParM+AMPPNP | ParM+ATP | ParM+ATP+vanadate | ParM+ADP | |
|---|---|---|---|---|
| Resolution, FSC at 0.143 (Å) | 4.3 | 7.5 | 6.4 | 11.0 |
| Filament pitch (Å) | 54.0 | 54.0 | 53.8 | 51.0 |
| Subunits per turn | 2.18 | 2.18 | 2.18 | 2.18 |
| Input segment step size (Å) | 268 | 161 | 161 | 153 |
| Segment size for alignment (Å2) | 364×364 | 400×400 | 400×400 | 700×700 |
| Asymmetric units included | 561,231 | 13,825 | 122,864 | 53,648 |
Extended Data Table 2.
Interfaces forming residues of ParM
Residues of ParM that are part of interfaces have been highlighted. Inter- and intra-protofilament interface-forming residues have been highlighted in red and green respectively (web version). These residues have been assigned using a 4 Å distance cut off based on the ParM+AMPPNP structure. Residues forming the inter-filament interface in the ParM doublet have been highlighted in blue (web version). This assignment was based on a 7 Å distance cut off for C-α atoms in the derived model of the ParM doublet because of the lower accuracy of the model.
| Interface | Residue Numbers | Sequence |
|---|---|---|
| Inter-protofilament interface | 1 | MLVFIDDGSTNIKLQWQESDGTIKQHISPNSFKREWAVSFGDKKVFNYTLNGEQYSFDPI |
| 61 | SPDAVVTTNIAWQYSDVNVVAVHHALLTSGLPVSEVDIVCTLPLTEYYDRNNQPNTENIE | |
| 121 | RKKANFRKKITLNGGDTFTIKDVKVMPESIPAGYEVLQELDELDSLLIIDLGGTTLDISQ | |
| 181 | VMGKLSGISKIYGDSSLGVSLVTSAVKDALSLARTKGSSYLADDIIIHRKDNNYLKQRIN | |
| 241 | DENKISIVTEAMNEALRKLEQRVLNTLNEFSGYTHVMVIGGGAELICDAVKKHTQIRDER | |
| 301 | FFKTNNSQYDLVNGMYLIGN | |
| Intra-protofilament interface | 1 | MLVFIDDGSTNIKLQWQESDGTIKQHISPNSFKREWAVSFGDKKVFNYTLNGEQYSFDPI |
| 61 | SPDAVVTTNIAWQYSDVNVVAVHHALLTSGLPVSEVDIVCTLPLTEYYDRNNQPNTENIE | |
| 121 | RKKANFRKKITLNGGDTFTIKDVKVMPESIPAGYEVLQELDELDSLLIIDLGGTTLDISQ | |
| 181 | VMGKLSGISKIYGDSSLGVSLVTSAVKDALSLARTKGSSYLADDIIIHRKDNNYLKQRIN | |
| 241 | DENKISIVTEAMNEALRKLEQRVLNTLNEFSGYTHVMVIGGGAELICDAVKKHTQIRDER | |
| 301 | FFKTNNSQYDLVNGMYLIGN | |
| Inter-filament interface (doublet) | 1 | MLVFIDDGSTNIKLQWQESDGTIKQHISPNSFKREWAVSFGDKKVFNYTLNGEQYSFDPI |
| 61 | SPDAVVTTNIAWQYSDVNVVAVHHALLTSGLPVSEVDIVCTLPLTEYYDRNNQPNTENIE | |
| 121 | RKKANFRKKITLNGGDTFTIKDVKVMPESIPAGYEVLQELDELDSLLIIDLGGTTLDISQ | |
| 181 | VMGKLSGISKIYGDSSLGVSLVTSAVKDALSLARTKGSSYLADDIIIHRKDNNYLKQRIN | |
| 241 | DENKISIVTEAMNEALRKLEQRVLNTLNEFSGYTHVMVIGGGAELICDAVKKHTQIRDER | |
| 301 | FFKTNNSQYDLVNGMYLIGN |
Extended Data Table 3.
Instances of single, double and bundled ParM filaments seen in bacterial cells with different copy number plasmids
The ParMRC locus was inserted into high, medium and low-copy number plasmids (plasmids pDD19, pKG321 and pKG491 respectively). These plasmids were in turn inserted into E. coli cells and imaged using cryoET. The ratio of observed doublets per cell (i.e. the number of doublets observed divided by the number of cells imaged) was 5.8:1.6:0.3 (~19:5:1). These ratios are roughly the same as the expected copy number ratios of the different copy-number plasmids.
| Plasmid type | Single filaments | Double filaments | Bundles | Total number of cells imaged | Doublets per cell |
|---|---|---|---|---|---|
| High copy | 5 | 35 | 8 | 6 | 5.83 |
| Medium copy | 11 | 36 | 2 | 23 | 1.56 |
| Low copy | 4 | 4 | 0 | 14 | 0.28 |
Supplementary Material
Acknowledgements
We would like to thank Fusinita van den Ent, Kenn Gerdes and P. Gayathri for help with sample preparation; Chris Johnson, Christos Savva and Felix de Haas for help with data collection. This work was supported by the Medical Research Council (U105184326) and the Wellcome Trust (095514/Z/11/Z). TAMB is the recipient of FEBS and EMBO (ALTF 3-2013) long-term fellowships. GNM was funded by MRC grant MC-UP-A025-1012.
Footnotes
Competing interests: The authors declare no competing interests.
Data deposition: Cryo-EM and cryo-ET data have been deposited in the Electron Microscopy Data Bank (EMD-2848, EMD-2849 and EMD-2850) and atomic co-ordinates of the ParM+AMPPNP filament structure and the ParM antiparallel doublet model have been deposited in the Protein Data Bank (PDB ID codes 5AEY and 5AI7).
References
- 1.Møller-Jensen J, Jensen RB, Löwe J, Gerdes K. Prokaryotic DNA segregation by an actin-like filament. EMBO J. 2002;21:3119–27. doi: 10.1093/emboj/cdf320. [DOI] [PMC free article] [PubMed] [Google Scholar]
- 2.Gerdes K, Howard M, Szardenings F. Pushing and pulling in prokaryotic DNA segregation. Cell. 2010;141:927–42. doi: 10.1016/j.cell.2010.05.033. [DOI] [PubMed] [Google Scholar]
- 3.Gayathri P, et al. A bipolar spindle of antiparallel ParM filaments drives bacterial plasmid segregation. Science. 2012;338:1334–7. doi: 10.1126/science.1229091. [DOI] [PMC free article] [PubMed] [Google Scholar]
- 4.Orlova A, et al. The structure of bacterial ParM filaments. Nat Struct Mol Biol. 2007;14:921–6. doi: 10.1038/nsmb1300. [DOI] [PMC free article] [PubMed] [Google Scholar]
- 5.Popp D, et al. Molecular structure of the ParM polymer and the mechanism leading to its nucleotide-driven dynamic instability. EMBO J. 2008;27:570–9. doi: 10.1038/sj.emboj.7601978. [DOI] [PMC free article] [PubMed] [Google Scholar]
- 6.van den Ent F, Moller-Jensen J, Amos LA, Gerdes K, Lowe J. F-actin-like filaments formed by plasmid segregation protein ParM. EMBO J. 2002;21:6935–43. doi: 10.1093/emboj/cdf672. [DOI] [PMC free article] [PubMed] [Google Scholar]
- 7.Møller-Jensen J, Ringgaard S, Mercogliano CP, Gerdes K, Löwe J. Structural analysis of the ParR/parC plasmid partition complex. EMBO J. 2007;26:4413–22. doi: 10.1038/sj.emboj.7601864. [DOI] [PMC free article] [PubMed] [Google Scholar]
- 8.Schumacher MA, et al. Segrosome structure revealed by a complex of ParR with centromere DNA. Nature. 2007;450:1268–71. doi: 10.1038/nature06392. [DOI] [PubMed] [Google Scholar]
- 9.Garner EC, Campbell CS, Weibel DB, Mullins RD. Reconstitution of DNA segregation driven by assembly of a prokaryotic actin homolog. Science. 2007;315:1270–4. doi: 10.1126/science.1138527. [DOI] [PMC free article] [PubMed] [Google Scholar]
- 10.Møller-Jensen J, et al. Bacterial mitosis: ParM of plasmid R1 moves plasmid DNA by an actin-like insertional polymerization mechanism. Mol Cell. 2003;12:1477–87. doi: 10.1016/s1097-2765(03)00451-9. [DOI] [PubMed] [Google Scholar]
- 11.Izore T, Duman R, Kureisaite-Ciziene D, Lowe J. Crenactin from Pyrobaculum calidifontis is closely related to actin in structure and forms steep helical filaments. FEBS Lett. 2014;588:776–82. doi: 10.1016/j.febslet.2014.01.029. [DOI] [PMC free article] [PubMed] [Google Scholar]
- 12.Ozyamak E, Kollman J, Agard DA, Komeili A. The bacterial actin MamK: in vitro assembly behavior and filament architecture. J Biol Chem. 2013;288:4265–77. doi: 10.1074/jbc.M112.417030. [DOI] [PMC free article] [PubMed] [Google Scholar]
- 13.Ozyamak E, Kollman JM, Komeili A. Bacterial actins and their diversity. Biochemistry. 2013;52:6928–39. doi: 10.1021/bi4010792. [DOI] [PMC free article] [PubMed] [Google Scholar]
- 14.Fujii T, Iwane AH, Yanagida T, Namba K. Direct visualization of secondary structures of F-actin by electron cryomicroscopy. Nature. 2010;467:724–8. doi: 10.1038/nature09372. [DOI] [PubMed] [Google Scholar]
- 15.von der Ecken J, et al. Structure of the F-actin--tropomyosin complex. Nature. 2014 doi: 10.1038/nature14033. [DOI] [PMC free article] [PubMed] [Google Scholar]
- 16.Galkin VE, Orlova A, Vos MR, Schroder GF, Egelman EH. Near-Atomic Resolution for One State of F-Actin. Structure. 2015;23:173–182. doi: 10.1016/j.str.2014.11.006. [DOI] [PMC free article] [PubMed] [Google Scholar]
- 17.Alushin GM, et al. High-resolution microtubule structures reveal the structural transitions in alphabeta-tubulin upon GTP hydrolysis. Cell. 2014;157:1117–29. doi: 10.1016/j.cell.2014.03.053. [DOI] [PMC free article] [PubMed] [Google Scholar]
- 18.Garner EC, Campbell CS, Mullins RD. Dynamic instability in a DNA-segregating prokaryotic actin homolog. Science. 2004;306:1021–5. doi: 10.1126/science.1101313. [DOI] [PubMed] [Google Scholar]
- 19.Salje J, Zuber B, Löwe J. Electron cryomicroscopy of E. coli reveals filament bundles involved in plasmid DNA segregation. Science. 2009;323:509–12. doi: 10.1126/science.1164346. [DOI] [PubMed] [Google Scholar]
- 20.Popp D, Narita A, Iwasa M, Maéda Y, Robinson RC. Molecular mechanism of bundle formation by the bacterial actin ParM. Biochem Biophys Res Commun. 2010;391:1598–603. doi: 10.1016/j.bbrc.2009.12.078. [DOI] [PubMed] [Google Scholar]
- 21.Dam M, Gerdes K. Partitioning of plasmid R1. Ten direct repeats flanking the parA promoter constitute a centromere-like partition site parC, that expresses incompatibility. J Mol Biol. 1994;236:1289–98. doi: 10.1016/0022-2836(94)90058-2. [DOI] [PubMed] [Google Scholar]
- 22.Breuner A, Jensen RB, Dam M, Pedersen S, Gerdes K. The centromere-like parC locus of plasmid R1. Mol Microbiol. 1996;20:581–92. doi: 10.1046/j.1365-2958.1996.5351063.x. [DOI] [PubMed] [Google Scholar]
- 23.Gustafsson P, Nordstrom K. Control of plasmid R1 replication: kinetics of replication in shifts between different copy number levels. J Bacteriol. 1980;141:106–10. doi: 10.1128/jb.141.1.106-110.1980. [DOI] [PMC free article] [PubMed] [Google Scholar]
- 24.Nordstrom K. Plasmid R1--replication and its control. Plasmid. 2006;55:1–26. doi: 10.1016/j.plasmid.2005.07.002. [DOI] [PubMed] [Google Scholar]
Associated Data
This section collects any data citations, data availability statements, or supplementary materials included in this article.


