

Abstract
Intrinsically disordered protein regions are abundant in eukaryotic proteins and lack stable tertiary structures and enzymatic functions. Previous studies of disordered region evolution based on interspecific alignments have revealed an increased propensity for indels and rapid rates of amino acid substitution. How disordered regions are maintained at high abundance in the proteome and across taxa, despite apparently weak evolutionary constraints, remains unclear. Here, we use single nucleotide and indel polymorphism data in yeast and human populations to survey the population variation within disordered regions. First, we show that single nucleotide polymorphisms in disordered regions are under weaker negative selection compared with more structured protein regions and have a higher proportion of neutral non-synonymous sites. We also confirm previous findings that nonframeshifting indels are much more abundant in disordered regions relative to structured regions. We find that the rate of nonframeshifting indel polymorphism in intrinsically disordered regions resembles that of noncoding DNA and pseudogenes, and that large indels segregate in disordered regions in the human population. Our survey of polymorphism confirms patterns of evolution in disordered regions inferred based on longer evolutionary comparisons.
Keywords: SNP, indel
Introduction
It is widely accepted that the three-dimensional structure of a protein determines its molecular structure and affects its biological function (Alberts et al. 2002; Berg et al. 2002). However, growing evidence suggests that protein regions without rigid, tertiary, three-dimensional structures are prevalent in the eukaryotic proteome (Iakoucheva et al. 2002, 2004; Ward et al. 2004; Galea et al. 2006, 2009). These so-called “intrinsically disordered regions” have different amino acid compositions than globular proteins (Uversky et al. 2000; Singh et al. 2006; Theillet et al. 2013) and are crucial for signaling and protein–protein interactions (Ren et al. 2008; Garza et al. 2009). Disordered regions have been of recent research interest and approximately 30% of human proteins contain disordered regions (Ward et al. 2004), including many disease-associated proteins (Uversky et al. 2008).
Despite the abundance of these regions, the amino acid sequences of most disordered regions are poorly conserved across taxa (Daughdrill et al. 2007). Therefore, it remains unclear how these disordered regions have been maintained through evolutionary time and why they are so predominant in eukaryotic proteins. The amino acid composition of disordered regions is significantly different from random amino acids expected based on the genetic code, which suggests that these regions are unlikely to be entirely randomly evolving “junk” (Szalkowski and Anisimova 2011). Preceding investigations have revealed increased rates of amino acid substitutions (Brown et al. 2002), differences in patterns of substitution (compared with typical ordered protein) (Brown et al. 2010), and increased rates of insertion and deletion (indels) in disordered regions (de la Chaux et al. 2007; Light, Sagit, Ekman, et al. 2013). Furthermore, indels in disordered regions are under weaker negative selection relative to structured protein regions, and a large degree of variation in protein length is attributable to disordered regions (Light, Sagit, Sachenkova, et al. 2013). Indeed, disordered regions seem to have particularly weak constraints on indels, as the ratio of substitutions to indels in disordered regions is dramatically lower (Toth-Petroczy and Tawfik 2013). All these patterns are consistent with weak constraints on disordered regions compared with globular proteins. On the other hand, a recent study has identified about 5% of residues in yeast disordered regions as short stretches of conserved amino acids, a subset of which are confirmed functional motifs, although most have still not been examined in detail (Nguyen Ba et al. 2012). It has also been suggested that some disordered regions are conserved over long evolutionary distances even when the specific amino acids are not (Chen et al. 2006; Daughdrill et al. 2007; Toth-Petroczy et al. 2008) and that there is a subset of disordered regions that are conserved at the amino acid level (Bellay et al. 2011; Colak et al. 2013). Furthermore, one study suggested that disordered regions are the primary targets of positive selection in yeast and that disordered regions in Pfam domains contain similar numbers of functional sites as other protein regions (Nilsson et al. 2011). These observations point to the possibility of strong functional constraints on disordered regions.
Most studies that estimated evolutionary constraint on disordered regions have relied on interspecies comparisons using pairwise alignments of disordered regions across species. Because of their apparent rapid rate of evolution (Brown et al. 2002), protein sequences of disordered regions are difficult to align accurately, particularly at long evolutionary distances, which limits the power of classical comparative molecular evolutionary approaches to study these regions. Here, we take advantage of population genomics data to circumvent potential alignment issues to confirm the previous observations, and quantify rates of polymorphism and test for evidence of selection based on site frequency spectra (SFSs). Using single nucleotide polymorphisms (SNPs) from human and yeast populations, and polarized distribution of fitness effect (DFE) analyses, we validate previous reports that amino acid replacements are under negative selection in yeast and humans, although disordered regions appear to be under moderately weaker constraints of selection compared with folding protein regions. We also find up to an order of magnitude increase in the rate of nonframeshifting insertion–deletion (indel) polymorphism in disordered regions, which approaches the rate in noncoding DNA or pseudogenes. We identify examples of large indels in disordered regions segregating in the human population. Our findings also suggest that nonframeshifting indels in disordered regions are largely neutral.
Materials and Methods
Predictions of Disordered Regions and Pfam Domains
Protein coding regions for yeast were obtained from SGD (Cherry et al. 2012) and for human from Ensembl (v62; Flicek et al. 2013). For human proteins, the longest splice form was used. Disordered regions were predicted using DISOPRED v3 (Jones and Cozzetto 2015) with default settings using the UniRef90 database (http://www.uniprot.org/help/, last accessed May 14, 2010; UniProt Consortium 2014) that had been filtered for repetitive regions, although we also performed the analysis using DISOPRED v2 (Ward et al 2004) and found similar results. For yeast, 28,560 disordered regions were predicted, and for human, 409,044 disordered regions were predicted in all protein isoforms (multiple transcripts per gene). Pfam domains were predicted by running HMMer 3.0 (http://hmmer.janelia.org/, last accessed May 14, 2010; Finn et al. 2011) (using default settings) on PFAM v.24 (ftp://ftp.ebi.ac.uk/pub/databases/Pfam/releases/Pfam24.0/relnotes.txt, last accessed February 22, 2010; Finn et al. 2008) on the yeast and human proteomes with the E-value of 0.001 as threshold. For both yeast and human, Pfam domains were required to have at least ten occurrences in the proteome, to ensure that they were likely to be independently folding domains, and not highly conserved entire proteins. This left 3,258 (of 8,482) domains in yeast and 27,264 (of 36,561) domains in human. We also excluded from the analysis polymorphisms in Pfam domains that were predicted to be disordered, as Pfam domains have been reported to contain disordered regions (Williams et al. 2013).
Determination of Pa/Ps Ratios
A total of 99,656 protein coding yeast SNPs were obtained from SGRP (Bergstrom et al. 2014) and 427,282 human SNPs were obtained from the 1000 Genomes Project (1000 Genomes Project Consortium 2012) website from the phase 1 Release v3, which is based on the GENCODE v7 (Derrien et al. 2012) annotations of genes and pseudogenes. The total number of SNPs in each region in humans includes the following: 132,661 in disordered regions, 188,393 in other ordered regions, and 100,337 in Pfam domains. Rates of amino acid (nonsynonymous) polymorphism were computed by dividing the total number of amino acid changing (nonsynonymous) polymorphisms by the total number of amino acid changing (synonymous) sites (calculated using the method of Nei and Gojoburi 1986).
Analysis of Yeast Protein Expression Levels
Yeast protein expression levels were obtained from PaxDB (Wang et al. 2012). Proteins were binned by protein expression levels and Pa/Ps ratios were calculated as above. Polymorphisms in proteins that had no expression information were excluded from the analysis. P-value for the figure 2 was determined using t-approximation for the distribution of the correlation coefficient. A total of 96,373 yeast SNPs were found in the regions of interest and more than 95% of yeast genes with SNPs had protein expression data from PaxDB (http://pax-db.org/#!species/4932, last accessed April 14, 2010).
Fig. 2.

— Polymorphism patterns and expression levels in yeast. (A) The Pa/Ps ratio decreases for all three regions with increased protein expression levels. The difference in polymorphism ratio between the three regions remains approximately constant, independent of protein expression level. Disordered regions (white) show higher Pa/Ps ratios across the whole range of expression levels compared with Pfam domains (black) or other protein regions (white). Protein abundance estimates were measured in ppm (parts per million). (B) Similar results are found for the per gene estimates of the Pa/Ps ratio. Error bars represent three times the standard error of the mean.
Yeast Derived Allele Frequency Spectra
The ancestral state of each SNP for the determination of derived allele frequencies (DAFs) was inferred by using Saccharomyces paradoxus as the reference outgroup. The SNPs were assorted according to their predicted region in S. cerevisiae (disordered regions, other ordered regions, Pfam domains). The assorted data can be downloaded from http://www.moseslab.csb.utoronto.ca/alan/snps_diso_pfam.txt. Finally, the SNPs in each protein region were assorted into 10 bins (0–0.9) according to their DAF values.
Human Site Frequency Spectra
SNPs from the Yoruba (YRI) population of the 1000 genomes project were used to estimate the DFE, while the full data set was used to analyze Pa/Ps ratios and indel polymorphisms (1000 Genomes Project Consortium 2012). Relatives of the third order (1st cousins) and closer were removed from the DFE analysis, leaving 105 YRI individuals. Inferred ancestral alleles reported in this data set were used to determine the DAF for each SNP.
Distribution of Fitness Effects
DFE-alpha v2.03 (Keightley and Eyre-Walker 2007) was implemented to estimate the distribution of effects of new mutations in focal protein regions, with the default options (Keightley and Eyre-Walker 2012) and custom scripts courtesy of Dan Halligan. We used the input folded SFS from the YRI data set described above and sites divergent with macaque for each focal site type and region were counted according to the Enredo-Pecan-Ortheus 6 primate alignment. This method assumes independence between sites (i.e., no linkage disequilibrium). This assumption was tested by dividing the genome into 50-kb windows and generating 200 bootstrap replicates for each site category, which gives a sense of the estimate error due to nonindependence. Significance between site categories was determined through a randomization test as described in Keightley and Eyre-Walker (2007). The total number of sites used in the DFE analysis is 5,820,297 (Pfam domains), 7,202,040 (disordered regions), and 9,167,914 (other ordered regions).
Indel Polymorphisms
Indel polymorphisms were obtained from SGRP (Bergstrom et al. 2014) and the 1000 genomes project (1000 Genomes Project Consortium 2012). Dubious genes were excluded from the analysis. The total number of S. cerevisiae indels (≤40 bp) is 415, 48, 800, and 8202 for disordered regions, Pfam domains, other ordered regions, and noncoding regions, respectively. Moreover, the number of human indels (≤30 bp) is 534, 125, 320, and 15,601 for disordered regions, Pfam domains, other ordered regions, and pseudogenes, respectively. To obtain a sufficient sample size, indels in pseudogene introns were included in the “pseudogene” indel set. Although introns are not expected to have similar patterns of indels to bona fide protein coding genes, because the idea of the psuedogene set was to have a set of indel polymorphisms that reflects the mutation spectrum with as few constraints as possible, including introns was acceptable, as they are expected to have few constraints as well. To compute the frequency of indel polymorphisms in each region, indels of each size were reported per kilobase pair of nucleotides in the corresponding region. For analysis of indel positions in protein coding genes, intron-containing genes were not included.
DNA and Protein Sequence Alignments
Vertebrate coding sequence alignments were downloaded from the UCSC genome browser (dbSNP 138) as subsets of the Multiz 100 vertebrate multiple sequence alignment. The UCSC versions of the sequence alignments of each species include the following: hg19 (human), canfam3 (dog), nomLeu3 (gibbon), gorGor3 (gorilla), mm10 (mouse), rheMac3 (rhesus), ponAbe2 (orangutan), calJac3 (marmoset), saiBol1 (squirrel monkey), and panTro4 (chimp) (Kent et al. 2002). The dbSNP (Sherry et al. 2001) IDs for interferon regulator factor 5 (IRF5) and glutamate receptor 3B (GRIN3B) are rs199508964 and rs142516571, respectively. The allele frequencies were also obtained from the UCSC genome browser (Kent et al. 2002).
Simulations of Molecular Evolution
To test our ability to estimate protein substitution rates from sequence alignments as a function of indel to substitution ratio, we used indelible (Fletcher and Yang 2009) to simulate 100 amino acid proteins randomly generated from the amino acid frequencies found in yeast disordered regions under the WAG model with the default indel model. We let the ancestral protein evolve into two extant proteins at the evolutionary distance indicated and realigned them using MAFFT (Katoh et al. 2002). We estimated rates of evolution using AAML for pairwise comparison from the PAML package (Yang 2007) assuming WAG evolution and filtering gapped columns on both the true alignments (obtained from indelible) and the MAFFT alignments. For each evolutionary distance, we did 100 replicates.
Results
Single Nucleotide Polymorphisms in Disordered Regions Show Evidence for Negative Selection
To compare patterns of evolution in disordered regions with those exhibited by structured protein regions, we divided the protein coding regions of S. cerevisiae into three parts (see Materials and Methods): Disordered regions, conserved protein domains (hereafter referred to as “Pfam domains”), and all other proteins regions, which we expect to consist largely of globular, “ordered” proteins. Although computational predictions of disordered regions include errors, we expect them to be strongly enriched for disordered regions. Errors in prediction will lead our estimates of the differences between types of proteins to be conservative. To exclude regions of disorder within Pfam domains (Williams et al. 2013), we excluded from our analysis ∼5% of residues that were predicted to be disordered within the Pfam domains.
To determine the relative importance of natural selection in driving amino acid alterations within eukaryotic proteins, we determined the ratio of nonsynonymous (amino acid changing) to synonymous polymorphisms (Pa/Ps) in the S. cerevisiae genome and observed Pa/Ps values of 0.24, 0.090, and 0.13 for disordered regions, Pfam domains, and other ordered regions, respectively (fig. 2A). We also determined Pa/Ps ratios and indel polymorphism rates in humans, using data from the 1000 genomes project (1000 Genomes Project Consortium 2012). The Pa/Ps ratios in disordered regions, Pfam domains, and other ordered regions were 0.48, 0.36, and 0.40, respectively (fig. 1A). As expected, disordered regions had the highest Pa/Ps ratio, while Pfam domains showed the lowest value, a trend that is consistent with our findings in the S. cerevisiae genome. Because all these ratios are much lower than 1, it can be inferred that all three regions are under strong negative selection, albeit weaker in disordered regions relative to structured protein regions. To get a sense of the variability, we also computed these ratios for each gene and plotted the distribution (fig. 1B). The results were consistent with the pooled result above.
Fig. 1.

— Nonsynonymous to synonymous polymorphism ratios in disordered regions, Pfam domains, and other ordered regions in the Saccharomyces cerevisiae and human genomes. (A) The Pa/Ps ratio is highest in disordered regions (white) and lowest in Pfam domains (black) in S. cerevisiae and human proteins. (B) Pa/Ps ratios computed for each gene show a wide distribution, and there is significant overlap between the disordered regions (unfilled squares) and the more structured regions (unfilled triangles and filled circles).
One of the strongest predictors of protein evolutionary rate is the expression level of the protein, due in part to stronger natural selection to reduce the negative consequences of protein misfolding in highly expressed proteins (Drummond et al. 2005). Hence, we sought to rule out the possibility that the differences observed were due to differences in expression levels between the different types of proteins regions by determining Pa/Ps ratios as a function of protein expression levels (fig. 2A). This analysis revealed consistent differences in Pa/Ps values between disordered regions, Pfam domains, and other ordered regions at all expression levels. Interestingly, a clear negative correlation (R2 = 0.73, P = 0.002) was observed for disordered regions. Although disordered regions might not be expected to show a correlation between the rate of evolution and expression level under the model of selection against protein misfolding (Drummond et al. 2005), there are several reasons why this might be expected, such as spurious protein–protein interactions (Yang et al. 2012), amyloid formation (Knowles et al. 2014), and folding upon target binding (Love et al. 1995; Bowers et al. 1999; Young et al. 2000). As above, to get an idea of the variability in these values, we averaged the per gene Pa/Ps ratios and plotted the mean and three times the standard error (fig. 2B). Once again, we found that disordered regions have higher Pa/Ps ratios across the whole range of expression levels. Taken together, these results indicate that reduced constraints in disordered regions are not likely to be due to overall expression differences between ordered and disordered protein regions.
Fig. 3.

— Frequency spectra of single nucleotide polymorphisms in the S. cerevisiae and human genomes. Nonsynonymous and synonymous SNPs are represented by black and white bars, respectively. (A) Allele frequencies of SNPs in yeast regions are all skewed toward lower frequencies. (B) Site frequency of spectra of nonsynonymous and synonymous SNPs in human is also skewed to the right. Only the first 10 bins of the spectra are shown for illustrative purposes.
Because inferences of selection pressures based on nonsynonymous to synonymous substitution ratios from polymorphism data may be less sensitive (Kryazhimskiy and Plotkin 2008), we analyzed DAF spectra in yeast (fig. 3A), which is an alternative method to infer selection (Nielsen 2005). The DAF spectra of nonsynonymous SNPs for all three regions were skewed toward low frequency SNPs relative to synonymous sites, which support the finding that all three regions are under negative selection, albeit weaker in disordered regions. The same trend is also observed for SNPs in humans (fig. 3B). It is important to note that population structure can also influence the DAF spectra, which we believe accounts for the minor peaks between allele frequencies of 0.5 and 0.7 (fig. 3A). Regardless, our conclusions based on comparisons between classes of SNPs in the genome remain unaffected because these factors are expected to equally influence all three regions.
Alleles at low frequencies are representative of new, random mutations, which are most likely to be deleterious, while alleles at higher frequencies reflect mutations that segregate and persist in the population either due to genetic drift or due to positive selection. As such, we analyzed the behavior of nonsynonymous to synonymous mutation ratios as a function of the DAFs of the respective SNPs (supplementary fig. S1, Supplementary Material online). For SNPs with DAF < 10%, there were 1.36, 0.78, and 0.57 amino acid changing polymorphisms for every synonymous one in disordered regions, other ordered regions, and Pfam domains, respectively. In contrast, this ratio respectively decreased to 0.77, 0.39, and 0.25 for SNPs with DAF > 10% (high frequency). Assuming that the differences between these ratios are due to the removal of deleterious mutations by natural selection, we determined that 43% (1−0.77/1.36) of the nsSNPs (non-synonymous single nucleotides) (n = 4,277) in disordered regions with DAFs < 10% were deleterious. This fraction increased to 51% (1 − 0.39/0.78) in other ordered regions (n = 7,242) and 56% (1 − 0.25/0.57) in Pfam domains (n = 959). As expected, this suggests that disordered regions are more tolerant of new mutations compared with Pfam domains and other ordered regions. Taken together, we can infer that disordered regions evolve under similar, albeit weaker constraints relative to structured protein regions.
Increased Proportion of Nearly Neutral Sites in Disordered Regions Indicates Weaker Negative Selection
To assess whether negative selection is relaxed in disordered regions relative to structured regions in humans, the DFE of new mutations in these regions was estimated using DFE-alpha (Keightley and Eyre-Walker 2007), which models demographic changes explicitly, unlike Pa/Ps ratios. This approach uses the SFS to infer potential fitness consequences of new point mutations in particular regions. The SFS of SNPs segregating in 105 unrelated individuals of the Yoruba (YRI) population of the 1000 genomes project (1000 Genomes Project Consortium 2012) was used for this analysis. By comparing the SFSs of nonsynonymous SNPs with synonymous SNPs, the strength of negative selection acting upon nonsynonymous changes can be estimated. The DFE of nonsynonymous mutations is shown in figure 4 in terms of Nes, a measure of the efficacy of negative selection, where Ne is the effective population size and s is the selective coefficient. If their product Nes is <1, mutations segregate like neutral mutations. The DFE estimated for nonsynonymous mutations within all regions (fig. 4) is consistent with previous reports for humans (Haerty and Ponting 2013) and other mammals (Halligan et al. 2010). If only about 5% of disordered regions, representing short linear motifs (Nguyen Ba et al. 2012), were under negative selection, then 95% of sites would be found in the nearly neutral bin (Nes < 1). This is clearly not the case, because only 24% of nonsynonymous sites were identified as nearly neutral. This finding is instead consistent with moderately weaker negative selection acting in these regions compared with structured regions with the majority of nonsynonymous changes still being selected against.
Fig. 5.

— Boxplots of the fraction of nearly neutral sites where biochemical changes can occur. Disordered regions show significantly greater fraction of nearly neutral sites for positions that change disordered to ordered amino acids (A), as well as ordered to disordered (B). Distribution is based on bootstrapped replicates as described in Materials and Methods. O and D refer to amino acids found at relatively higher proportions in ordered and disordered regions, respectively.
Fig. 4.

— Distribution of fitness effects of nonsynonymous sites in disordered regions (white), other ordered regions (light gray), and Pfam domains (dark gray) in humans. Synonymous sites within each region were used as the neutral reference. Error bars correspond to bootstrapped (n = 200) 95% confidence interval. *,** indicate that the proportion of sites in disordered regions is significantly different from other ordered regions at P < 0.05 and P < 0.005, respectively, based on a randomization test of the bootstrap replicates.
To test whether these patterns were caused by the specific biochemical properties of disordered regions, or simply due to overall relaxed selection in disordered regions, the DFE of nonsynonymous substitutions to amino acids that are more or less predominant in particular regions was also assessed. Disordered regions contain proportionately more charged and Proline residues and have a smaller proportion of hydrophobic residues compared with globular protein regions (Xie et al. 1998; Uversky et al. 2000; Singh et al. 2006; Theillet et al. 2013). On the basis of these observations, we chose L, I, V, F, and Y to represent amino acids that are more abundant in ordered regions (“O” residues) and we chose D, E, P, S, and N to represent amino acids more common in disordered regions (“D” residues). Nonsynonymous substitutions involving amino acids in these two sets were polarized and classified based on whether they changed the residue from “O” to “D” or not. For example, a nonsynonymous change from L to P was classified as O→D, a change from an ordered residue to a disordered residue. Each invariable site was counted as a different polarized class based on what substitution would be caused by every possible point mutation. As expected, a higher proportion of substitutions causing O→O and D→D changes are effectively neutral, meaning they are under less negative selection on average, than either O→D and D→O changes, respectively, over all regions (supplementary fig. S2, Supplementary Material online). In other words, changes between these residue groupings are less likely to be detrimental to fitness than changes across the groupings, as proteins tend to preserve the biochemical type of their amino acids.
We sought to test whether the efficacy of selection to retain the biochemical type of amino acid was similar in ordered regions and disordered regions. To do so, we computed the fraction of the total nearly neutral sites (Nes < 1) that change the biochemical type. For example, is the fraction of neutral biochemically changing sites for the “O” residues. In defining this fraction, FO→D, we are controlling for the total number of neutral sites, which we found above to be higher in disordered regions (fig. 4). We find that the fraction of neutral biochemically changing sites is higher in disordered regions than in other more structured regions (both FO→D, fig. 6A, and FD→O, fig. 6B; Wilcoxon test, P < 10−6). This confirms that negative selection acts to preserve these biochemical types of residues more strongly within ordered regions, as opposed to simply being stronger proportionately over all residues.
Fig. 6.

— Frequency of insertions/deletions per kilobase pair (Kb) in disordered regions, Pfam domains, other ordered regions, and noncoding DNA in S. cerevisiae and humans. (A) The number of indel polymorphisms per Kb as a function of indel size for disordered regions (unfilled squares), other protein regions (gray squares), Pfam domains (filled squares) and Non-coding DNA (unfilled triangles). (B) Gray bars represent indels that were observed in multiples of three (nonframeshifting indels). White bars represent indels that were not found as multiples of three (frameshifting indels). The frequency of frameshifting indels (Diso) in disordered regions is similar to that of Pfam domains (Pfam). The frequency of nonframeshifting indels in disordered regions is similar to that of noncoding DNA (NonC), and much higher than the frequency of frameshifting indels. (C, D) Indels in the human genome display similar patterns as in yeast. (E) The fraction of out of frame indels is lower in proteins than expected based on noncoding regions (dashed line), but is higher at the termini of proteins, consistent with reduced selection on indels in the termini. This effect does not explain the difference between disordered regions (unfilled squares) and other protein regions (gray squares).
Disordered Regions Show Greater Indel Polymorphism than Ordered Regions
Given that disordered regions have been predicted to be locations of increased rates of insertions and deletions (Toth-Petroczy and Tawfik 2013), we sought to test for differences in the abundance of indel polymorphism in disordered regions in comparison with structured protein regions. We computed the rate of indel polymorphisms in disordered regions, Pfam domains, other ordered regions, and noncoding DNA in S. cerevisiae and in humans (see Materials and Methods). As expected, we find periodic variation (multiples of three) in the rate of indels in protein coding regions of all types. However, we observed a greater than 10-fold increase in the rate of nonframeshifting (in frame) indels in disordered regions compared with Pfam domains (fig. 6A). Interestingly, frameshifting indels in disordered regions are similar in rate to other protein coding regions (fig. 6B), but the rate of nonframeshifting indels is similar between disordered regions and indels sizes that are multiples of three in noncoding DNA. To illustrate the remarkable difference in rates between disordered regions and Pfam domains, we note that the rate of nonframeshifting (in frame) indels in yeast disordered regions is approximately 8-fold higher than frameshifting indels, whereas in Pfam domains, the rate of nonframeshifting (in frame) indels is less than half of that of frameshifting indels. The indel polymorphism patterns in human protein coding regions also show a periodic pattern as expected (fig. 6C). As in yeast, we observed that nonframeshifting indels in disordered regions are much more frequent relative to Pfam domains and other ordered regions, and show a similar rate to indels in pseudogenes (and pseudogene introns) that are multiples of three. As with the yeast indels, the differences between regions are dramatic: The rate of nonframeshifting (in frame) indels in disordered regions is 2.8 times higher than frameshifting indels, while the frequency of nonframeshifting indels in Pfam domains is less than one half of that of frameshifting indels. Moreover, the frequency of nonframeshifting (in frame) indels in disordered regions is approximately 9-fold higher than that of nonframeshifting indels in Pfam domains (fig. 6D). Collectively, our analyses on human indel polymorphisms show similar trends to those observed in S. cerevisiae, suggesting that the observed patterns may be universal to eukaryotic proteins. The polymorphism frequency for nonframeshifting (in frame) indels, which reaches the frequency expected based on noncoding sequences, suggests that they are under much weaker constraints in disordered regions than in other protein regions.
Segregating frameshift causing indels in the yeast population are enriched near the C-termini of proteins (Liti et al. 2009), presumably because frameshifts at the C-terminus are less likely to disrupt protein function, and may simply result in the addition of additional residues and a new stop codon. We sought to rule out the possibility that the elevated rate of indels we observed in disordered regions was related to the enrichment of disordered proteins near the termini of proteins. We computed the fraction of indels that are out of frame as a function of position along the gene for indels that fall in disordered versus other protein regions (there were too few indels in Pfam domains to compute these fractions reliably across the protein length). We found that both disordered and other ordered protein regions show higher proportions of frameshifting indels at both N- and C-termini, probably due to the availability of alternative start and stop codons for many genes. Nevertheless, the proportion of frameshifting indels is dramatically lower for disordered regions across the whole length of the protein (fig. 6E). This is due to the elevated rate of in-frame indel polymorphism reported above, and consistent with the model that disordered regions are much more tolerant of in-frame indels, irrespective of the position in which these indels occur in protein.
The dramatic increase in rate of nonframeshifting indel polymorphism suggests that most of the large protein coding indels segregating in the human population will be found in disordered protein regions. In figure 7, we show examples of large indels segregating at high frequency in two important human proteins, IRF5 (Fan et al. 2010) and GRIN3B (Niemann et al. 2008). In the case of IRF5, an insertion seems to have appeared in the human–chimp ancestor and reached a frequency of 54.6% in the overall 1000 Genomes population. This region is not of low complexity, but repeating codons could be increasing the region’s propensity for indels. Different length indels of similar sequence in orangutan, marmoset, and squirrel monkey support this idea. Interestingly, the orangutan genome appears to contain a similar, albeit independent, insertion in this region. In the case of GRIN3B, the deletion likely represents the derived state, and removes nine amino acids in around 16% of the 1000 genomes population. These examples also illustrate the difficulty in properly aligning rapidly evolving disordered regions over long evolutionary distances.
Fig. 7.
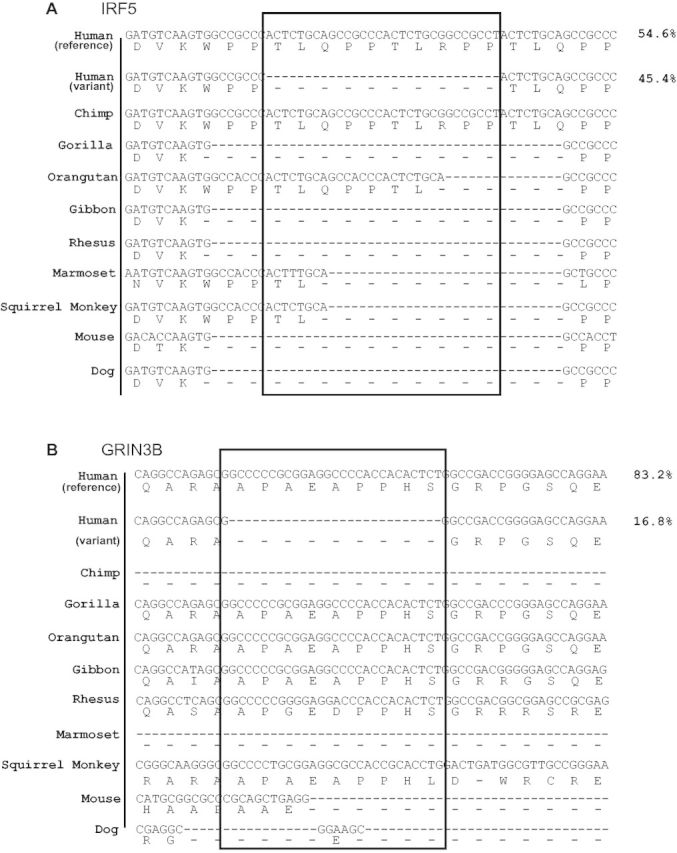
— Multiple sequence alignments of indel and subset of Multiz 100 vertebrate alignment. For each species, the first row represents DNA sequence alignments, while the second row of letters represents the amino acid sequence alignments corresponding to each codon. The black boxes highlight the region of insertion/deletion. The percentage value corresponding to each human protein alignment represents the frequency of the respective allele. (A) Alignment of the insertion TLQPPTLRPP (ten amino acids) in the IRF5 protein in humans. (B) Alignment of the deletion APAEAPPHS (nine amino acids) in the GRIN3B (Glutamate receptor) protein in humans.
We considered whether the dramatic increase in indel rates we observed in disordered regions could cause the difficulty in aligning disordered regions, and speculated that errors in alignment could explain the rapid rates of substitutions observed in disordered regions over long evolutionary distances. We tested this hypothesis using simulations of molecular evolution under standard models of molecular evolution (see Materials and Methods), but we found that at the range of indel to substitution ratios consistent with the yeast polymorphism data (0.05–0.1), estimates of substitution rate are still accurate to long evolutionary distances (supplementary fig. S3, Supplementary Material online).
Discussion
We used two population-based methods to study the strength of selection on intrinsically disordered protein regions. Both Pa/Ps ratios and the DFE support weaker negative selection on substitutions in disordered regions. Prior analysis using a sequence alignment approach coincides with this interpretation (Brown et al. 2002).
Using the DFE approach we also exploited polarized nonsynonymous changes to compare changes from amino acid residues that are more predominant in ordered regions (“O” residues) with those that are more predominant in disordered regions (“D” residues) and vice versa. While there are more nearly neutral potential sites for all these “biochemical” changes in disordered regions relative to other regions, the magnitude of increase in nearly neutral sites is not equal across the different categories of changes. This finding suggests not only overall weaker negative selection in disordered regions, but also subsets of nonsynonymous changes having fundamentally different fitness consequences in disordered regions compared with more structured regions. Switching states between “D” and “O” amino acids could be potentially more deleterious in structured regions, because they would more likely disrupt secondary structures of the peptide sequence. In contrast, the observation that switching residues in disordered regions is less deleterious compared with structured regions suggests that the composition of residues is more important for the functions of disordered regions, rather than their primary sequence. This is in accordance with previous evidence that the type of residue found in a disordered region is more strongly conserved than the amino acid sequence in that region (Moesa et al. 2012).
Although disordered regions showed reduced constraints on amino acid changing polymorphisms relative to structured proteins, the rate of amino acid polymorphism was not dramatically different. In contrast, although rates of frameshifting mutations in disordered regions and Pfam domains are similar, nonframeshifting indels in disordered regions are much more abundant, approaching the frequencies observed in pseudogenes and noncoding DNA. This is consistent with other recent studies that associate indels with disordered regions (de la Chaux et al. 2007; Light, Sagit, Ekman, et al. 2013; Light, Sagit, Sachenkova, et al. 2013; Toth-Petroczy and Tawfik 2013).
We suggest that segregating nonframeshifting indels in disordered regions are largely neutral, allowing these regions to change their size with minimal functional consequences. This inherent plasticity of disordered regions, which is not evident in ordered regions, is consistent with models suggesting that the lack of a stable protein conformation might be functionally advantageous by allowing the flexibility to interact with many different targets (Dyson and Wright 2002, 2005). Although the consistency of these observations with models of disordered region function is appealing, it is also possible that mutational biases may play a role in preferentially producing nonframeshifting indels in disordered regions (due, e.g., to repetitive or low-complexity amino acid sequences; fig. 6A). If natural selection is not strong enough to counteract this elevated mutation rate, increased rates of indel polymorphism and divergence are expected under this mutation bias model as well. Although preceding investigations have suggested the former, recent systematic analysis of selection on protein coding indels suggests complex interactions between selection and mutation (Chong et al. 2013). We speculated that poor quality alignments and large rates of substitution typically observed in disordered regions might be due simply to the increased rate of indels. However, standard simulations of molecular evolution indicate that elevated indel rates alone are insufficient to bias the estimation of evolutionary rates. In the context of more realistic mutation processes (e.g., indels that are the result of small duplications, rather than random amino acids, and substitution models that yield the equilibrium distribution of disordered regions), alignment errors could still account for some of the patterns of evolution observed in disordered regions. Nevertheless, it is reassuring that our study of polymorphism and simulations of molecular evolution generally corroborate previous work based on more distant evolutionary comparisons.
While our SNP and indel polymorphism analyses of human and yeast proteins identified trends that are consistent across both species, the absolute values of the Pa/Ps ratios and indel frequencies were different. The Pa/Ps ratio in the human population is closer to a value of 1 for two possible reasons: There is either less negative selection in humans, or human samples have diverged more recently from their most recent common ancestor. Indel mutations on the other hand occur at much lower frequencies in humans relative to yeast (Lynch et al. 2008), which may partially account for the overall lower frequency of indels in humans as shown in figure 1.
Conclusion
Our investigation suggests that amino acid polymorphisms in disordered regions of both humans and yeast are under slightly weaker negative selection compared with structured protein regions. In contrast, the rate of in-frame indel polymorphisms in disordered regions is dramatically elevated, similar to that of noncoding DNA. Our findings using population genomics confirm recent observations regarding the evolution of disordered regions based on interspecific comparisons, and indicate that disordered regions are probably the major source of segregating protein length variation in the human population.
Supplementary Material
Supplementary figures S1–S3 are available at Genome Biology and Evolution online (http://www.gbe.oxfordjournals.org/).
Acknowledgments
The authors thank Dan Halligan for use of his custom DFE-alpha script. Thanks to Keith Dunker, Julie Forman-Kay, and Robert Vernon for reading earlier drafts of the manuscript. A.N.N.B. and G.M.D. are funded by postgraduate scholarships from the Natural Sciences and Engineering Research Council of Canada (NSERC). A.M.M. is supported by a NSERC Discovery grant and Canadian Institutes of Health research (grant MOP-119579). This research was supported by infrastructure grants from the Canadian Foundation for Innovation to A.M.M.
Literature Cited
- 1000 Genomes Project Consortium. 2012. An integrated map of genetic variation from 1,092 human genomes. Nature 491:56–65. [DOI] [PMC free article] [PubMed] [Google Scholar]
- Alberts B, et al. 2002. Molecular biology of the cell. 4th ed. New York: Garland Science. [Google Scholar]
- Bellay J, et al. 2011. Bringing order to protein disorder through comparative genomics and genetic interactions. Genome Biol. 12(2):R14. [DOI] [PMC free article] [PubMed] [Google Scholar]
- Berg JM, Tymoczko JL, Stryer L. 2002. Biochemistry. Chapter 3, Protein structure and function. 5th ed. New York: W. H. Freeman. [Google Scholar]
- Bergstrom A, et al. 2014. A high-definition view of functional genetic variation from natural yeast genomes. Mol Biol Evol. 31(4):872–888. [DOI] [PMC free article] [PubMed] [Google Scholar]
- Bowers PW, Schaufler LE, Klevit RE. 1999. A folding transition and novel zinc finger accessory domain in the transcription factor ADR1. Nat Struct Biol. 6:478–485. [DOI] [PubMed] [Google Scholar]
- Brown CJ, Johnson AK, Daughdrill GW. 2010. Comparing models of evolution for ordered and disordered proteins. Mol Biol Evol. 27(30):609–621. [DOI] [PMC free article] [PubMed] [Google Scholar]
- Brown CJ, et al. 2002. Evolutionary rate heterogeneity in proteins with long disordered regions. J Mol Evol. 55(1):104–110. [DOI] [PubMed] [Google Scholar]
- Chen JW, Romero P, Uversky VN, Dunker AK. 2006. Conservation of intrinsic disorder in protein domains and families: I. A database of conserved predicted disordered regions. J Proteome Res. 5:879–887. [DOI] [PMC free article] [PubMed] [Google Scholar]
- Cherry JM, et al. 2012. Saccharomyces Genome Database: the genomics resource of budding yeast. Nucleic Acids Res. 40(Database issue):D700–D705. [DOI] [PMC free article] [PubMed] [Google Scholar]
- Chong Z, et al. 2013. The evolution of small insertions and deletions in the coding genes of Drosophila melanogaster. Mol Biol Evol. 30(12):2699–2708. [DOI] [PubMed] [Google Scholar]
- Colak R, et al. 2013. Distinct types of disorder in the human proteome: functional implications for alternative splicing. PLoS Comput Biol. 9(4):e1003030. [DOI] [PMC free article] [PubMed] [Google Scholar]
- Daughdrill GW, Narayanaswami P, Gilmore SH, Belczyk A, Brown CJ. 2007. Dynamic behaviour of an intrinsically unstructured linker domain is conserved in the face of negligible amino acid sequence conservation. J Mol Evol. 65(3):277–298. [DOI] [PubMed] [Google Scholar]
- de la Chaux N, Meser PW, Arndt PF. 2007. DNA indels in coding regions reveal selective constraints on protein evolution in the human lineage. BMC Evol Biol. 7:191. [DOI] [PMC free article] [PubMed] [Google Scholar]
- Derrien T, et al. 2012. The GENCODE v7 catalog of human long noncoding RNAs: analysis of their gene structure, evolution, and expression. Genom Res. 22(9):1775–1789. [DOI] [PMC free article] [PubMed] [Google Scholar]
- Drummond DA, Bloom JD, Adami C, Wilke CO, Arnold FH. 2005. Why highly expressed proteins evolve slowly. Proc Natl Acad Sci U S A. 102(40):14338–14343. [DOI] [PMC free article] [PubMed] [Google Scholar]
- Dunker AK, Lawson JD, Brown CJ, Williams RM, Romero P, Oh JS, Oldfield CJ, Campen AM, Ratliff CM, Hipps KW, et al. 2001. Intrinsically disordered protein. J Mol Graph Model. 19(1):26–59. [DOI] [PubMed] [Google Scholar]
- Dyson H, Wright P. 2002. Coupling of folding and binding for unstructured proteins. Curr Opin Struct Biol. 12(1):54–60. [DOI] [PubMed] [Google Scholar]
- Dyson H, Wright P. 2005. Intrinsically unstructured proteins and their functions. Nat Rev Mol Cell Biol. 6(3):197–208. [DOI] [PubMed] [Google Scholar]
- Fan JH, et al. 2010. Association between IRF-5 polymorphisms and risk of acute coronary syndrome. DNA Cell Biol. 29(1):19–23. [DOI] [PubMed] [Google Scholar]
- Finn RD, Clements J, Eddy SR. 2011. HMMER web server: interactive sequence similarity searching. Nucleic Acids Res. (Web Server Issue) 39:W29–W37. [DOI] [PMC free article] [PubMed] [Google Scholar]
- Finn RD, et al. 2008. The Pfam protein families database. Nucleic Acids Res. 36(Database issue):D281–D288. [DOI] [PMC free article] [PubMed] [Google Scholar]
- Fletcher W, Yang Z. 2007. INDELible: a flexible simulator of biological sequence evolution. Mol Biol Evol. 26(8):1879–1888. [DOI] [PMC free article] [PubMed] [Google Scholar]
- Flicek P, et al. 2013. Ensembl 2013. Nucleic Acids Res. 41(Database issue):D48–D55. [DOI] [PMC free article] [PubMed] [Google Scholar]
- Galea CA, et al. 2006. Proteomic studies of the intrinsically unstructured mammalian proteome. J Proteome Res. 5:2839–2848. [DOI] [PubMed] [Google Scholar]
- Galea CA, et al. 2009. Large-scale analysis of thermostable, mammalian proteins provides insights into the intrinsically disordered proteome. J Proteome Res. 8:211–226. [DOI] [PMC free article] [PubMed] [Google Scholar]
- Garza AS, Ahmad N, Kumar R. 2009. Role of intrinsically disordered protein regions/domains in transcriptional regulation. Life Sci. 84(7–8):189–193. [DOI] [PubMed] [Google Scholar]
- Haerty W, Ponting CP. 2013. Mutations within lncRNAs are effectively selected against in fruitfly but not in human. Evolution 74:61–68. [DOI] [PMC free article] [PubMed] [Google Scholar]
- Halligan DL, Oliver F, Eyre-Walker A, Harr B, Keightley PD. 2010. Evidence for pervasive adaptive protein evolution in wild mice. PLoS Genet. 6(1):e1000825. [DOI] [PMC free article] [PubMed] [Google Scholar]
- Iakoucheva LM, Brown CJ, Lawson JD, Obradovic Z, Dunker AK. 2002. Intrinsic disorder in cell-signaling and cancer-associated proteins. J Mol Biol. 323:573–584. [DOI] [PubMed] [Google Scholar]
- Iakoucheva LM, et al. 2004. The importance of intrinsic disorder for protein phosphorylation. Nucleic Acids Res. 32:1037–1049. [DOI] [PMC free article] [PubMed] [Google Scholar]
- Jones DT, Cozzetto D. 2015. DISOPRED3: precise disordered region predictions with annotated protein-binding activity. Bioinformatics 31(6):857–863. [DOI] [PMC free article] [PubMed] [Google Scholar]
- Katoh K, Misawa K, Kuma K, Miyata T. 2002. MAFFT: a novel method for rapid multiple sequence alignment based on fast Fourier transform. Nucleic Acids Res. 30(14):3059–3066. [DOI] [PMC free article] [PubMed] [Google Scholar]
- Keightley PD, Eyre-Walker A. 2007. Joint inference of the distribution of fitness effects of deleterious mutations and population demography based on nucleotide polymorphism frequencies. Genetics 177:2251–2261. [DOI] [PMC free article] [PubMed] [Google Scholar]
- Keightley PD, Eyre-Walker A. 2012. Estimating the rate of adaptive molecular evolution when the evolutionary divergence between species is small. J Mol Evol. 74:61–68. [DOI] [PubMed] [Google Scholar]
- Kent WJ, et al. 2002. The human genome browser at UCSC. Genome Res. 12(6):996–1006. [DOI] [PMC free article] [PubMed] [Google Scholar]
- Knowles TP, Vendruscolo M, Dobson CM. 2014. The amyloid state and its association with protein misfolding diseases. Nat Rev Mol Cell Biol. 15(6):384–396. [DOI] [PubMed] [Google Scholar]
- Kryazhimskiy S, Plotkin JB. 2008. The population genetics of dN/dS. PLoS Genet. 4(12):e1000304. [DOI] [PMC free article] [PubMed] [Google Scholar]
- Light S, Sagit R, Ekman D, Elofsson A. 2013. Long indels are disordered: a study of disorder and indels in homologous eukaryotic proteins. Biochim Biophys Acta. 1834(5):890–897. [DOI] [PubMed] [Google Scholar]
- Light S, Sagit R, Sachenkova O, Ekman D, Elofsson A. 2013. Protein expansion is primarily due to indels in intrinsically disordered regions. Mol Biol Evol. 30(12):2645–2653. [DOI] [PubMed] [Google Scholar]
- Liti G, Carter DM, Moses AM, Warringer J, Parts L, James SA, Davey RP, Roberts IN, Burt A, Koufopanou V. 2009. Population genomics of domestic and wild yeasts. Nature. 458(7236):337–341. [DOI] [PMC free article] [PubMed] [Google Scholar]
- Love JJ, et al. 1995. Structural basis for DNA bending by the architectural transcription factor LEF-1. Nature 376:791–795. [DOI] [PubMed] [Google Scholar]
- Lynch M, et al. 2008. A genome-wide view of the spectrum of spontaneous mutations in yeast. Proc Natl Acad Sci U S A. 105(27):9272–9277. [DOI] [PMC free article] [PubMed] [Google Scholar]
- Moesa HA, Wakabayashi S, Nakai K, Patil A. 2012. Chemical composition is maintained in poorly conserved intrinsically disordered regions and suggests a means for their classification. Mol Biosyst. 8(12):3262–3273. [DOI] [PubMed] [Google Scholar]
- Nei M, Gojobori T. 1986. Simple methods for estimating the numbers of synonymous and nonsynonymous nucleotide substitutions. Mol Biol Evol. 5:418–426. [DOI] [PubMed] [Google Scholar]
- Nguyen Ba AN, et al. 2012. Proteome-wide discovery of evolutionary conserved sequences in disordered regions. Sci Signal. 5(215):rs1. [DOI] [PMC free article] [PubMed] [Google Scholar]
- Nielsen R. 2005. Molecular signatures of natural selection. Annu Rev Genet. 39:197–218. [DOI] [PubMed] [Google Scholar]
- Niemann S, et al. 2008. Motoneuron-specific NR3B gene: no association with ALS and evidence for a common null allele. Neurology 70(9):666–676. [DOI] [PubMed] [Google Scholar]
- Nilsson J, Grahn M, Wright AP. 2011. Proteome-wide evidence for enhanced positive Darwinian selection within intrinsically disordered regions in proteins. Genome Biol. 12(7):R65. [DOI] [PMC free article] [PubMed] [Google Scholar]
- Ren S, Uversky VN, Chen Z, Dunker AK, Obradovic Z. 2008. Short linear motifs recognized by SH2, SH3, and Ser/Thr kinase domains are conserved in disordered protein regions. BMC Genomics 9(Suppl 2):S26. [DOI] [PMC free article] [PubMed] [Google Scholar]
- Sherry ST, et al. 2001. dbSNP: the NCBI database of genetic variation. Nucleic Acids Res. 29(1):308–311. [DOI] [PMC free article] [PubMed] [Google Scholar]
- Singh GP, Ganapathi M, Sandhu KS, Dash D. 2006. Intrinsic unstructuredness and abundance of PEST motifs in eukaryotic proteomes. Proteins 62:309–315. [DOI] [PubMed] [Google Scholar]
- Szalkowski AM, Anisimova M. 2011. Markov models of amino acid substitution to study proteins with intrinsically disordered regions. PLoS One 6(5):e20488. [DOI] [PMC free article] [PubMed] [Google Scholar]
- Theillet FX, et al. 2013. The alphabet of intrinsic disorder: I. Act like a Pro: On the abundance and roles of proline residues in intrinsically disordered proteins. Intrinsically Disordered Proteins 1:5–17. [DOI] [PMC free article] [PubMed] [Google Scholar]
- Toth-Petroczy A, Tawfik DS. 2013. Protein insertions and deletions enabled by neutral roaming in sequence space. Mol Biol Evol. 30(4):761–771. [DOI] [PubMed] [Google Scholar]
- Toth-Petroczy A, et al. 2008. Malleable machines in transcription regulation: the mediator complex. PLoS Comput Biol. 4:e1000243. [DOI] [PMC free article] [PubMed] [Google Scholar]
- UniProt Consortium. 2014. Activities at the Universal Protein Resource (UniProt). Nucleic Acids Res. 42:D191–D198. [DOI] [PMC free article] [PubMed] [Google Scholar]
- Uversky VN, Gillespie JR, Fink AL. 2000. Why are “natively unfolded” proteins unstructured under physiologic conditions?. Proteins 41(3):415–427. [DOI] [PubMed] [Google Scholar]
- Uversky VN, Oldfield CJ, Dunker AK. 2008. Intrinsically disordered proteins in human diseases: introducing the D2 concept. Annu Rev Biophys. 37:215–246. [DOI] [PubMed] [Google Scholar]
- Wang M, et al. 2012. PaxDb, a database of protein abundance averages across all three domains of life. Mol Cell Proteomics. 11(8):492–500. [DOI] [PMC free article] [PubMed] [Google Scholar]
- Ward JJ, Sodhi JS, McGuffin LJ, Buxton BF, Jones DT. 2004. Prediction and functional analysis of native disorder in proteins from the three kingdoms of life. J Mol Biol. 337:635–645. [DOI] [PubMed] [Google Scholar]
- Williams RW, Xue B, Uversky VN, Dunker AK. 2013. Distribution and cluster analysis of predicted intrinsically disordered protein Pfam domains. Intrinsically Disordered Proteins 1:e25724. [DOI] [PMC free article] [PubMed] [Google Scholar]
- Xie Q, et al. 1998. The Sequence Attribute Method for Determining Relationships Between Sequence and Protein Disorder. Genome Inform Ser Workshop Genome Inform. 9:193–200. [PubMed] [Google Scholar]
- Yang JR, Liao BY, Zhuang SM, Zhang J. 2012. Protein misinteraction avoidance causes highly expressed proteins to evolve slowly. Proc Natl Acad Sci U S A. 109(14):E831–E840. [DOI] [PMC free article] [PubMed] [Google Scholar]
- Yang Z. 2007. PAML 4: phylogenetic analysis by maximum likelihood. Mol Biol Evol. 24(8):1586–1591. [DOI] [PubMed] [Google Scholar]
- Young ET, Kacherovsky N, Cheng C. 2000. An accessory DNA binding motif in the zinc finger protein Adr1 assists stable binding to DNA and can be replaced by a third finger. Biochemistry 39:567–574 [DOI] [PubMed] [Google Scholar]
Associated Data
This section collects any data citations, data availability statements, or supplementary materials included in this article.