

Abstract
The topography, or the anatomical connectivity, of the excitatory entorhinal-dentate-CA3 circuit of the rat hippocampus has been implemented for a large-scale, biologically realistic, computational model of the rat hippocampus. The implementation thus far covers only the excitatory synapses for the principal neurons in the hippocampal subregions. Starting from layer II of the entorhinal cortex, the projection of their perforant path axons has been mapped across the full extent of the dentate gyrus as well as to the CA3. The mossy fiber axon trajectories from the dentate granule cells to the CA3 pyramidal cells have been derived, incorporating the transverse route the fibers take through the CA3c and CA3b and the septo-temporal turn in the CA3a. The extensive arborization of the CA3 pyramidal axons have been modeled using 2-D, skewed Gaussian distributions which have been parametrized to exhibit the differences that exist among the CA3a, CA3b, and CA3c auto-associational projections. Using the limited samples available from the literature, key parameters for each projection have been interpolated as a function of transverse and/or septo-temporal position in order to create a more complete representation of the topography.
I. INTRODUCTION
Memory is an essential component of cognition, and at the center of memory lies the hippocampus, a brain structure that converts short-term memory into long-term memory. This conversion process is the result of a cascade of nonlinear, spatiotemporal transformations that is performed on memory-related, multi-modal inputs as they propagate and interact throughout the internal circuitry of the hippocampus. In order to characterize the spatiotemporal transformations that are performed to re-encode short-term memory into long-term memory, we are constructing a large-scale, biologically realistic, computational model of the rat hippocampus. The focus of this paper is the implementation of topography in our model.
The topography describes the structural connectivity, or the wiring diagram, of the network which, at an anatomical level, is determined by the distribution and branching structure of pre-synaptic axons which transmit input, the branching structure of the neurons’ dendrites which receive input, and the spatial densities of the neurons themselves. Thus, the spatial aspect of the spatiotemporal transformations is fundamentally tied to the topography of the network. However, topography also affects the temporal transformation by determining which sets of inputs can drive a given neuron. The dendrite structure is determined by the morphology of the neurons and is the focus of a different paper. This paper focuses on the axon distributions and the densities of the neurons.
We are implementing the topography using the classic trisynaptic loop as a starting point. The trisynaptic loop suggests that spatiotemporal patterns of input propagate in a feed-forward manner through the 3 subregions of the hippocampus in the following order: the dentate gyrus (DG), the CA3, and the CA1. Most of the input to the hippocampus is specified by the entorhinal cortex (EC) layer II neurons which project primarily to the dentate gyrus. The principal neurons of the DG are the granule cells, and the principal neurons of the CA3 are the CA3 pyramidal cells. The basic anatomy of the hippocampus is summarized in Fig. 1.
Fig. 1.

Overall structure of the rat hippocampus and one cross section. The classical trisynaptic loop can be seen on the right demonstrating the feedforward nature of the internal circuitry.
Our implementation of topography serves not only to calculate a connectivity matrix for the hippocampal neural network but to take into account the delays in the propagation of input due to the conduction of action potentials along the axons of the neurons. In a previous work, we described the implementation of topography between the EC and the DG, and the current work will describe the implementation of the EC to CA3 projection, the DG to CA3 projection, and the CA3-CA3 auto-associative projection. Because the EC to CA3 projection is closely related to the EC to DG projection, the previous work will also be summarized.
II. METHODS
A. Defining the Dentate Gyrus and CA3 Boundaries
Although the hippocampus is a 3-dimensional structure, anatomists have been able to construct 2-dimensional maps of the DG and CA3 representing the structures in their unfolded state. The hippocampal subregions can be unfolded due to their ”V”- or ”C”-like cross-sectional geometries. Thus, 2-dimensional coordinates of the somatic locations of the neurons can be assigned using two axes: the septo-temporal axis and the transverse axis. A transverse cross-section would result in the ”V”- or ”C”- shape, and from this perspective, the septo-temporal axis would extend into and out of the page.
The DG is divided transversely into two blades. The infrapyramidal blade lies outside of the CA3-CA1, and the suprapyramidal blade is enclosed by the CA3-CA1. Gaarskjaer measured the unfolded septo-temporal and transverse dimensions of the DG as well as the density of granule cells in both the infrapyramidal and suprapyramidal blades of the DG along the septo-temporal axis [1]. The DG dimensions were used to construct a 2-dimensional map whereupon locations for the granule cell soma could be generated following the reported septo-temporal densities (Fig. 2).
Fig. 2.

Overall structure of the rat hippocampus and one cross section. The classical trisynaptic loop can be seen on the right demonstrating the feedforward nature of the internal circuitry.
The CA3 is divided transversely into regions known as the CA3a, CA3b, and CA3c. The CA3c lies closes to the DG, the CA3a lies furthest away from the DG, and the CA3b lies between the two. In the same work, Gaarskjaer also measured the density of the CA3 pyramidal cells along the septo-temporal axis, but the CA3 dimensions were not. The CA3 dimensions were obtained from Ishizuka et al’s work [2]. CA3 pyramidal cell soma locations were generated using the same methods as for the DG.
Using the our current view point on the 2-dimensional CA3 map, we can imagine a 3rd dimension that extends out of and into the page that is divided into different layers. These layers correspond to different sections of the neurons’ morphologies. The somatic layer would lie on the map, the basal dendrites would extend into the page, and the apical dendrites would extend out of the page. Thus, the maps that we generate do not entirely eliminate the 3rd-dimension and actually act as a change of coordinates.
B. Layer II of Entorhinal Cortex to Dentate Gyrus
The bundle of axons that originate in the EC and project to the DG is known as the perforant path, and the perforant path connects the EC layer II cells to the DG granule cells. Dolorfo and Amaral performed a series of experiments that revealed a startling septo-temporal organization to the EC-DG perforant path projection [3]. They reported that the EC could be divided into 4 sections that project to 4 septo-temporally organized quartiles on the DG (Fig. 3A). Using the density and area of labeling as a weight, we calculated the proportion of cells that would project to a particular quartile [4]. Essentially, we were able to extract the distribution of the perforation points as the axons reached the DG. Upon perforating, the axons branch outwards forming an axon terminal field. These axon terminal fields are reported to extend across the entire transverse extent of the DG and 1–2 mm in the septo-temporal direction. The axon terminal fields are modeled using a one-dimensional gaussian distribution centered at the perforation point with a standard deviation of 0.167 mm in the septo-temporal direction.
Fig. 3.
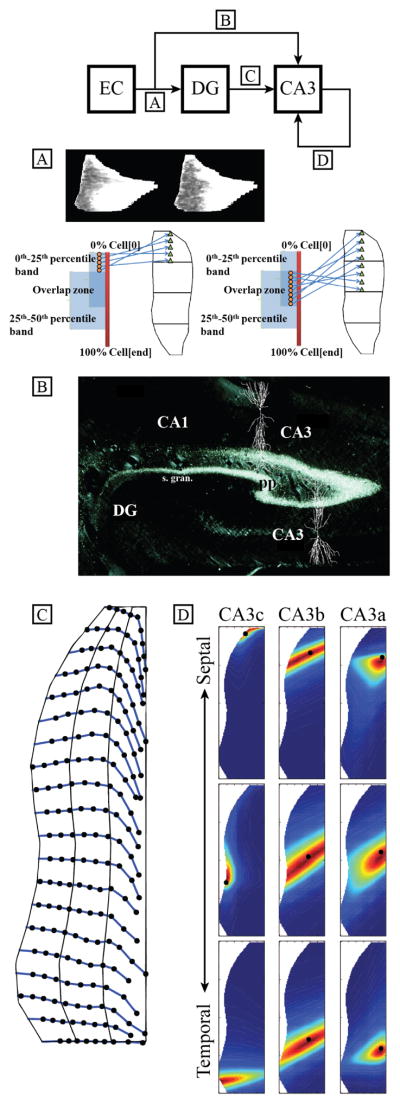
(Top) Summary of the implemented topography. (A) The integration of the weighted area due to labeling was used to calculate the proportion of EC cells that would project to its respective quartile of the DG. (B) An anterograde tracer study demonstrating the extent of the perforant path axon terminal field that is present in the CA3 with CA3 pyramidal cells superimposed. (C) Example mossy fiber trajectories from the topography implementation. (D) 2-dimensional, skew Gaussian distributions tuned to the 9 samples reported in Ishizuka et al.
C. Layer II of Entorhinal Cortex to CA3
The axon terminal fields of the perforant path conform to the ”V” shape of the DG. On the infrapyramidal blade, the axons terminate where the infrapyramidal blade terminates, but on the suprapyramidal blade side, the perforant path axon terminal fields extend beyond the suprapyramidal blade boundary to reach the dendrites of the CA3 pyramidal cells [5]. Fig. 3B shows labelling of the perforant path in the CA3 of a rabbit hippocampus. Thus, the septo-temporal organization of the EC projection to the CA3 is tied to the organization derived for the projection to the DG. In our implementation, the axon terminal fields extend all the way across the CA3. However, we use the overlap between suprapyramidal blade of the DG and the CA3 as a physical barrier that prevents the CA3 cells that lie beneath the overlap from receiving EC input. The axon terminal fields for the EC-CA3 projection follow the same Gaussian distribution as for the EC-DG projection except that CA3 cells that lie beneath the suprapyramidal blade have zero probability of receiving EC input.
D. Dentate Gyrus to CA3
The axons of the DG granule cells that project to the CA3 are known as mossy fibers. The trajectory of a mossy fiber has been shown to follow a very characteristic course through the CA3. From the granule cell’s septo-temporal position, the mossy fiber travels in a predominantly transverse direction across the CA3c and CA3b, but upon reaching the CA3a, the mossy fiber turns toward the temporal pole of the hippocampus. Swanson et. al reported the aggregate mossy fiber trajectories originating from different septo-temporal positions along the DG by injecting the granule cells with a tracer[6]. They then estimated the changes in individual trajectories as a function of the granule cell’s septo-temporal position.
Using 17 equally-spaced sampling points along the transverse axis, the mossy fibers originating from a given septo-temporal level were parametrized as the change in septo-temporal position with respect to the septo-temporal origin. The deviation as a function of septo-temporal location was interpolated using a 4th-order polynomial function resulting in 17 polynomial functions for each of the samples along the transverse axis. Given a granule cell’s septo-temporal position in the DG, 17 points corresponding to the mossy fiber’s trajectory could be computed. Variability was added to the points by multiplying a factor to the septo-temporal deviation that followed a random uniform distribution between 0.7 and 1.3. The actual mossy fiber was finally computed using a 1-dimensional cubic-spline interpolation through the 17 points (Fig. 3C).
In a different study, the inter-synapse distance along the mossy fibers were reported with significant differences between the 3 transverse subregions of the CA3: 162 ± 12.6μm in the CA3c, 223 ± 19.3μm in the CA3b, and 345 ± 27.5μm in the CA3a [7]. Using this information, potential synapse locations were derived for each granule cell by creating an algorithm that would create synaptic locations along the generated mossy fibers using the inter-synapse distance distributions for each of the transverse CA3 subregions.
The mossy fibers travel through specific layers (or strata) of the CA3 corresponding depending on whether the mossy fibers originate from the infrapyramidal blade or suprapyramidal blade of the DG. The suprapyramidal mossy fibers travel exclusively through the apical stratum lucidum, but the infrapyramidal mossy fibers follow a different route. Through the CA3c, the infrapyramidal mossy fibers travel through the basal layer but cross to the stratum lucidum at the CA3c-CA3b interface. The infrapyramidal mossy fibers then remain in the stratum lucidum. This was implemented in our topography by having the infrapyramidal mossy fibers by simply stepping the mossy fibers from the basal layer to the stratum lucidum once they reach the CA3c-CA3b interface.
E. CA3 to CA3
Although the previous topographies described excitatory feedforward connections, one of the unique features of the hippocampus compared to the organization of the other cortical structures is the extensive amount of excitatory feedback that is present from the CA3 to itself. In a study by Ishizuka et al., injections were made along 3 septo-temporal levels encompassing the CA3 as well as across the 3 tranverse subregions of the CA3 in order to characterize the CA3 auto-associative topography [2]. The results indicated that there are differences in the extent of axon arborization depending on both the transverse and septo-temporal position of the CA3 pyramidal cell. To summarize, the CA3c neurons projects primarily to the CA3c neurons while the CA3a and CA3b neurons project across the entire transverse extent of the CA3.
The auto-associative axon terminal fields were modeled using a 2-dimensional skewed Gaussian distribution as seen in (4) with x corresponding to the transverse axis and y corresponding to the septo-temporal axis, and the 6 parameters were hand-tuned to the 9 samples reported by the injection study (Fig. 3D).
| (1) |
| (2) |
| (3) |
| (4) |
An interpolation of the parameters was performed using cubic splines only along the septo-temporal extent, treating the CA3c, CA3b, and CA3a as discrete transverse regions.
The CA3 auto-associative connections traverse through two layers of the CA3: an apical layer called the stratum radiatum and a basal layer called the stratum oriens. In a different study, the experimenters were able to determine the differences in axon length that are located in the stratum radiatum or the stratum oriens for a given CA3 pyramidal cell in the different transverse subregions of the CA3 [8]. The axon lengths in each layer were integrated to calculate the proportion of axon terminal field that lie in the stratum oriens versus the stratum radiatum. The proportion was interpolated across the transverse extent to determine the distribution of axons between the two layers in the transverse direction.
F. Creating Synaptic Connections
Two different connection algorithms were implemented. For the entorhinal and CA3 auto-associative axons, the axons were modeled probabilistically because there is little information that quantifies the structural arborization of their axon terminal fields, but information on their densities exist. The density of the axon terminal field at a certain point in space determined the probability that a synapse would form between an axon and a dendrite in that space. The densities from the axon terminal fields of all of the pre-synaptic input neurons at the location of a post-synaptic neuron were collected and were normalized to one to create the probability that an input neuron would connect to the post-synaptic neuron. The total number of inputs that a neuron could receive was limited to the reported number of spines that a neuron type had on its dendrites. This connection algorithm used the post-synaptic neuron’s perspective as the spine densities of the granule cells and CA3 pyramidal cells are known and can be distributed through the morphologies while the specific axon terminal field structure remained unknown.
The second connection algorithm used the perspective of the pre-synaptic neuron and was applied to the mossy fiber projection because the inter-synapse distance along the mossy fiber had been reported and could be used to constrain how synapses were distributed throughout the mossy fiber as it traversed the CA3. Given a mossy fiber trajectory and the synapse locations, synaptic connections were created between the mossy fiber and the CA3 pyramidal cell synapse closest to the synaptic location.
III. DISCUSSION
With over one million neurons in our large-scale model, viewing the model as a connectivity matrix is computationally, resource intensive but also visually unedifying. However, graph theory is well established and has been used to quantify various neural networks making it a promising tool for analysis.
Having already seen how the EC causes spatio-temporal activity in the granule cells in Yu et al., it will be our next step to investigate how this activity will propagate through the mossy fibers and interact with the additional EC input and CA3 auto-associational activity in the CA3. Ultimately, we want to tie topography back to functionality, and these simulations and the quantification of their spatio-temporal patterns will help achieve this goal.
Acknowledgments
This work was not supported by any organization
Work supported by grant U01 GM104604. Computation for the work was supported by the University of Southern California Center for High-Performance Computing and Communications (www.usc.edu/hpcc).
Contributor Information
Gene Yu, Email: geneyu@usc.edu.
Dong Song, Email: dsong@usc.edu.
Theodore W. Berger, Email: berger@usc.edu.
References
- 1.Gaarskjaer FB. Organization of the mossy fiber system of the rat studied in extended hippocampi. I. Terminal area related to number of granule and pyramidal cells. Journal of comparative neurology. 1978 Mar;178(1):49–72. doi: 10.1002/cne.901780104. [DOI] [PubMed] [Google Scholar]
- 2.Ishizuka N, Weber J, Amaral DG. Organization of intrahippocampal projections originating from CA3 pyramidal cells in rat. Journal of comparative neurology. 1990 May;295(4):580–623. doi: 10.1002/cne.902950407. [DOI] [PubMed] [Google Scholar]
- 3.Dolorfo CL, Amaral DG. Entorhinal cortex of the rat: topographic organization of the cells of origin of the perforant path projection to the dentate gyrus. Journal of Comparative Neurology. 1998 Aug;398(1):25–48. [PubMed] [Google Scholar]
- 4.Yu GJ, Robinson BS, Hendrickson PJ, Song D, Berger TW. Implementation of topographically constrained connectivity for a large-scale biologically realistic model of the hippocampus. 34th Annual International Conference of the IEEE EMBS; 2012; [DOI] [PMC free article] [PubMed] [Google Scholar]
- 5.Tamamaki N, Nojyo Y. Projection of the entorhinal layer II neurons in the rat as revealed by intracellular pressure-injection of neurobiotin. Hippocampus. 1993 Oct;3(4):471–80. doi: 10.1002/hipo.450030408. [DOI] [PubMed] [Google Scholar]
- 6.Swanson LW, Wyss JM, Cowan WM. An autoradiographic study of the organization of intrahippocampal association pathways in the rat. Journal of comparative neurology. 1978 Oct;181(4):681–716. doi: 10.1002/cne.901810402. [DOI] [PubMed] [Google Scholar]
- 7.Acsady L, Kamondi A, Sik A, Freund T, Buzsaki G. GABAergic cells are the major postsynaptic targets of mossy fibers in the rat hippocampus. Journal of neuroscience. 1998 May;18(9):3386–3403. doi: 10.1523/JNEUROSCI.18-09-03386.1998. [DOI] [PMC free article] [PubMed] [Google Scholar]
- 8.Li XG, Somogyi P, Ylinen A, Buzsaki G. The hippocampal CA3 network: An in vivo intracellular labeling study. Journal of comparative neurology. 1994 Jan;339(1):181–208. doi: 10.1002/cne.903390204. [DOI] [PubMed] [Google Scholar]