Abstract
We have developed a gamma-ray imaging system that combines a high-resolution silicon detector with two sets of movable, half-keel-edged copper-tungsten blades configured as crossed slits. These apertures can be positioned independently between the object and detector, producing an anamorphic image in which the axial and transaxial magnifications are not constrained to be equal. The detector is a 60 mm × 60 mm, one-millimeter-thick, one-megapixel silicon double-sided strip detector with a strip pitch of 59 μm. The flexible nature of this system allows the application of adaptive imaging techniques. We present system details; calibration, acquisition, and reconstruction methods; and imaging results.
Index Terms: Adaptive, anamorphic imaging, crossed slits, double-sided strip detector, DSSD, low energy, silicon, small animal, SPECT, 125I, 103Pd
I. Introduction
Small-animal SPECT imaging is a useful tool for studying disease biology as well as monitoring response to treatment in rodent models. Interest in imaging small lipid and protein plaques such as those found in Alzheimer’s, Parkinsons, and atherosclerotic disease is motivating the development of high-resolution imaging systems [1]. Some current preclinical systems achieve high resolution through high magnification, but with a concomitant loss of field of view (FOV) [2]–[4]. High-resolution imaging requires the use of small pinholes, making it necessary to use multiple pinholes to maintain reasonable sensitivity, which again ultimately limits the FOV [5], [6].
By combining an adaptive aperture configuration with a high-resolution silicon detector, we are able to acquire high-resolution projections that we reconstruct using a novel OSEM technique. While the stopping power of silicon is low for many common clinical radioisotopes, its performance is sufficient in the range of 20–60 keV. The low-energy emissions of 125I fall within this energy window, and the 60-day half life provides an advantage for longitudinal studies. In this paper, we discuss the design and construction of a prototype SPECT system that offers flexible anamorphic magnification in addition to high-resolution imaging and report on calibration and reconstruction methods.
II. Anamorphic Imaging
It is often the case in small-animal imaging that the proportions of the animal do not match the proportions of the imaging detector: gamma cameras are often square, and imaging a full mouse body through a pinhole with a circular scan will leave portions of the camera face unused. Helical scanning techniques can make better use of the available detector area, though this requires additional acquisitions as the animal is translated through the system’s FOV [7]. As an alternative, it is also possible to fill the detector area by using anamorphic imaging techniques, in which the relative magnifications in the x and y directions are not equal. This can be accomplished by replacing a pinhole aperture with a pair of crossed slits, separated in space along the imaging axis, as suggested by Zeng [8]. The sensitivity of this collimation scheme was analyzed by Ayan et al. [9].
The separation between slits decouples the magnification in the axial and transaxial directions, creating a projection with a different aspect ratio than that of the object being imaged [8]. A simple cartoon of this configuration is shown in Fig. 1. When the vertical slit is closer to the object than the horizontal slit, this aperture configuration produces images with high transaxial resolution, and also reduces the extent of the axial artifacts seen in reconstructions from circular-orbit pinhole-acquired images [10], [11]. This crossed-slit aperture has been implemented in an adjustable system configuration. The magnifications in the x and y directions are determined by adjusting the relative distances between the object, slits, and detector such that each acquisition fills the detector area [12].
Fig. 1.
A simplified diagram of a crossed-slit aperture configuration demonstrates the effects of anamorphic imaging. Separated slits decouple the magnification in the x and y directions. The resulting image has a different aspect ratio than that of the object.
III. System design
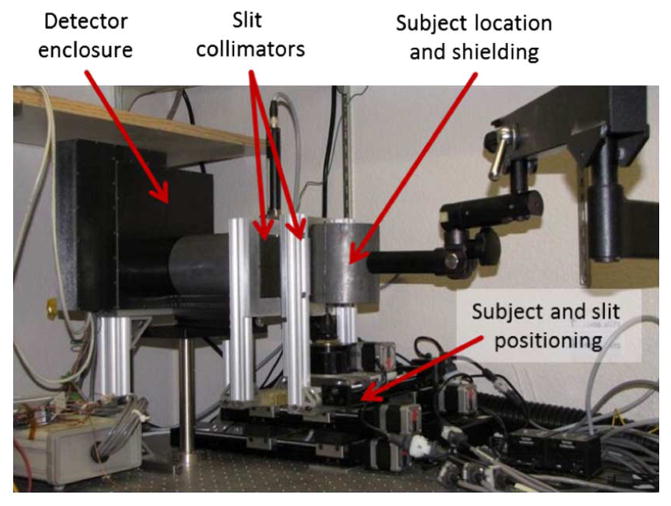
The anamorphic system makes use of a high-resolution silicon detector, copper-tungsten crossed slits, and a number of positioning stages to control the relative magnifications and FOV for a given acquisition. The following sections describe the design and operation of each system component, as well as the range of adaptive configurations of the complete system. A photograph of the assembled system is provided in Fig. 2.
Fig. 2.
A photograph of the anamorphic SPECT system. Two orthogonal slits are adjusted independently to permit maximum magnification of the object onto the high-resolution DSSD.
A. Silicon Double-Sided Strip Detector
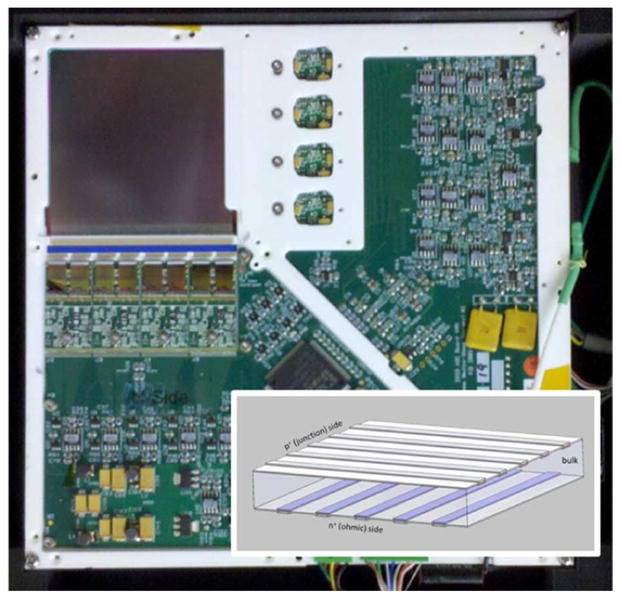
The double-sided strip detector (DSSD) used in this system comprises a one-millimeter-thick silicon detector with a 60 mm × 60 mm active area manufactured by SINTEF, and readout electronics produced by IDEAS, both located in Norway. There are 1024 conducting strips on each side of the detector, with one side’s strips oriented orthogonally with respect to the strips on the opposite side. A photograph of the detector and a conceptual diagram of the DSSD configuration are provided in Fig. 3. When a gamma ray is absorbed in the detector bulk, the resulting charge-pair cloud is separated by an applied 300 V reverse bias: electrons are swept to the N side of the detector, and holes to the P side. This outward charge movement induces a current at one or more strips on each side of the detector, which can trigger the electronics to report a detected event. The following section provides information about the triggering and readout cascade and other operating characteristics of this detector.
Fig. 3.
Inset: schematic illustrating the orientation of the conducting strips in a double-sided strip detector. The high-resolution silicon DSSD combines the information from 1024 crossed strips on each side of the detector to offer true megapixel resolution and list-mode photon counting.
1) Triggering and Electronic Readout
The triggering and readout of the signals detected at strips are accomplished by VaTaGP6 application-specific integrated circuits (ASICs) from IDEAS [13]. Each ASIC is responsible for monitoring 128 conducting strips; eight ASICs are required on each side of the detector. User-programmable digital-to-analog converters (DACs) must be adjusted for each channel to tune the triggering thresholds across all 1024 strips to achieve detector uniformity [14]. Fig. 4 provides a diagram of the pulse-processing circuitry for a single channel.
Fig. 4.
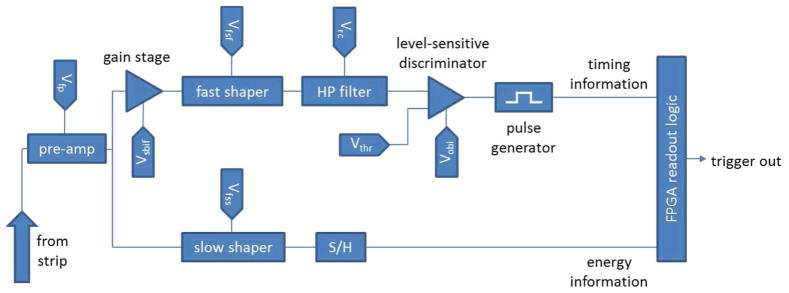
Schematic for the triggering logic for a single ASIC channel. Two separate arms are used to extract timing and energy information from the signal induced on a conducting strip.
The signal on a single detector strip is monitored with two separate arms in the ASIC circuitry. A “slow” arm shapes the signal from the strip and a sample-and-hold register stores the value of the most recent signal peak, while a “fast” arm trades signal-to-noise for a faster trigger. When the signal in a fast arm surpasses its DAC-determined threshold, a pulse generator fires the sample-and-hold register in the slow arm and signals that a trigger has occurred. Read-out logic in a field-programmable gate array initiates an A/D conversion of stored analog values in the slow arm and assigns timing information to the detected event. The resulting list-mode data stream is a concatenation of time stamps and independent event information from both sides of the detector. Events from each side must be paired using the timing information to determine the location of the gamma-ray interaction.
The reported event data include the address of the triggered strip and an ADC value representing the sample-and-hold register in the slow arm. The user may also direct the detector to report the ADC values of the strips on either side of the triggered channel. The collection of ADC values are useful for estimating the energy deposited in the detector and can be used to reject events that, for example, deposit energy in multiple locations due to an initial Compton scatter.
2) Operating Energy Range
The one-millimeter-thick silicon detector has a low stopping power for many of the gamma rays produced from radiotracers used in clinical SPECT imaging, but its absorption characteristics are appropriate for detecting photons with energies in the 15–60 keV range [15]. The detection efficiency can also be increased by stacking detectors to increase the effective silicon thickness [16]. Table I lists the gamma-ray energies of the 125I emission spectrum and the percent absorbed in one millimeter of silicon. The total 125I detection efficiency is 28%.
TABLE I.
Constituent 125I Gamma-Ray Energies and Their Relative Emission [17] and Absorption [18] Percentages
| Energy (% emitted) | % absorbed |
|---|---|
| 27.2 keV (39.60%) | 30.787% |
| 27.5 keV (73.10%) | 29.976% |
| 30.9 keV (6.74%) | 21.694% |
| 31.0 keV (13.00%) | 21.694% |
| 31.7 keV (3.75%) | 20.333% |
| 35.5 keV (6.68%) | 14.726% |
| Total % absorbed: | 28.091% |
3) Intrinsic Resolution
With 1024 × 1024 crossed strips, the detector has a total of 10242 detecting elements, for true one-megapixel resolution. The strip pitch is 59 μm, and an intrinsic resolution commensurate with the strip pitch was confirmed with shadow images of a line-pair phantom [19]. This, coupled with the large number of effective pixels formed by the crossed strips of the DSSD, permits us to acquire images with very high intrinsic resolution. Fig. 5 provides an example of the images acquired of brachytherapy seeds with the crossed-slit system for 50 μm and 250 μm slit widths.
Fig. 5.

Internal structure of the brachytherapy seeds used in these experiments (a). These seeds are described in Section IV-B. Rapid-prototyping techniques permit the design and fabrication of test phantoms in which the seeds can be arranged in known and repeatable positions. The phantom shown in (b) was imaged through our system to demonstrate the intrinsic resolution of the DSSD for slit widths of 50 μm (c) and 250 μm (d).
4) Detector Enclosure
The DSSD is mounted vertically in an enclosure designed in SolidWorks™ and fabricated in black plastic with a rapid prototyping printer. The enclosure is necessary to shield the detector and ASICs from ambient light, and to provide protection to the many thousands of delicate wire bonds connecting the detector, ASICs, and electronic boards. An exhaust fan circulates air through the enclosure across the ASICs, which operate at 15–20 degrees C above the ambient temperature when receiving adequate air flow. The fan connects to a port on the detector enclosure via an eight-foot flexible hose, minimizing electrical interference from the fan motor. All power, data, and temperature probes enter the enclosure through a light-blocking maze on the opposite side of the box that also serves as the air-intake port.
B. Crossed Slits
The high-precision slits developed for this system consist of two pairs of five-millimeter-thick machinable 20% copper/ 80% tungsten blades with a 30-degree bevel and 280 μm keel edge. The half-keel design permits the two slits to come into contact with each other to form a rectangular pinhole if desired. These blades are mounted to aluminum plates; one blade is fixed and the other slides on brass ball bearings. Spring pressure between the blade plates maintains the slit width as set by motorized-micrometer actuators mounted on the side of the slit frame. The slit width can be adjusted in 200 nm increments. A close-up view of the slits’ construction is provided in Fig. 6.
Fig. 6.
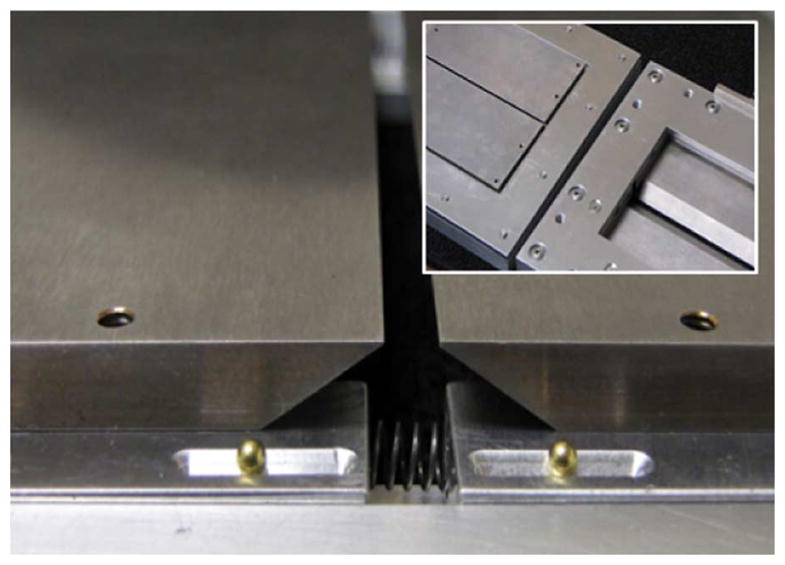
The adjustable copper-tungsten slit design allows precise control over the aperture width. Inset: both sides of the entire slit housing. The slits were designed with half-keel edges to permit the slits to come into contact, forming a rectangular pinhole with equal x and y magnifications.
C. Adjustable Components
In addition to the two linear actuators that specify the slit width, six additional linear stages control the positioning of the object and the two slits relative to the fixed detector enclosure. The slits are mounted to individual plates on a single Velmex linear stage with a dual-threaded lead screw; this stage controls the relative separation between the slits. This stage that supports the two slits is mounted on top of a second linear stage that translates the slit assembly between the object and the detector. Four stages control the object positioning: two small Velmex stages position the object in x and z, and a Thorlabs motorized lift controls the vertical (y) position. The object is mounted on a compact Velmex rotation stage mounted on top of the x – z stage. In this system, it is more convenient to define the rotation axis as y rather than the usual convention of z. The linear stages can be moved in steps of 2.5 μm. Table II lists the range of motion of each of the adjustable stages in the system, which permits the range of geometric parameters listed in Table III.
TABLE II.
Range of Motion of the Linear Stages in the System
| Stage name | Travel range |
|---|---|
| Object x position | 0–50 mm |
| Object y position | 0–50 mm |
| Object z position | 0–120 mm |
| Slit separation | 5–100 mm |
| Slit translation | 0–200 mm |
| Horizontal slit width | 50 μm–4 mm |
| Vertical slit width | 50 μm–4 mm |
TABLE III.
Range of Geometric Parameters in the System
| Geometric parameter | Value range |
|---|---|
| px | minimum: 40 mm |
| py | minimum: 40 mm |
| qx | maximum: (sd-50) mm |
| qy | maximum: (sd-50) mm |
| sd | 110–230 mm |
| magx | 0.85–4 |
| magy | 0.85–4 |
D. System Optical Properties
These components combine to form an extremely flexible SPECT system, which can be configured to support magnifications between 0.85 and 4 and FOVs between 15 mm × 15 mm and 70 mm × 70 mm, though the transaxial FOV cannot be larger than the axial FOV. Sensitivity and resolution can be controlled further by adjusting each slit’s width between 50 μm and 4 mm.
IV. Geometric Calibration
It is not practical to directly measure and store a full system matrix H for this adaptable system [12]: a full measured system matrix with 1013 voxels and 60 one-megapixel projections requires 235 TB for a single acquisition configuration, as shown in Table IV. However, we can model any system configuration with a small set of parameters from which we can generate elements of the system matrix as needed. The following section discusses the geometric forward model for the crossed-slit projections and the calibration and estimation techniques employed to determine the geometric system parameters.
TABLE IV.
Storage Requirements for System Matrix Using Single Precision Floating Point Numbers
| Storage type | Description | Storage size |
|---|---|---|
| single full PSF | 1024x1024 pixels | 32MB |
| full measured H | 60 projections, 101 x 101 x 101 voxels | 235 TB |
| sparse matrix storage | assumes 31x31 pixels/PSF | 221.31 GB |
| coefficient storage | 6 parameters/PSF | 1.38 GB |
| geometric parameters | 11 parameters | 0.04 kB |
A. Geometric System Parameters and Forward Model
Bequé et al. describe the geometric parameters necessary to characterize a single-pinhole SPECT camera [20]; we have modified this model to include the additional parameters required to describe the slit apertures in our system. For a non-rotated detector with sides parallel to the horizontal and vertical slits, the center of the PSF projection on the 2D detector face (u, v) for a point source located at (x, y, z) can be expressed as:
| (1a) |
| (1b) |
Here, x refers to the transaxial direction, y is the axial direction, and z is the imaging direction; these parameters are illustrated in Fig. 7 and correspond to the descriptions listed in Table V. In the more general case where the detector is not located in a plane parallel to the slits, we calculate the intersection of the central ray with a tilted detector plane (x′, y′, z′) and rotate the resulting point back to the normal position to determine the absolute pixel position (u, v):
| (2) |
where sd is the distance in the z-direction between the center of rotation of the object and the center of the detector, and Rψ, Rϕ, Rθ are the respective three-dimensional rotation matrices for twist, tilt, and rotation:
| (3a) |
| (3b) |
| (3c) |
Fig. 7.
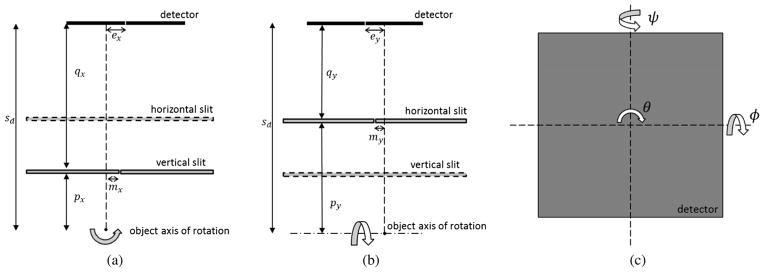
Diagram of the geometric parameters used in the forward model. Separate geometric parameters are determined by the vertical slit (a) and horizontal slit (b) with respect to the defined center of the FOV and center point of the detector. Detector rotation parameters (c), shown as seen from the object position, are defined with respect to the center point of the detector. We also estimate 10 nuisance parameters to compensate for small offsets in the calibration phantom. The complete set of geometric parameters used in the calibration procedure are compiled in Table V.
TABLE V.
Parameters Estimated Using Contracting Grid Methods. Eleven Geometric Parameters are Necessary to Compute the System Matrix, But Ten Additional Nuisance Parameters Must also be Determined to Provide the Best Geometric Estimates
| Geometric parameters | Description |
|---|---|
| px | Distance between center of rotation and vertical slit |
| py | Distance between center of rotation and horizontal slit |
| qx | Distance between vertical slit and detector plane |
| qy | Distance between horizontal slit and detector plane |
| sd | Center of FOV to detector distance (redundant) |
| mx | Mechanical offset of vertical slit in the x direction |
| my | Mechanical offset of horizontal slit in the y direction |
| ex | Mechanical offset of detector in the x direction |
| ey | Mechanical offset of detector in the y direction |
| θ | Rotation about detector center in the x – y plane |
| ψ | Rotation parallel to y axis through the detector center |
| ϕ | Rotation parallel to x axis through the detector center |
| Nuisance parameters | Description |
| Δ | Phantom rotation offset |
| (δx,δz) | Phantom center displacement from axis of rotation |
| p | Phantom axis pivot point (0, 0, p) |
| α, β | Phantom pivot angles about (0, 0, p), axis of rotation |
| ol,2,4,5 | Seeds 1,2,4,5 vertical position offset |
The geometric model assumes that the slits are oriented orthogonally with respect to each other, and that the object’s axis of rotation is parallel to the vertical slit. It should also be noted that the point (u, v) as defined above is specified in units of distance and requires a further arithmetic transformation to obtain the actual pixel number.
B. Test and Calibration With Sealed Sources
Clinical brachytherapy rods are convenient alternatives to point sources for high-resolution calibration and test procedures. These hermetically sealed sources minimize the risk of contamination from long-half-life isotopes during testing. We currently use Isoaid sources for 125I applications; the 125I is adsorbed onto the surface of the internal 500 μm diameter silver rods [21]. Best Medical, International manufactures the 103Pd seeds, each containing six 500 μm diameter active ion-resin beads and a tungsten spacer [22]. Diagrams of the internal structures of these seeds are shown in Fig. 5(a).
C. Calibration technique
We extract information about the system geometry by measuring a set of projections of a known phantom, seen in Fig. 8(a), at multiple magnification settings. The centroid of each brachytherapy seed is calculated in each projection image, the superposition of which creates a set of elliptical paths, shown in Fig. 8(b). We derive the parameters using maximum-likelihood estimation with a contracting-grid method [23] in which we forward project the known object through sets of possible system configurations described by parameters sampled from across the parameter space spanned by Ω̂. The predicted data are compared to the calculated centroids with a cost function that sums squared errors between predicted and observed locations for all N data points:
| (4) |
when {θ, ϕ, ψ} = 0 and where
Fig. 8.
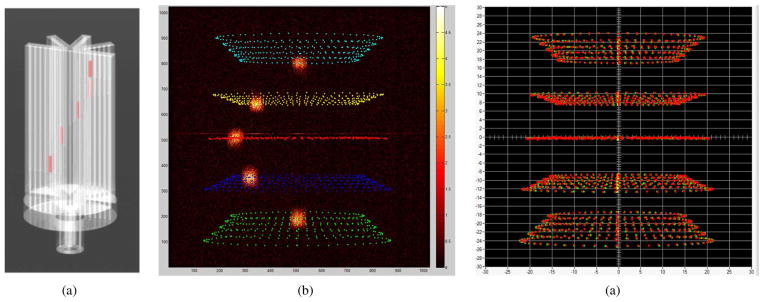
A Solidworks rendering of the geometric phantom used during calibration (a). The phantom allows five 4.7 mm long, 800 μm diameter cylindrical 125I brachytherapy rods to be inserted into holes at predetermined heights and radial distances from the center of the phantom to represent an object’s s5)ize. In this example, we acquired five sets of calibration data, each obtained with five rods located at a radial distance of 6 mm from the center of rotation and vertically separated in 7.5 mm increments. The phantom was imaged in 6-degree steps over 360 degrees. A total of N = 5 beads × 5 magnifications × 60 angular projections = 1500 centroid positions (superimposed over a single projection image) extracted from brachytherapy rod projections form the data set from which the geometric parameters are extracted (b). A contracting-grid algorithm employs maximum-likelihood methods to minimize the difference between measured (red) and estimated centroid positions (green) (c).
| (5) |
The vector Ωn represents the nuisance parameters describing details in the geometric phantom listed in Table V that are necessary to compute predicted images, but are not characteristic of the imaging system. The maximum-likelihood contracting-grid method minimizes the differences between a measured set of centroids (um,i, vm,i) and predicted forward projections (up,i, vp,i) of the brachytherapy rod centers. The smallest squared-distance sum acquired from the samples indicates the starting parameter values for the next iteration of the contracting grid [24]. The rms distance between the sets of measured and predicted centroids shown in Fig. 8(c) is 149 μm. Iterating over the subsets {(Δ, px, py, qx, qy), (mx, my, ex, ey), (θ, ϕ, ψ), Ωn}provides the fastest convergence to an estimated set of geometric parameters [12]. Fig. 8(c) illustrates the measured and estimated centroid data after 15 iterations of the contracting grid routine.
V. GPU-Enabled Reconstruction
The large number of detector elements and high-resolution voxel space make it impractical to store and manipulate a full system matrix during image reconstruction. However, our calibrated geometric parameters fully describe the system optical properties, allowing us to generate required portions of the system matrix on the fly during reconstruction. Recent advances in parallel computing permit the use of consumer-grade graphics processing units (GPUs) to implement fast image-reconstruction algorithms [25]. We have implemented a reconstruction algorithm on graphics processing units (GPUs), estimating the object with iterative ML-OSEM techniques:
| (6) |
where f̂ is a vector containing estimates of activity in each voxel fi, g is the collection of measured projection images, and hij are the elements of the system matrix H. One OSEM iteration can be broken into three major steps:
For each voxel fj:
Forward-project the current estimate of the object f̂ through the system to calculate an estimate ĝ of the measured data.
Scale the measured data g by the calculated estimate ĝ and back-project it through the system.
Scale the current voxel estimate by this value and normalize by the system sensitivity.
This algorithm requires every element of the system matrix for both the forward- and back-projection steps; an impossibly large amount of RAM would be required to hold the full system matrix in memory. Fortunately, the multicore GPU structure is readily harnessed for H-matrix calculation. The elements of the system matrix are never stored, but recomputed on the fly from the geometric system parameters whenever required. For each voxel, we employ the following method, illustrated in Fig. 9 to generate the corresponding point spread function (PSF):
Fig. 9.

During reconstruction, the required elements of the H matrix are computed on the fly in the GPU. One computational block considers a subset of pixels containing a single PSF (blue); each thread within the block computes the estimated irradiance detected at one pixel (red).
Dedicate one computation block within the GPU to calculate the projection of one voxel onto a region of pixels on the detector;
Forward-project the voxel center along the slit edges to determine the corners that define the PSF boundaries on the detector;
-
Identify the geometric center of the PSF and calculate the radiometry corresponding to this point:
(7) where dSi and μSi respectively refer to the thickness of the detector and the attenuation coefficient of silicon.
Use one thread within the GPU block to estimate the irradiance on each pixel within the projection, assuming the radiometry is constant across the small 59 μm × 59 μm pixel. The irradiance of pixels located at the boundaries of the PSF are estimated by subsampling the pixel area.
The sensitivity matrix of the system can be precomputed and stored before the first iteration of the OSEM algorithm. The back-projection step is accomplished by again implementing the forward model [25]: forward projections of the activity in each voxel j generate the elements hi,j associated with the PSF. The index pair (i, j) permits the association of the measured data gi with the voxel j, and the backprojection is performed piecewise for all elements in g as each individual product hi,jgi is added to element j of a temporary storage matrix. By generating elements of the system matrix on the fly, high-resolution reconstructions can be performed on a single NVIDIA GeForce GTX 580 desktop graphics card, which features 512 computing cores and 3 GB of onboard memory. The results of these intensive computations are presented in the following sections.
VI. Spatial Resolution
Separated slits require that the geometric spatial resolution is described in both axial and transaxial directions:
| (8a) |
| (8b) |
where Rg is the effective slit width and Ri is the pixel size. The high intrinsic resolution of the DSSD implies that the system resolution is dominated by the aperture geometry, though we partially compensate for the projection blur in our ML-based iterative reconstructions by incorporating the forward model in the calculations [26]; this is sometimes referred to as “resolution recovery” [27].
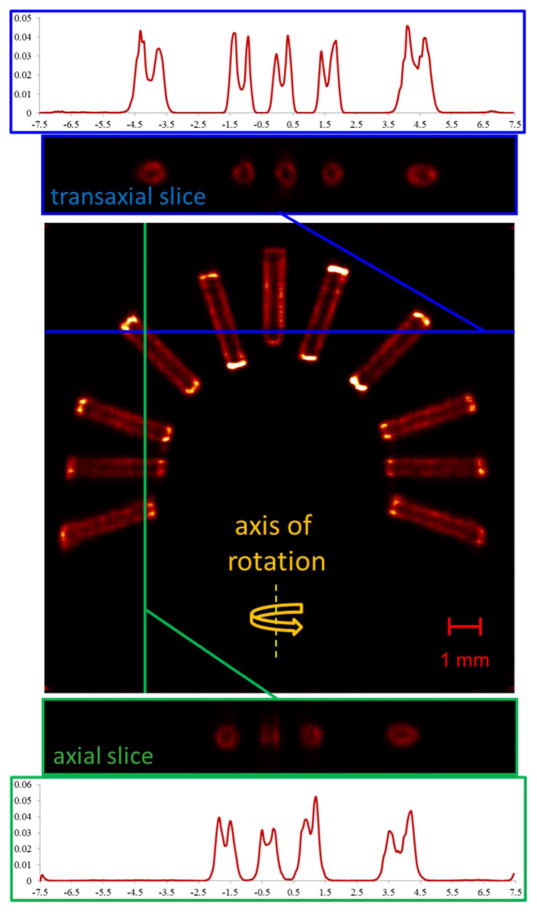
Fig. 10 shows cross-sectional slices through a reconstruction of a phantom holding a radial array of brachytherapy rods imaged through 250 μm slits. The geometric model predicts that this particular imaging configuration (mx = −4.14, my = −2.41) should demonstrate axial and transaxial resolutions Rox = 250.4 μm and Roy = 251.2 μm. The non-radioactive center of each 125I-coated rod is clearly visible in the reconstruction, however, demonstrating the value of accurate system modeling.
Fig. 10.
Cross-sectional slices through a reconstruction of 11 brachytherapy rods in the custom phantom shown in Figure IV-C. The acquisition axis of rotation is indicated on the coronal slice of the reconstruction (yellow). Transaxial slices (blue) through the volume demonstrate slightly higher resolution than axial slices (green), though the internal structure of the rods is evident at all rod orientations. The 255 × 255× 255-voxel reconstruction was performed on 60 15-minute projections acquired with 250 μm slits using five iterations of OSEM with five subsets.
Our ability to perform conventional resolution-measuring experiments is hampered by the lack of suitable ultrahigh-resolution phantoms. Nevertheless, we have characterized the system resolution using cross-sections through vertical and horizontal reconstructions of 125I brachytherapy rods of the type shown in Fig. 5(a). The data sets were acquired over 60 projections with 250 μm horizontal and vertical slits and were found to reconstruct rapidly with 10 iterations of OSEM with five subsets. More complicated objects with a diffuse background may require additional iterations. We modeled the seeds as 1-D slices through 395 μm diameter rods coated with 5 μm of active material to simulate 125I adsorption at the rod surface. To represent the image blurring due to the slit apertures, we convolved the seed model with a series of Gaussian functions of the form
| (9) |
with σ selected such that the full width at half maximum varied from 100 μm to 350 μm, and present the results in Fig. 11. These plots indicate that the resolution is ~225 μm in the axial direction and ~175 μm in the transaxial direction for this system configuration.
Fig. 11.
Gaussian profiles simulating aperture blur are convolved with the activity profile of the 125I brachytherapy rod, modeled with a 5 μm layer of activity coating a 395 μm diameter silver rod. These simulated image slices (color) are compared with the reconstructed data points, shown in black. The valleys of the axial (a) and transaxial (b) cross-sections suggest approximate resolutions of ~225 μm and ~175 μm, respectively. The data sets were reconstructed with 58.8 μm voxels from 60 projections with 10 iterations of five-subset OSEM.
VII. Energy Resolution
The DSSD’s electronics permit the readout of nearest-neighbor data to aid in determining the deposited energy; the median of the remaining surrounding strips can be used to correct for time-varying common-mode base-line shifts in the ADC signals. When 2N + 1 channels are read out per trigger event, the energy-corrected event data gi is calculated as:
| (10) |
where the central 2M + 1 channels cover the charge-sharing region of the detector as shown in Fig. 12(a). The resulting energy spectra, measured from flood acquisitions and shown in Fig. 12(b), are sufficient to discriminate between gamma-ray energies corresponding to 125I and 103Pd collected during simultaneous acquisitions, as demonstrated in the reconstruction shown in Fig. 12(c).
Fig. 12.
ADC values from the triggered channel and its adjacent strips are used to estimate the detected energy and remove common-mode fluctuations (a). Smoothed and normalized energy spectra for four isotopes on one p-side strip (b). The median energy resolution at the monoenergetic 241Am peak is 9.24% at 59.54 keV. Calibrated energy spectra allows discrimination between events from 125I and 103Pd. Energy information calculated from the list-mode acquisition data is used to parse events from each side of the detector before gamma-ray absorptions are identified. Each resulting data set is reconstructed separately and recombined in post-processing. A multi-energy reconstruction of 125I and 103Pd brachytherapy rods (c). The 255 ×255 ×255-voxel reconstruction was performed on 60 10-minute projections acquired with 250 μm slits using five iterations of OSEM with five subsets.
VIII. Conclusions
We have developed a high-resolution, anamorphic SPECT system. Replacing the standard pinhole aperture with independently adjustable crossed slits allows us to adapt the system configuration to make full use of the megapixel gamma-camera face. We extracted geometric system parameters with contracting-grid maximum-likelihood estimation from projections of a known phantom containing extended brachytherapy sources. We successfully used these system parameters to perform on-the-fly PSF generation as needed for an OSEM reconstruction routine using a consumer-grade graphics processor. Reconstructions of data acquired with 250 μm slits demonstrate ~ 225 μm axial resolution and ~175 μm transaxial resolution. The energy information obtained from each gamma-ray event provides sufficient energy resolution to support multi-isotope acquisitions of 125I and 103Pd. Design studies for a multicamera adaptive anamorphic system are under way.
Acknowledgments
The authors acknowledge Dr. Brian W. Miller for his helpful advice and assistance with CUDA programming.
Footnotes
Color versions of one or more of the figures in this paper are available online at http://ieeexplore.ieee.org.
References
- 1.Peterson TE, Furenlid LR. SPECT detectors: The Anger Camera and beyond. Phys Med Biol. 2011;56:R145–182. doi: 10.1088/0031-9155/56/17/R01. [DOI] [PMC free article] [PubMed] [Google Scholar]
- 2.Abbott MB, DeClerk YA, Chen YC, Furenlid LR, Wilson DW, Stevenson GD, Whitaker MK, Woolfenden JM, Moats RA, Barrett HH. 100-micron resolution SPECT imaging of a neuroblastoma tumor model. Mol Imag. 2006;5:214. [Google Scholar]
- 3.Miller BW, Furenlid LR, Moore SK, Barber HB, Nagarkar VV, Barrett HH. System integration of FastSPECT III, a dedicated SPECT rodent-brain imager based on BazookaSPECT detector technology. Proc IEEE Nuclear Science Symp Conf Rec. 2009:4004–4008. doi: 10.1109/NSSMIC.2009.5401924. [DOI] [PMC free article] [PubMed] [Google Scholar]
- 4.van der Have F, Vastenhouw B, Ramakers RM, Branderhorst W, Krah JO, Ji C, Staelens SG, Beekman FJ. U-SPECT-II: An ultra-high-resolution device for molecular small-animal imaging. J Nucl Med. 2009;50(4):599–605. doi: 10.2967/jnumed.108.056606. [DOI] [PubMed] [Google Scholar]
- 5.Schramm NU, Ebel G, Engeland U, Schurrat T, Behe M, Behr TM. High-resolution SPECT using multipinhole collimation. IEEE Trans Nucl Sci. 2003 Jun;50(3):315–320. [Google Scholar]
- 6.Mok GSP, Yu J, Du Y, Wang Y, Tsui BMW. Evaluation of a multi-pinhole collimator for imaging small animals with different sizes. Mol Imag Bio. 2012;14(1):60–69. doi: 10.1007/s11307-011-0472-8. [DOI] [PubMed] [Google Scholar]
- 7.Schramm NU, Lackas C, Hoppin JW, Forrer F, de Jong M. The nanoSPECT/CT: A high-sensitivity small-animal SPECT/CT with submillimeter spatial resolution. Eur J Nucl Med Mol Imag. 2006;33:S117. [Google Scholar]
- 8.Zeng GL. A skew-slit collimator for small-animal SPECT. J Nucl Med Tech. 2008;36(4):207. doi: 10.2967/jnmt.108.055582. [DOI] [PMC free article] [PubMed] [Google Scholar]
- 9.Ayan A, Metzler S, Accorsi R. Analytic derivation and monte carlo validation of a sensitivity formula for slit-slit collimation with penetration. IEEE Trans Nucl Sci. 2010 Feb;57(1):135–143. doi: 10.1109/TNS.2009.2030580. [DOI] [PMC free article] [PubMed] [Google Scholar]
- 10.Huang Q, Zeng GL. An analytical algorithm for skew-slit imaging geometry with nonuniform attenuation correction. Med Phys. 2006;33:997–1004. doi: 10.1118/1.2174719. [DOI] [PubMed] [Google Scholar]
- 11.Tang Q, Zeng GL, Huang Q. An analytical algorithm for skew-slit collimator SPECT with uniform attenuation correction. Phys Med Biol. 2006;51:6199. doi: 10.1088/0031-9155/51/23/018. [DOI] [PMC free article] [PubMed] [Google Scholar]
- 12.Durko H, Peterson T, Barrett H, Furenlid L. High-resolution, anamorphic, adaptive small-animal SPECT imaging with silicon double-sided strip detectors. Proc SPIE. 2011;8143:81430G. doi: 10.1117/12.896729. [DOI] [PMC free article] [PubMed] [Google Scholar]
- 13.Pettersen DM, Mikkelsen S, Talebi J, Meier D. A readout ASIC for SPECT. IEEE Trans Nucl Sci. 2005 Jun;52(3):764–771. [Google Scholar]
- 14.Durko HL, McDonald BS, Shokouhi S, Furenlid LR, Barrett HH, Peterson TE. Data-processing strategies for crossed-strip gamma-ray detectors. Proc IEEE Nuclear Science Symp Conf Rec. 2008:4091–4094. doi: 10.1109/NSSMIC.2008.4774181. [DOI] [PMC free article] [PubMed] [Google Scholar]
- 15.Shokouhi S, McDonald BS, Durko HL, Fritz MA, Furenlid LR, Peterson TE. Performance characteristics of thick silicon double sided strip detectors. Proc IEEE Nuclear Science Symp Conf Rec. 2007;2:1656–1660. doi: 10.1109/NSSMIC.2007.4437318. [DOI] [PMC free article] [PubMed] [Google Scholar]
- 16.Peterson TE, Shokouhi S, Furenlid LR, Wilson DW. Multi-pinhole SPECT imaging with silicon strip detectors. IEEE Trans Nucl Sci. 2009 Jun;56(3):646–652. doi: 10.1109/TNS.2009.2012514. [DOI] [PMC free article] [PubMed] [Google Scholar]
- 17.Brookhaven National Laboratory. Decay radiation search. 2012 Oct; [Online]. Available: http://www.nndc.bnl.gov/nudat2/indxdec.jsp.
- 18.National Institute of Standards, and Technology. XCOM: Photon cross sections database. 2012 Oct; [Online]. Available: http://www.nist.gov/pml/data/xcom/index.cfm.
- 19.Shokouhi S, McDonald BS, Durko HL, Fritz MA, Furenlid LR, Peterson TE. Thick silicon double-sided strip detectors for low-energy small-animal SPECT. IEEE Trans Nucl Sci. 2009 Jun;56(3):557–564. doi: 10.1109/TNS.2009.2019106. [DOI] [PMC free article] [PubMed] [Google Scholar]
- 20.Bequé D, Nuyts J, Suetens P, Bormans G. Optimization of geometrical calibration in pinhole SPECT. IEEE Trans Med Imag. 2005;24(2):180–190. doi: 10.1109/tmi.2004.839367. [DOI] [PubMed] [Google Scholar]
- 21.IsoAid, LLC. Isoaid Advantage I-125 seeds. 2012 Oct; [Online]. Available: http://isoaid.com/i125.html.
- 22.Best Medical, Inc. Best Palladium-103 source. 2012 Oct; [Online]. Available: http://www.teambest.com/products/seeds.pdf.
- 23.Hesterman JY, Caucci L, Kupinski MA, Barrett HH, Furenlid LR. Maximum-likelihood estimation with a contracting-grid search algorithm. IEEE Trans Nucl Sci. 2010 Jun;57(3):1077–1084. doi: 10.1109/TNS.2010.2045898. [DOI] [PMC free article] [PubMed] [Google Scholar]
- 24.Furenlid LR, Hesterman JY, Barrett HH. Fast maximum-likelihood estimation methods for scintillation cameras and other optical sensors (invited paper) Proc SPIE. 2007;6707 doi: 10.1117/12.740321. [DOI] [PMC free article] [PubMed] [Google Scholar]
- 25.Miller BW, Van Holen R, Barrett HH, Furenlid LR. A System Calibration and Fast Iterative Reconstruction Method for Next-Generation SPECT Imagers. IEEE Trans Nucl Sci. 2012 Oct;59(5):1990–1996. doi: 10.1109/TNS.2012.2198243. [DOI] [PMC free article] [PubMed] [Google Scholar]
- 26.Vandenberghe S, D’Asseler Y, Van de Walle R, Kauppinen T, Koole M, Bouwens L, Van Laere K, Lemahieu I, Dierckx RA. Iterative reconstruction algorithms in nuclear medicine. Comput Med Imaging Graph. 2001;25(2):105–112. doi: 10.1016/s0895-6111(00)00060-4. [DOI] [PubMed] [Google Scholar]
- 27.Vanhove C, Andreyev A, Defrise M, Nuyts J, Bossuyt A. Resolution recovery in pinhole SPECT based on multi-ray projections: A phantom study. Eur J Nucl Med Mol Imaging. 2007;34(2):170–180. doi: 10.1007/s00259-006-0225-0. [DOI] [PubMed] [Google Scholar]


